How to create a dashboard from a spreadsheet
Create a dashboard, add your sheets, then build it out with chart, data table, K...
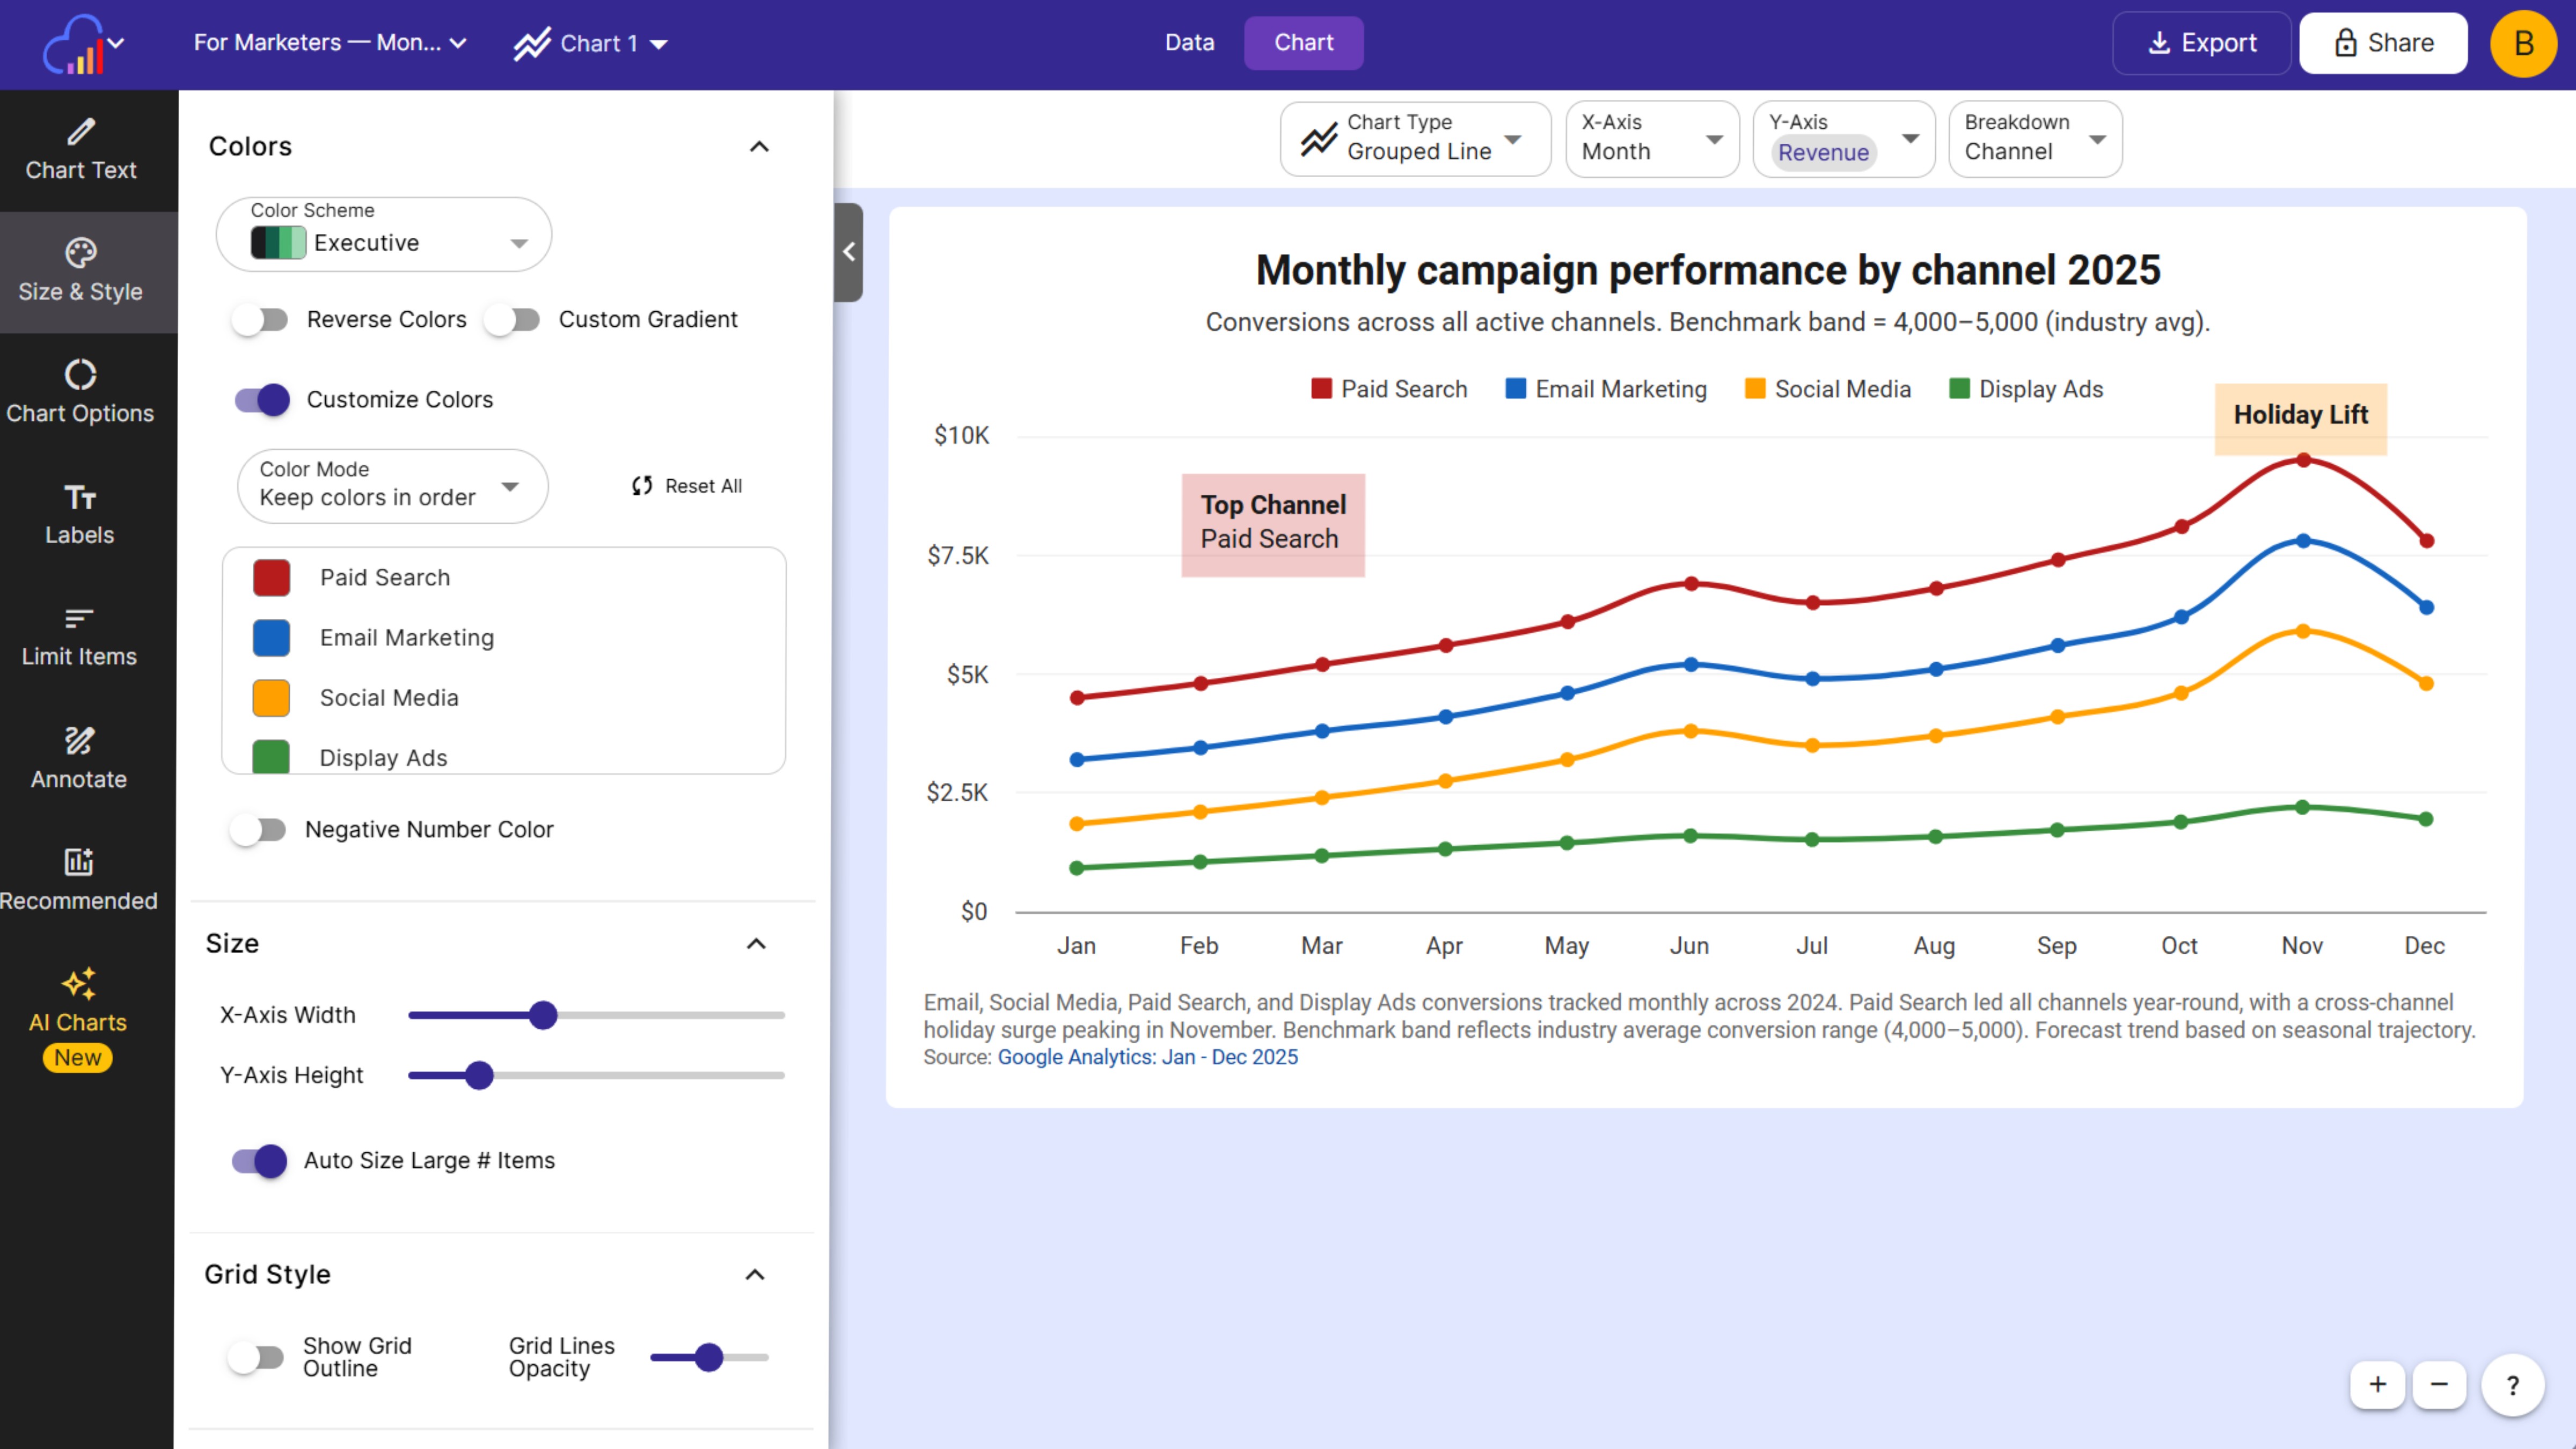
✦ AI-powered chart maker
Trusted by companies around the world


How it works
Share & embed them online - or export for offline embedding
✦ AI Charts
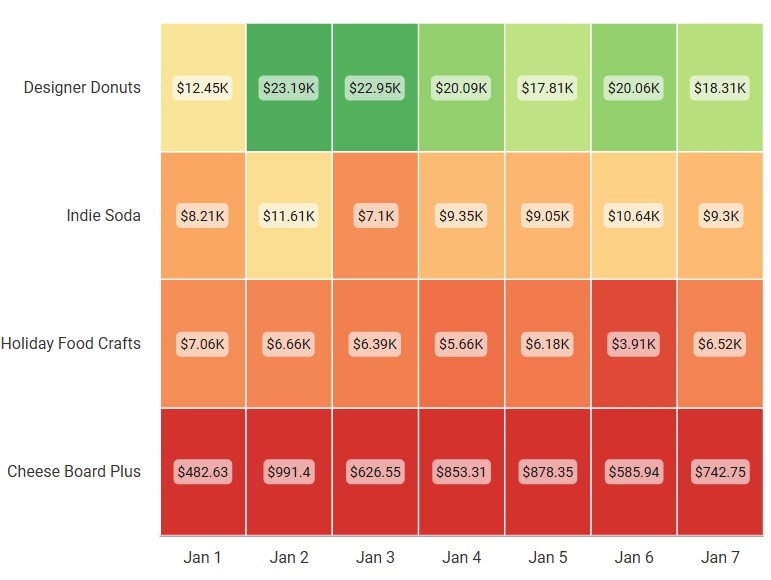
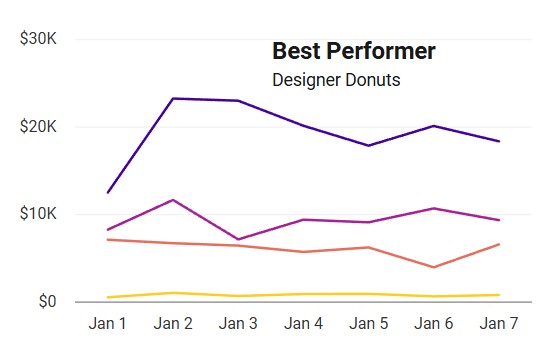
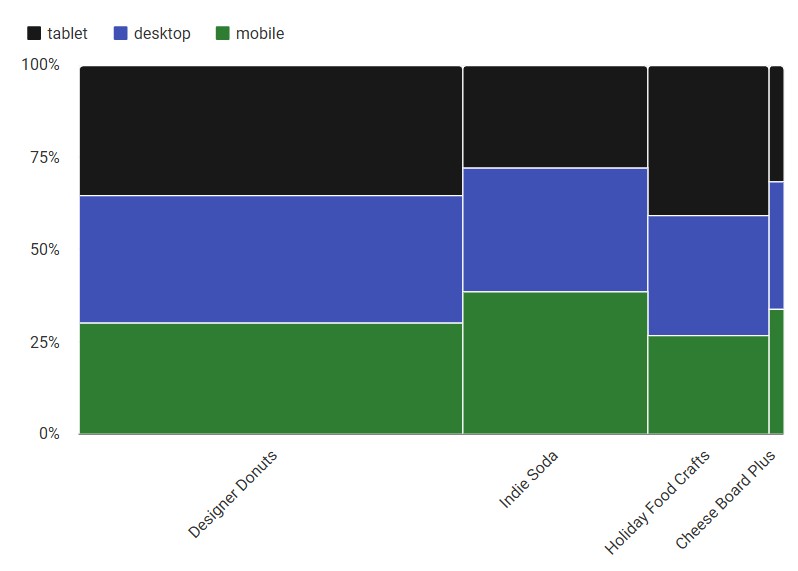
AI analyzes your spreadsheet and generates 3 ready-to-use charts in seconds
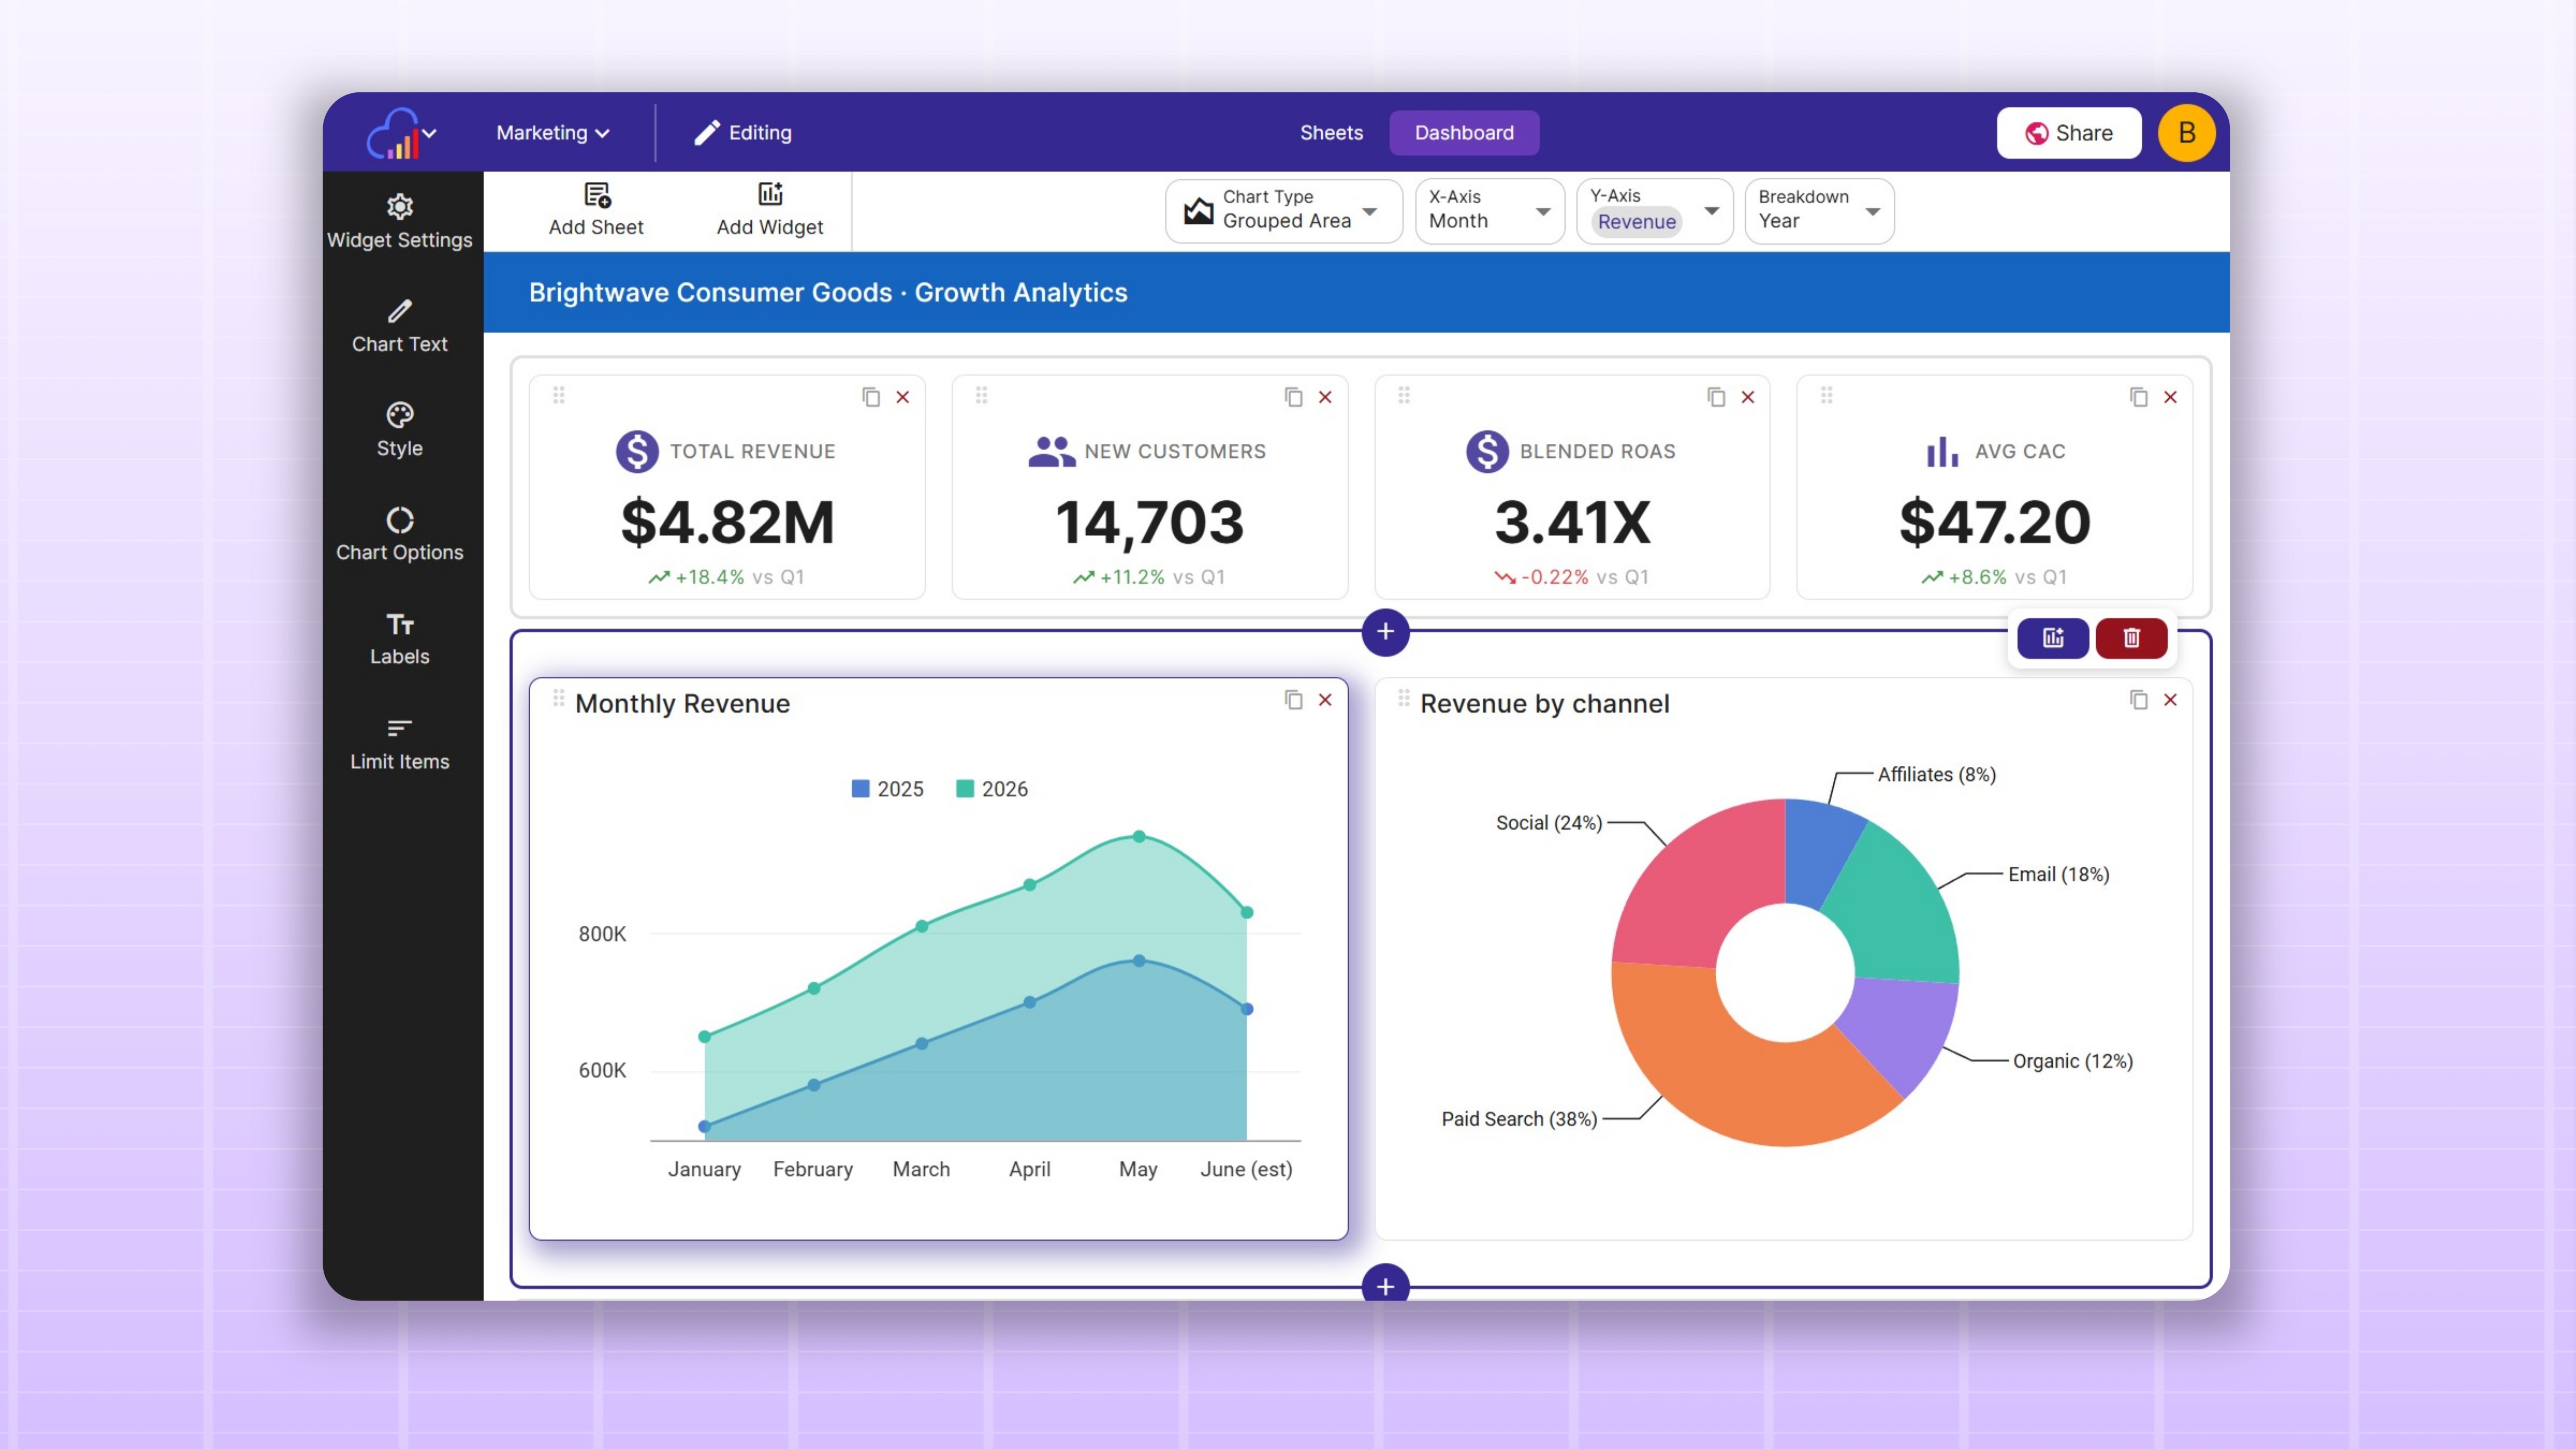
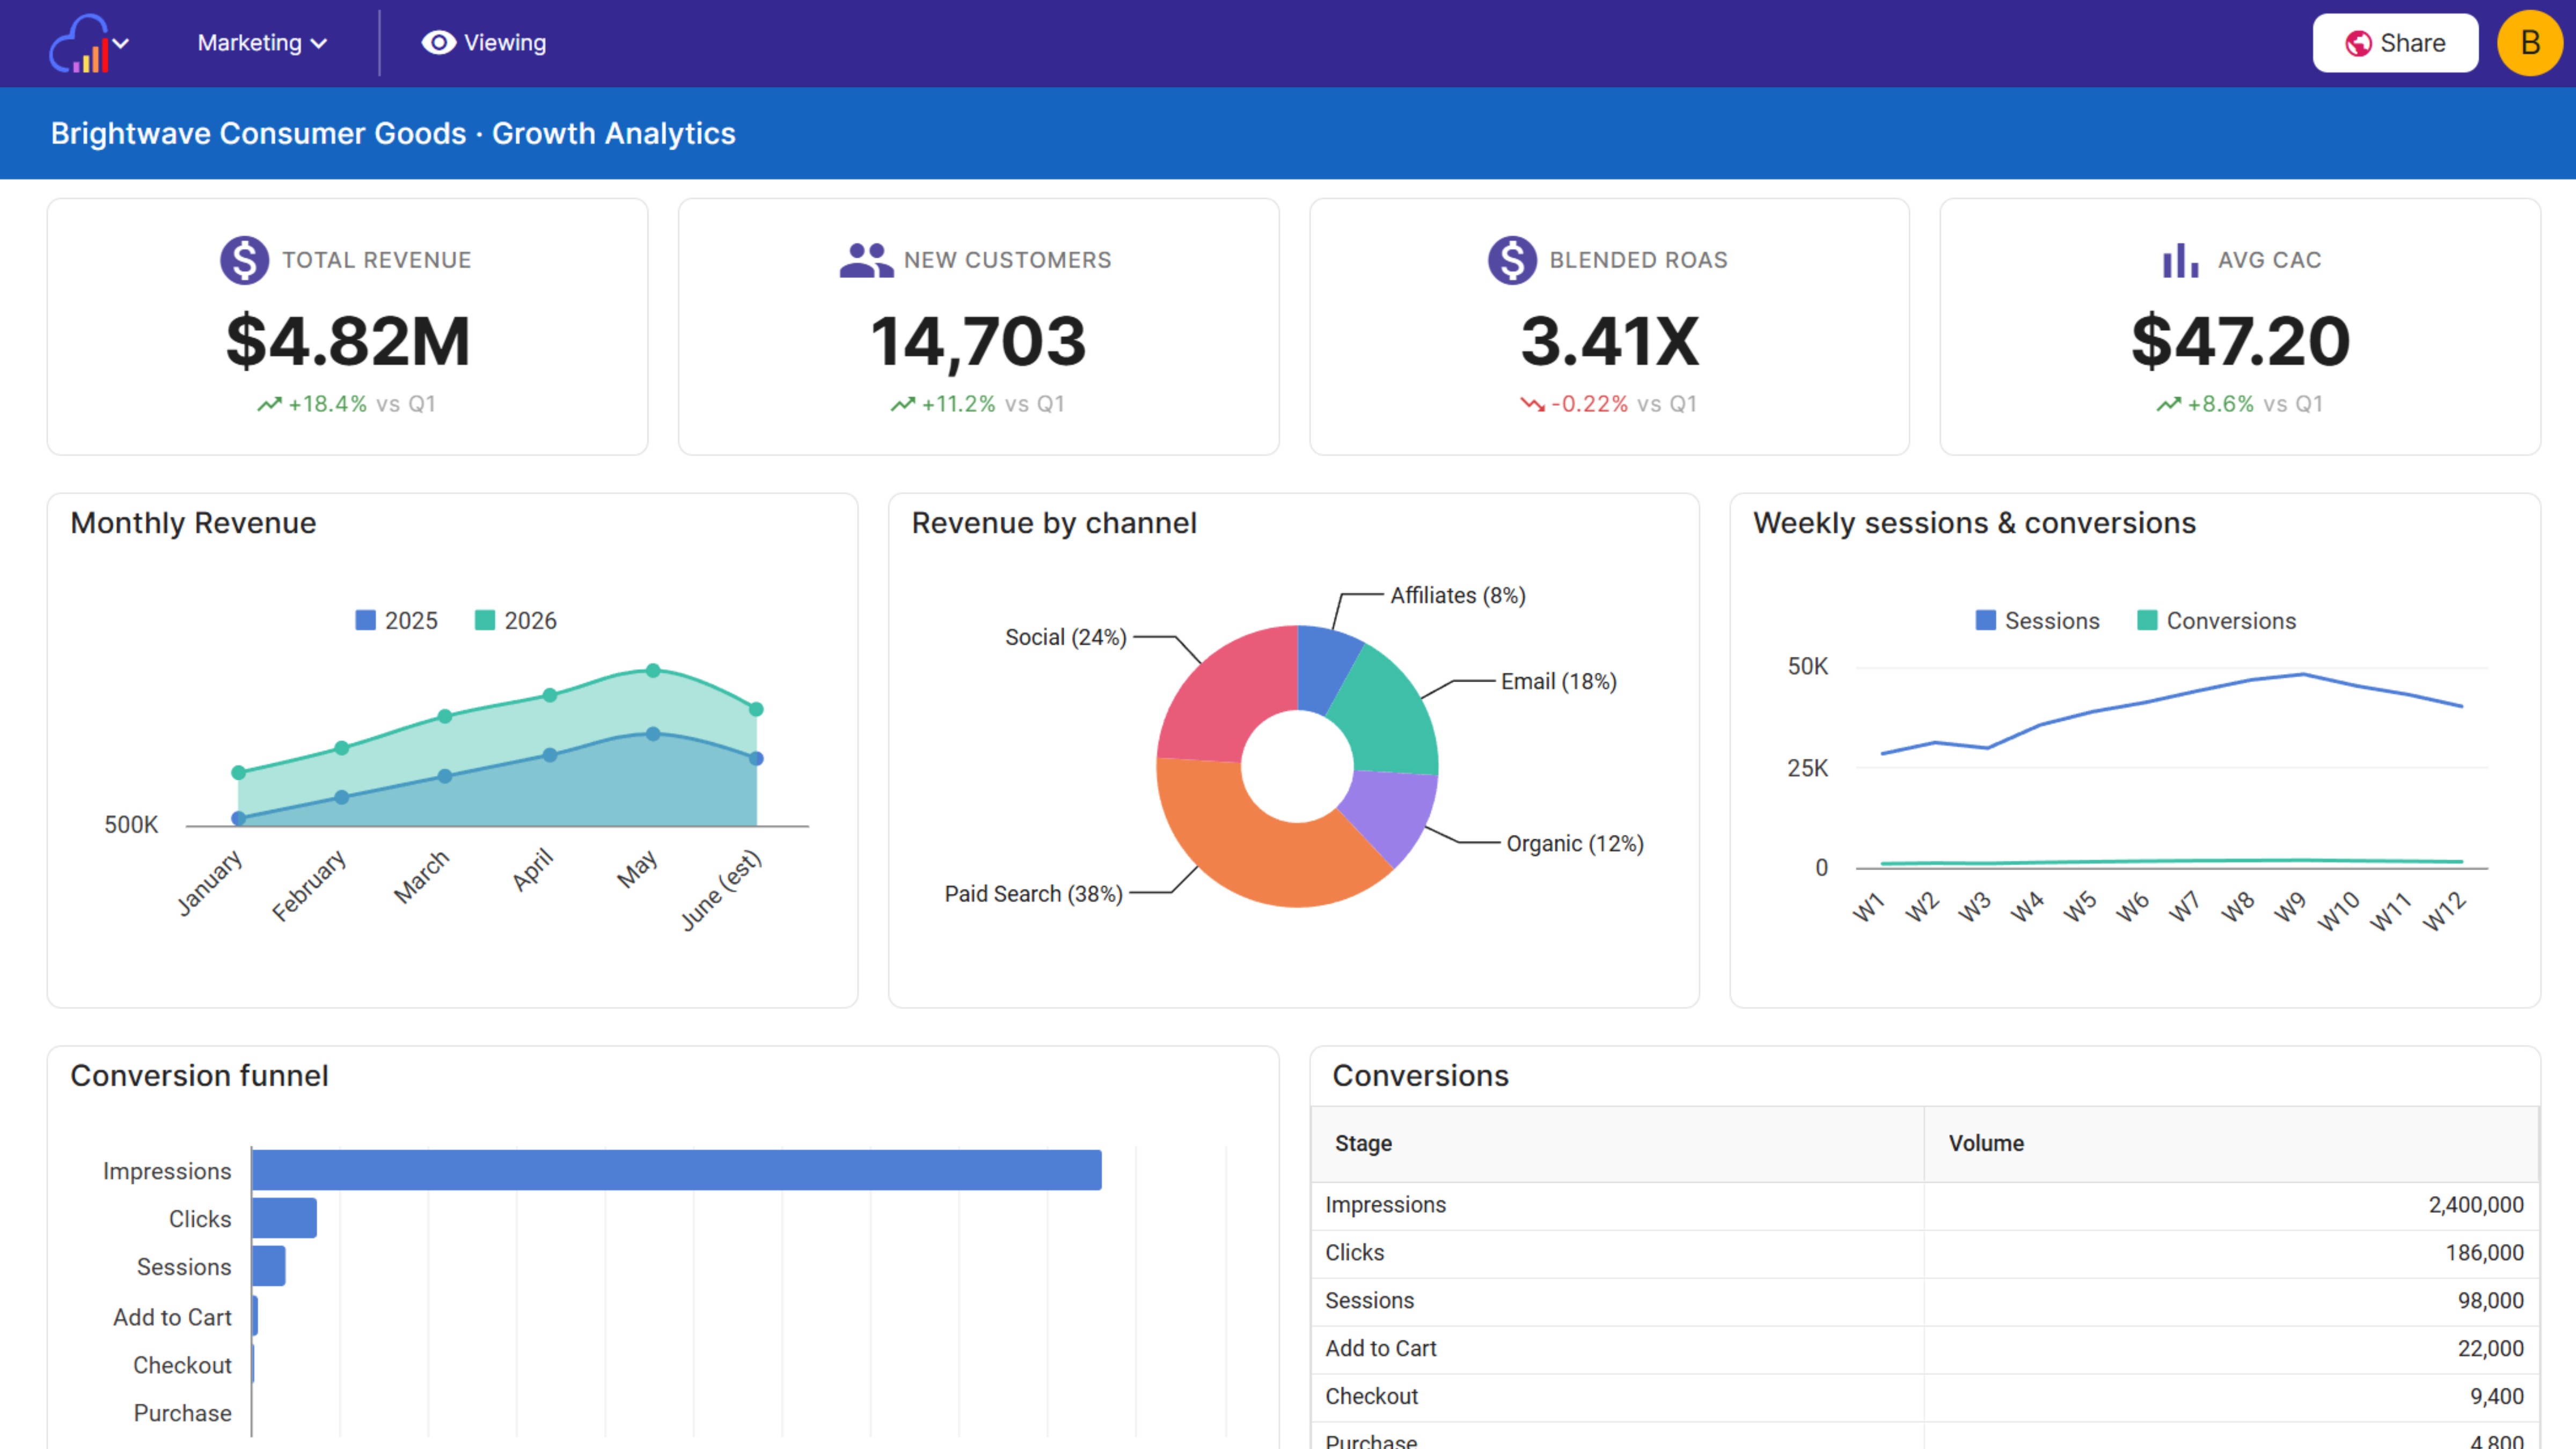
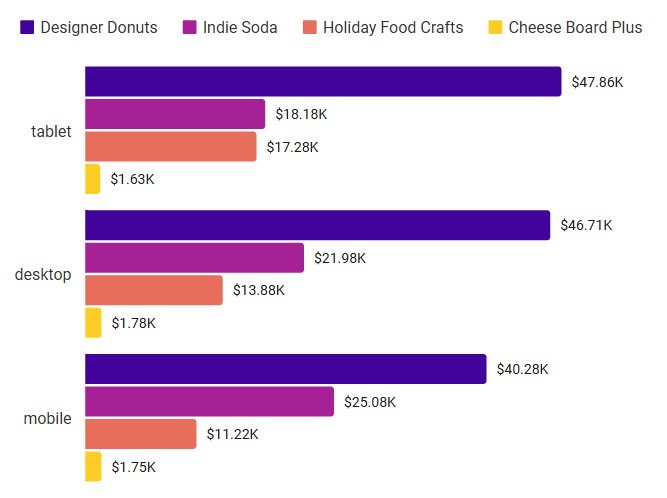
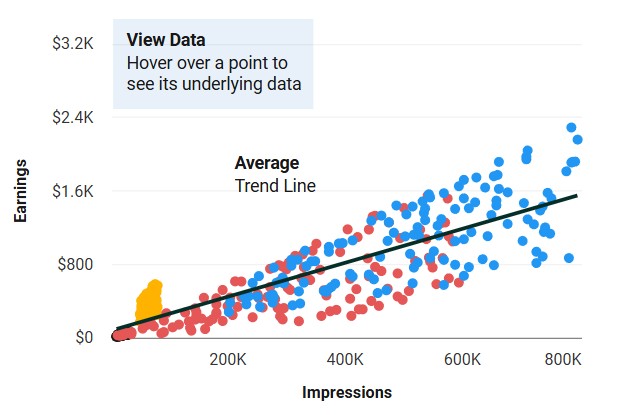
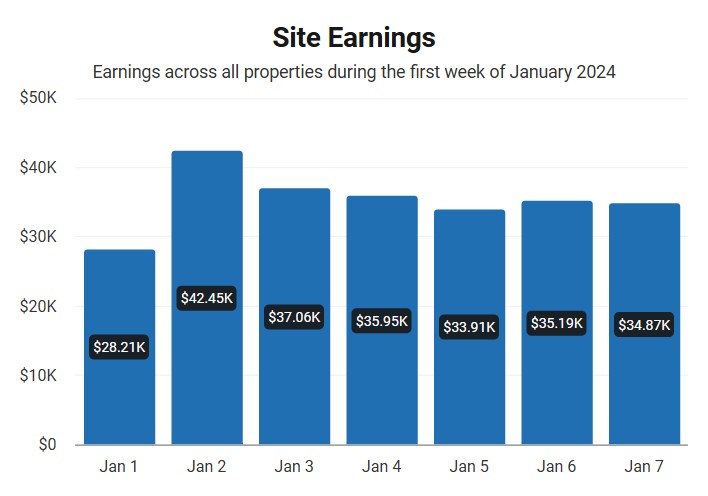
Dashboards
Combine charts, data tables, KPI and text widgets into one live dashboard
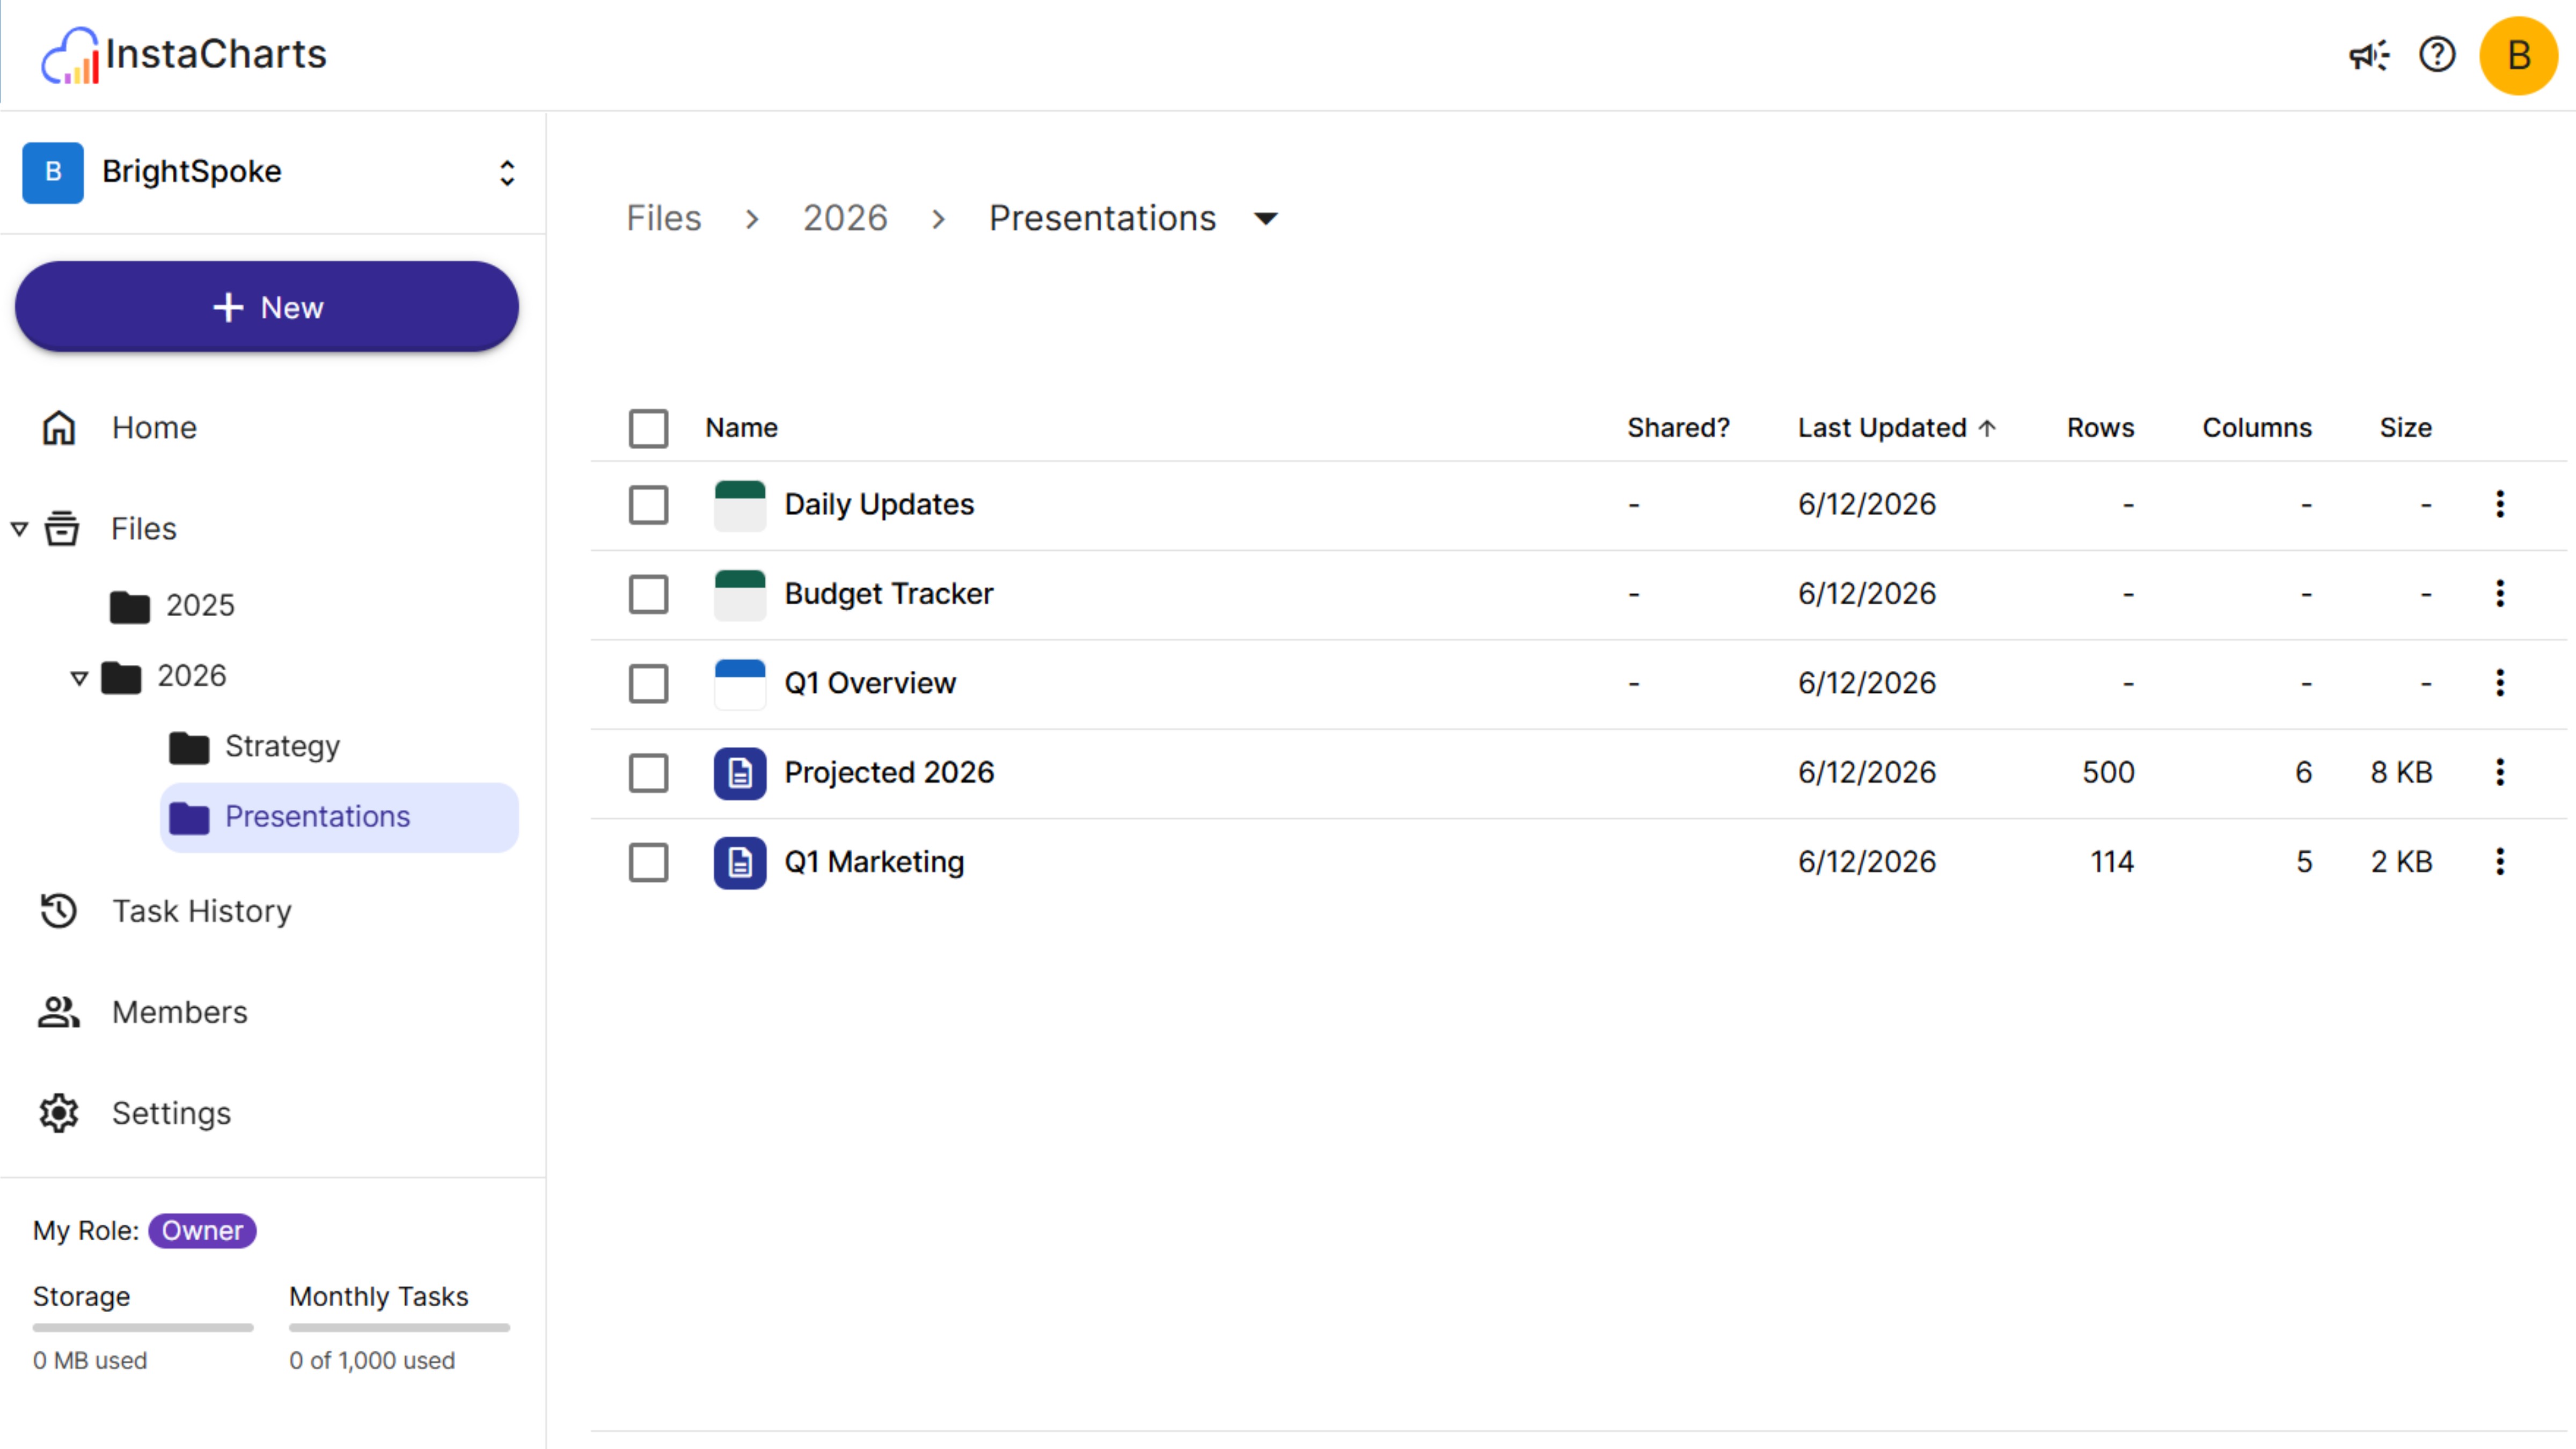
Upload a spreadsheet and AI instantly builds 3 charts tailored to your data. No setup, no chart-picking.
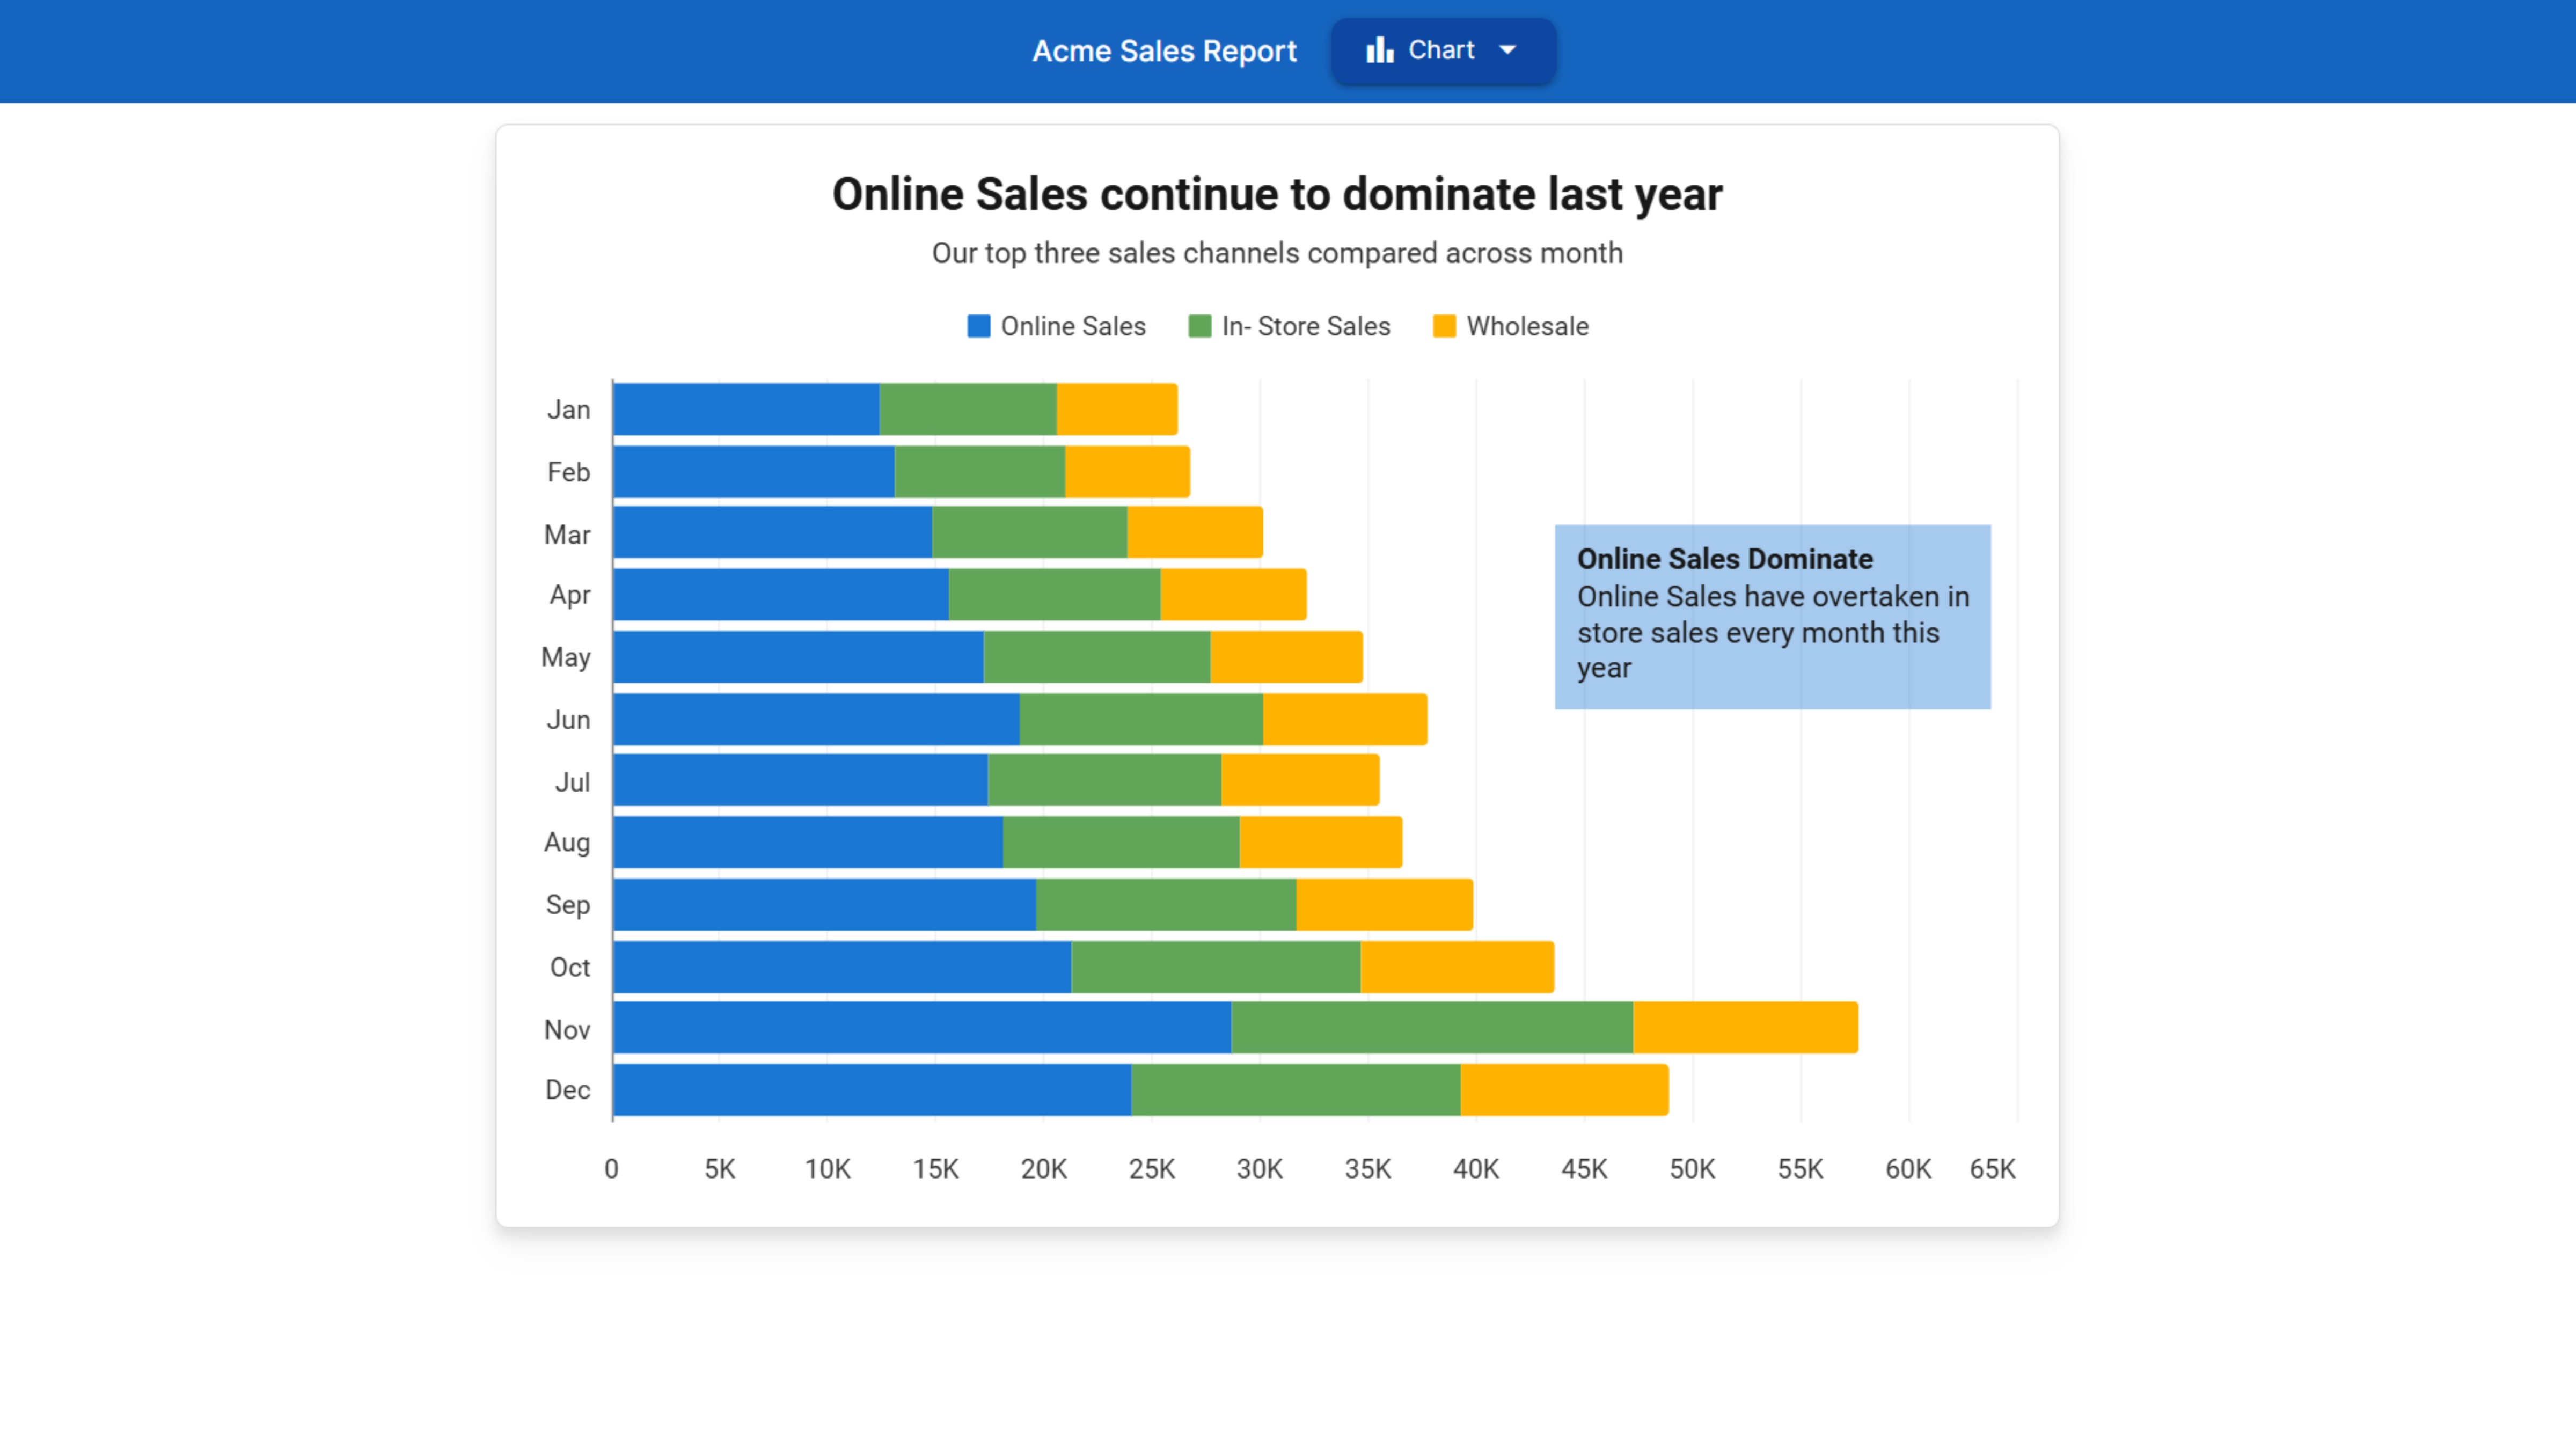
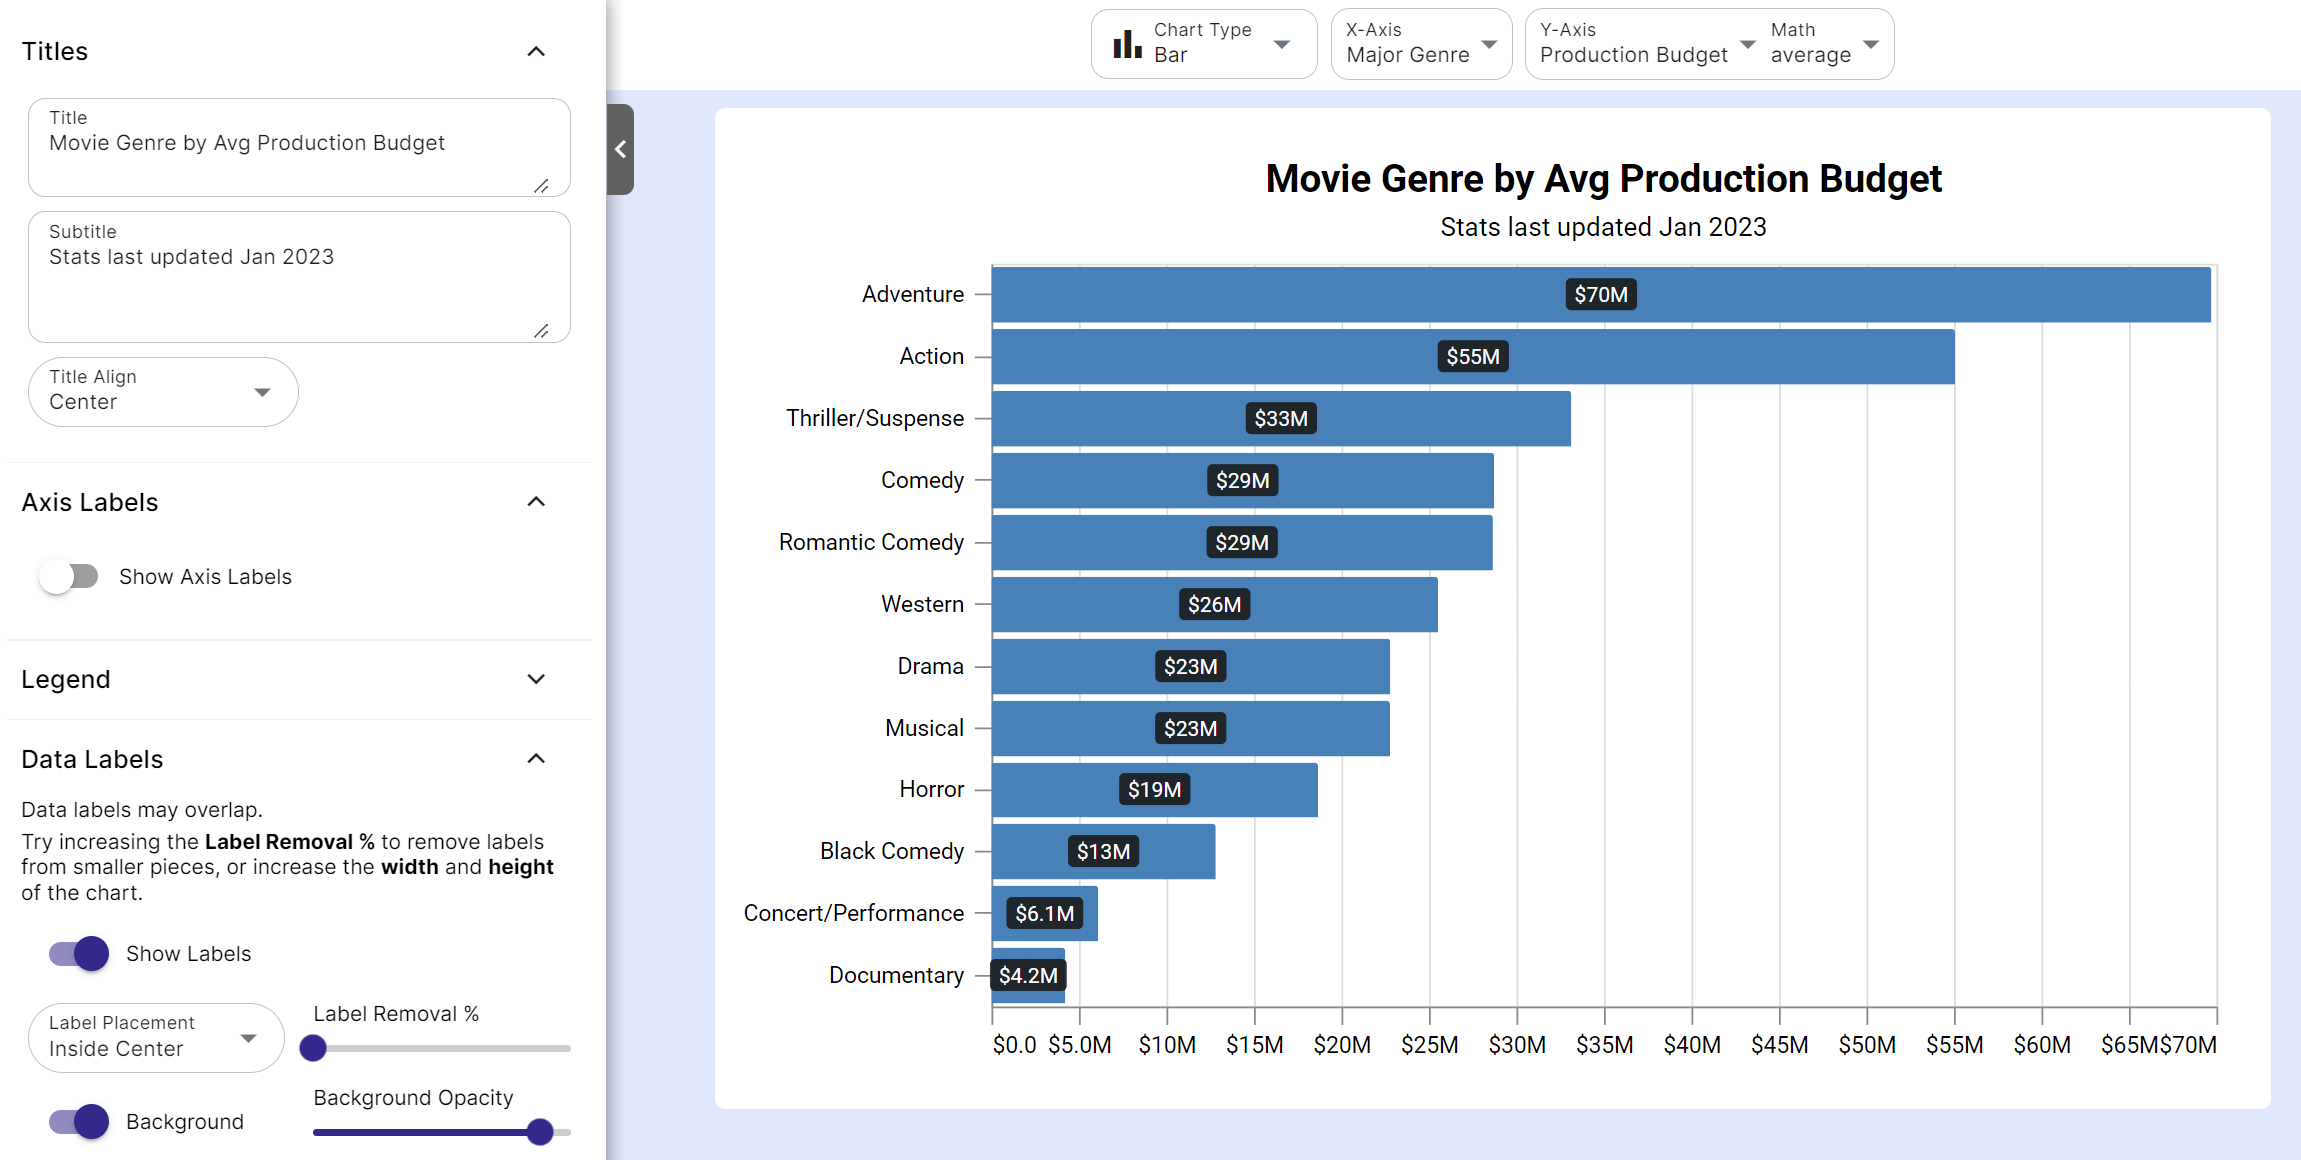
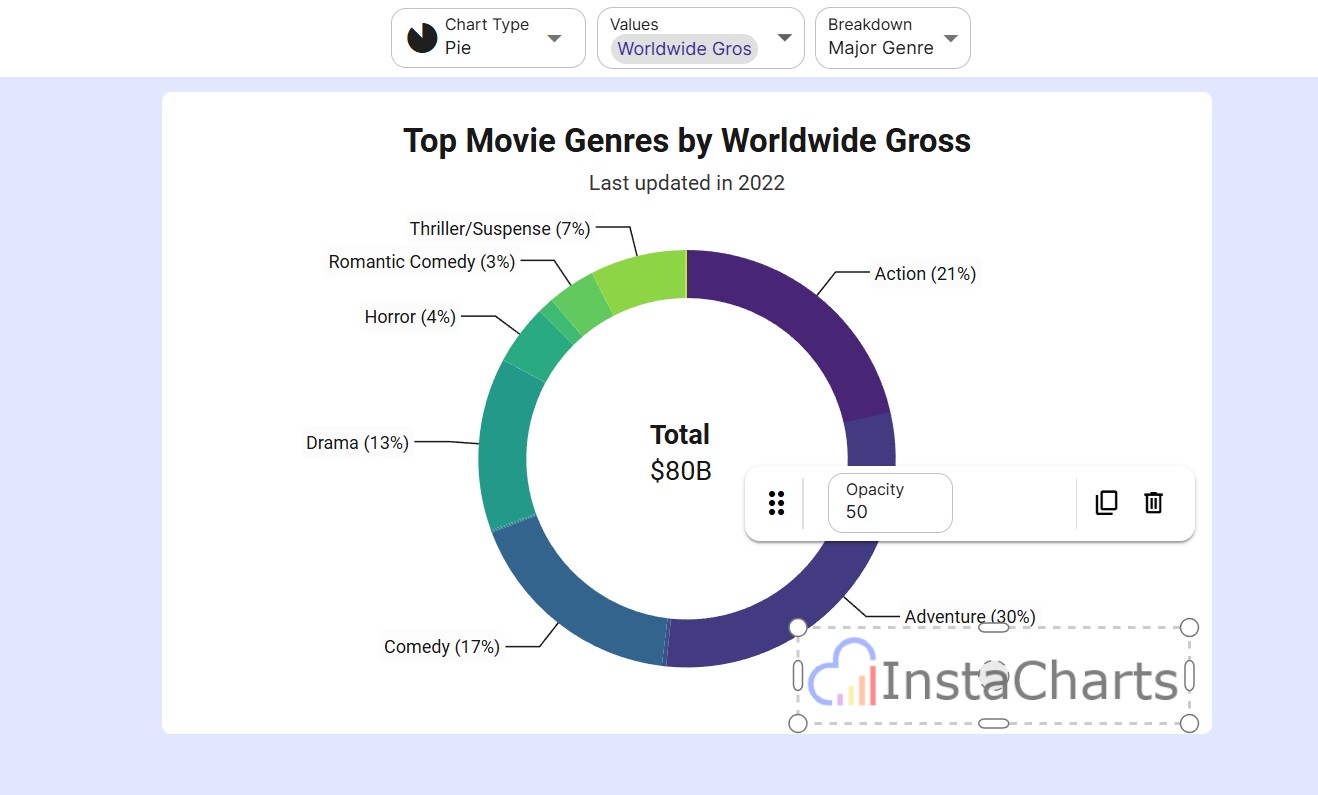
Customize every aspect: colors, text, labels, and annotations. Match your brand identity perfectly with unlimited design options.
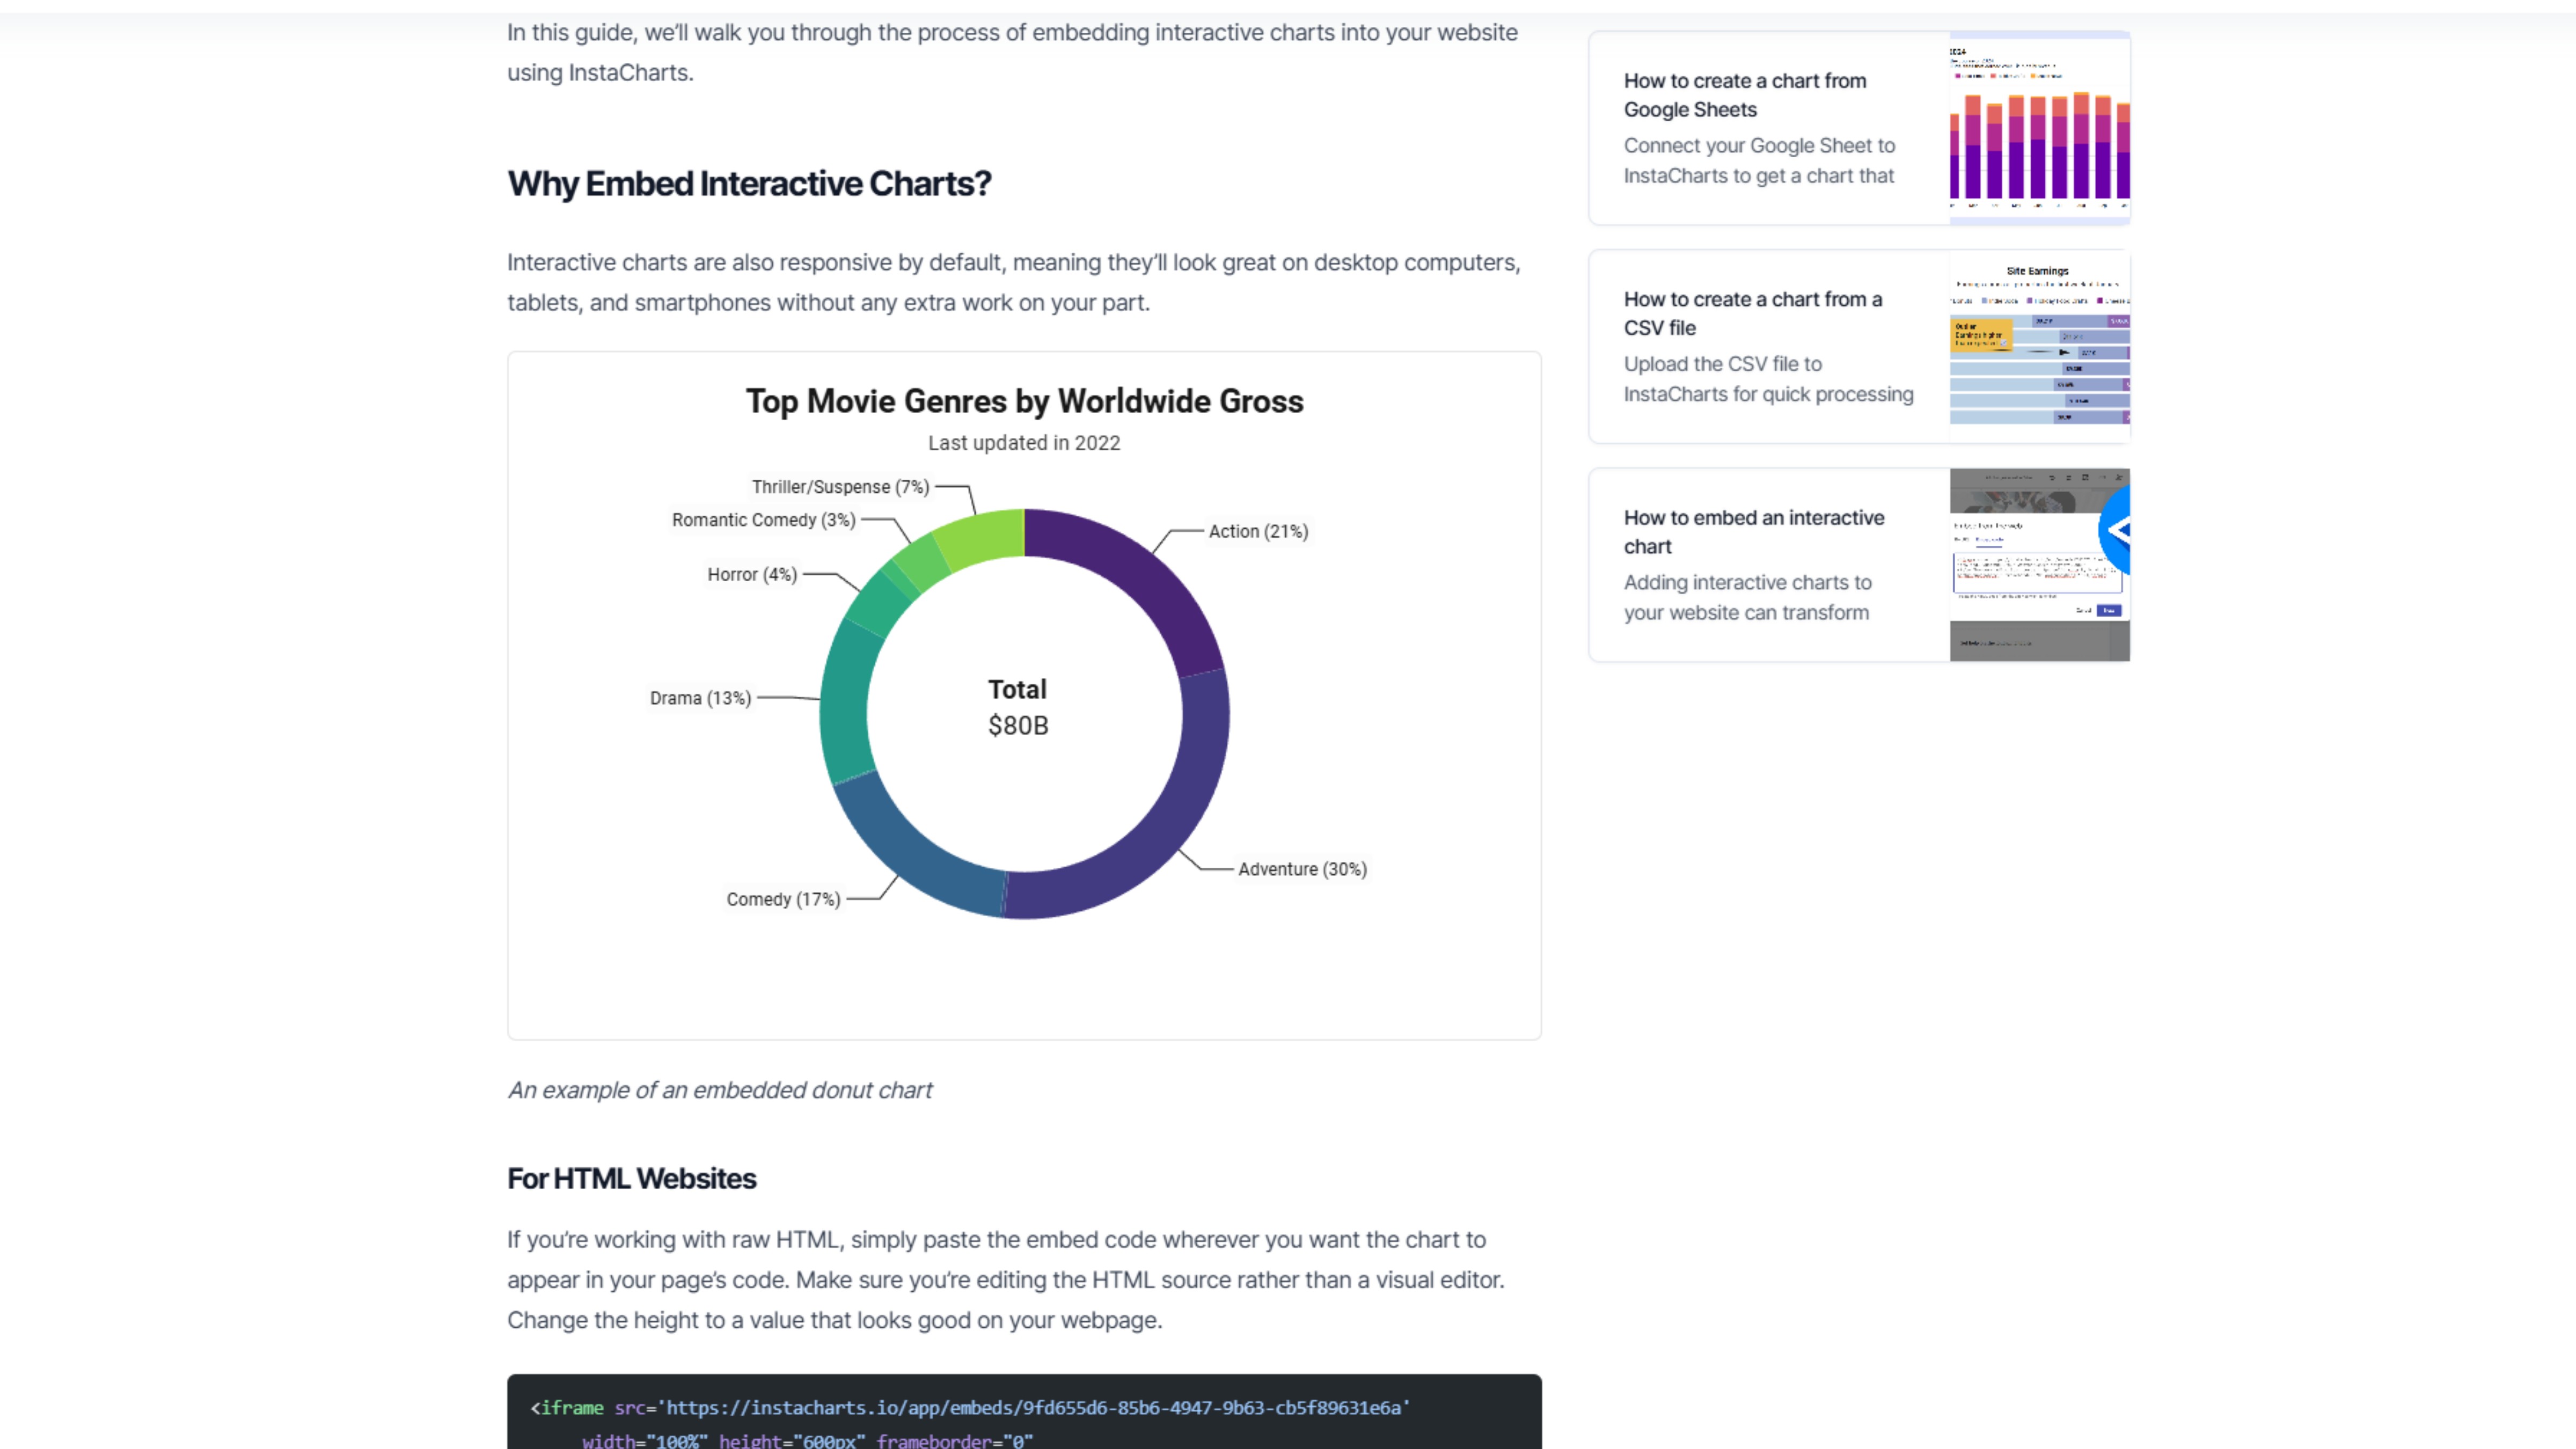
Download as PNG, SVG, PDF, or embed interactive charts. Share in presentations, reports, or integrate into websites seamlessly.
Integrations
Connect the tools you already use every day, and let InstaCharts AI turn the data flowing in into ready-to-use charts
Access all your spreadsheets and data files stored in Google Drive. Sync automatically and keep your charts up to date.
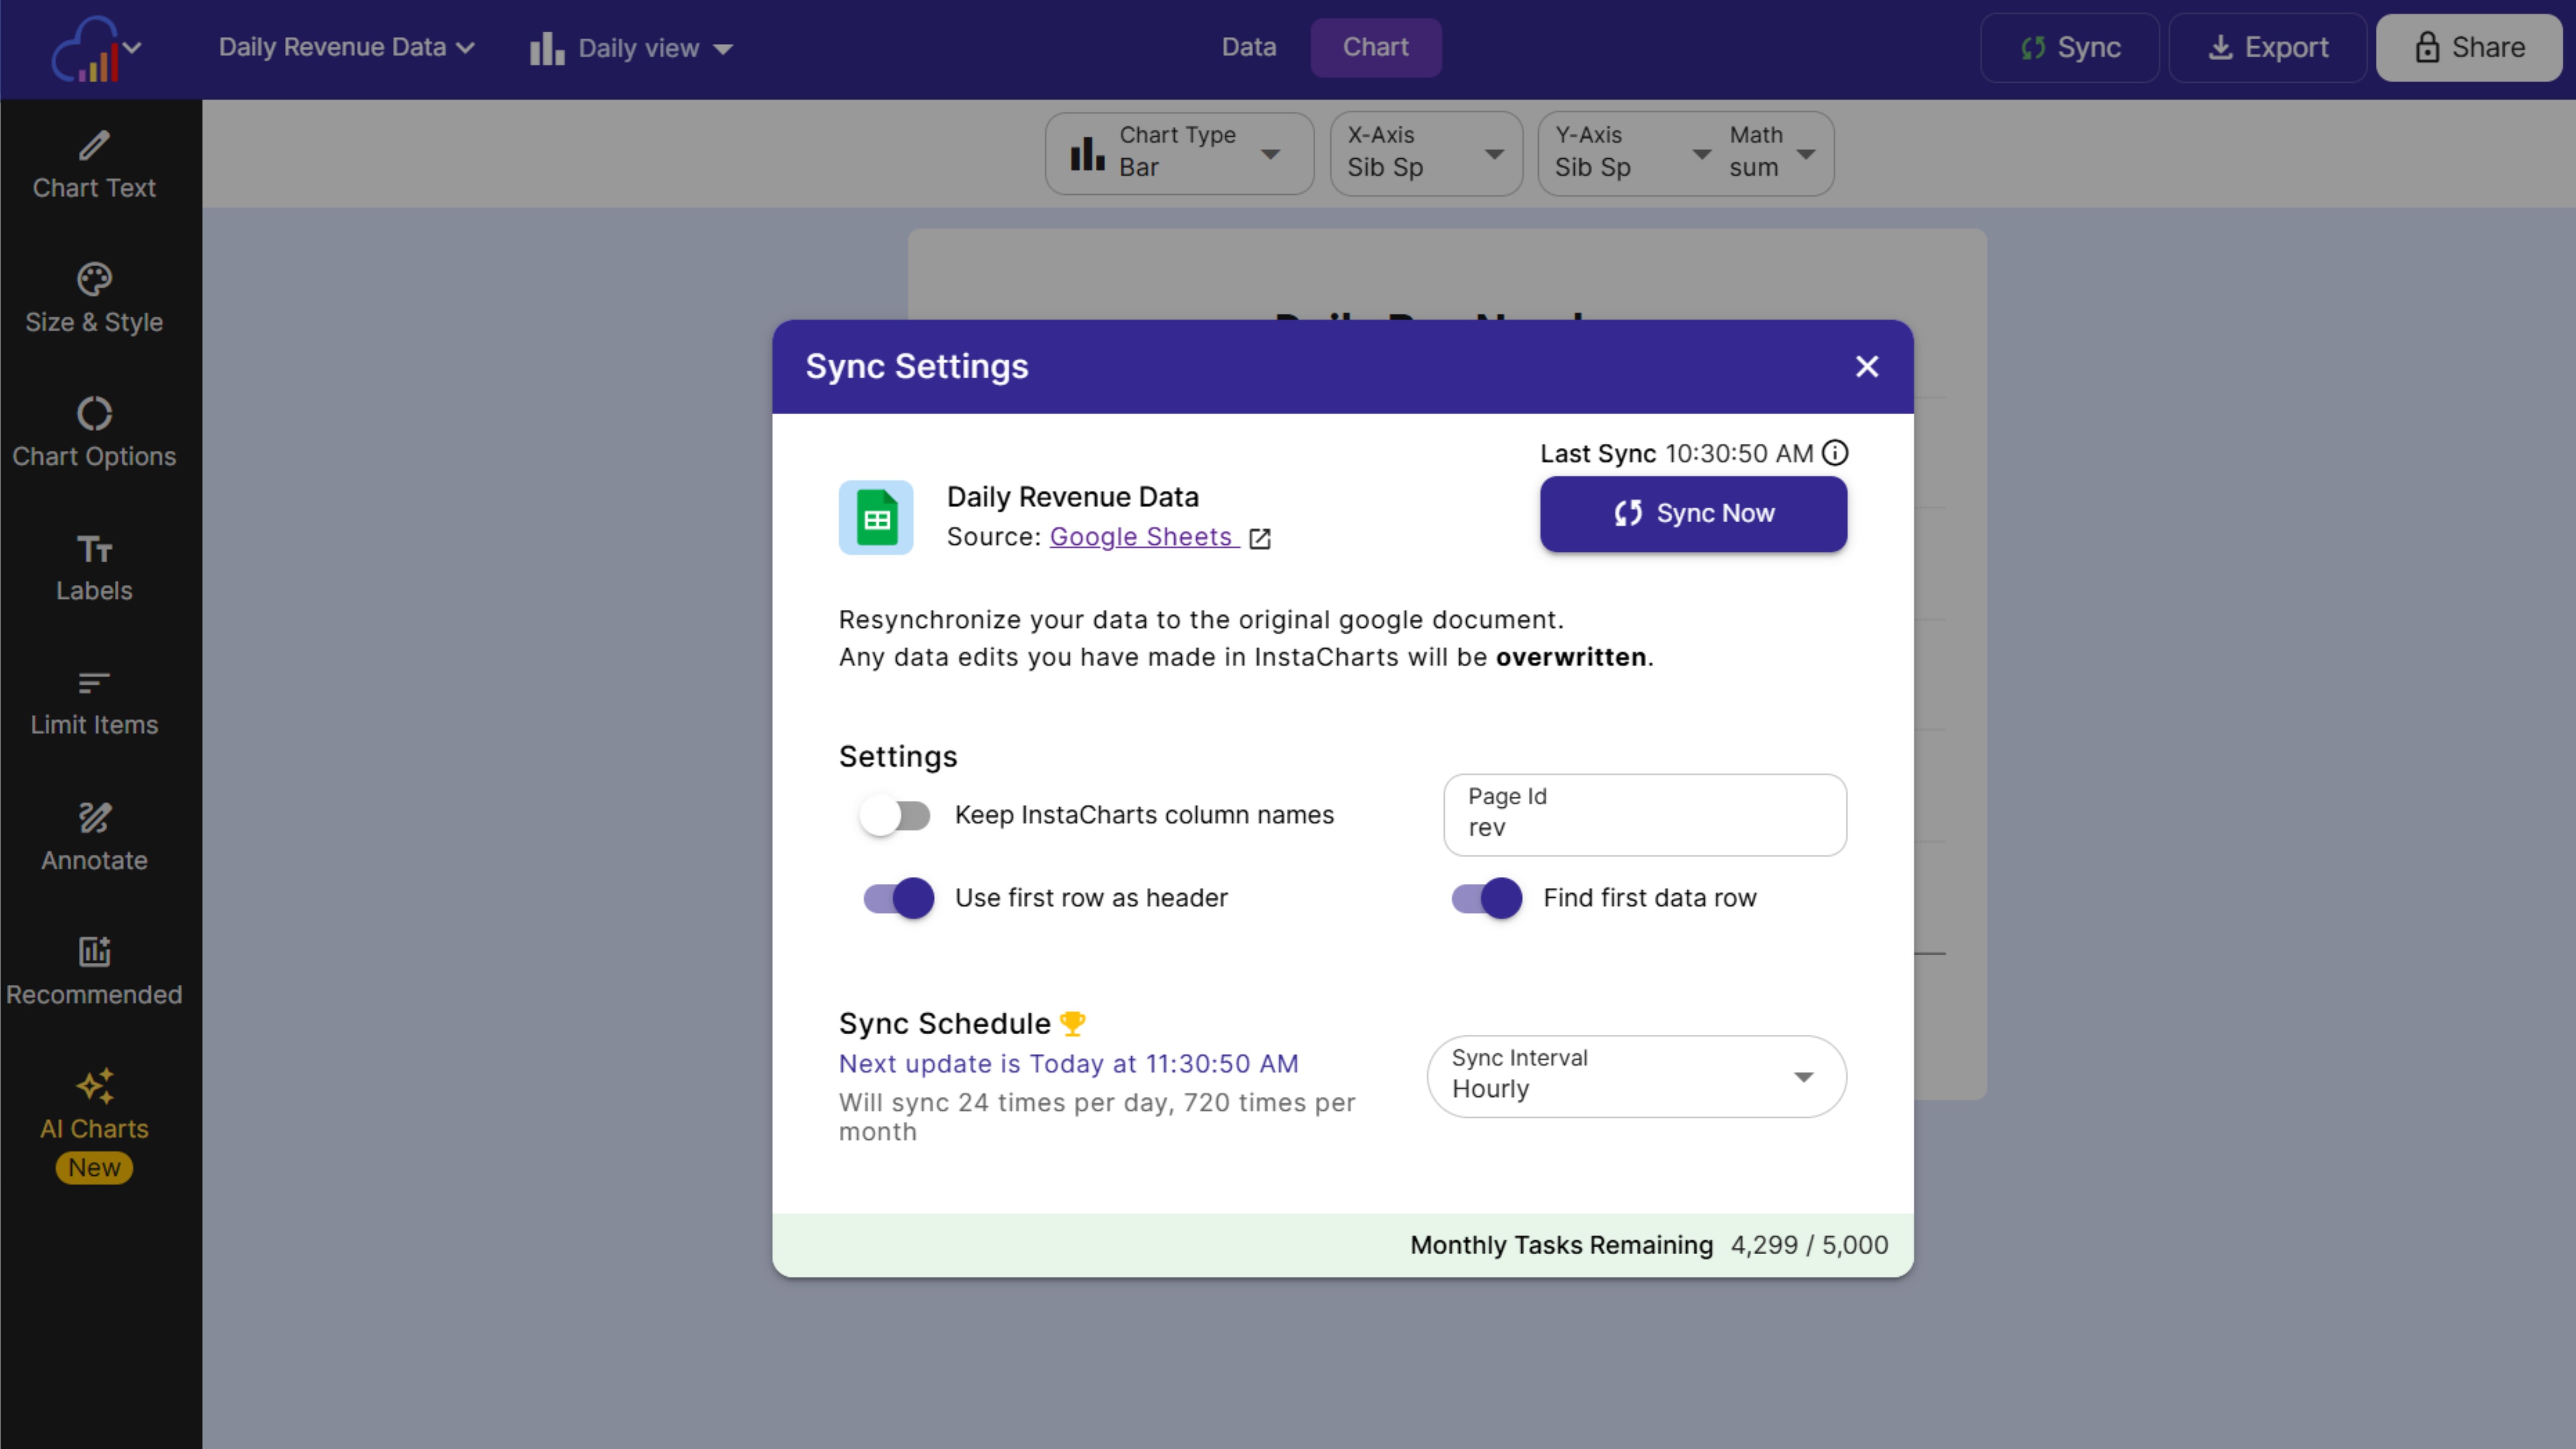
Live connection to Google Sheets. Changes in your spreadsheet automatically update your charts in real-time.
Connect InstaCharts with 5,000+ apps through Zapier. Automate your workflow and create charts from any data source.
Gallery
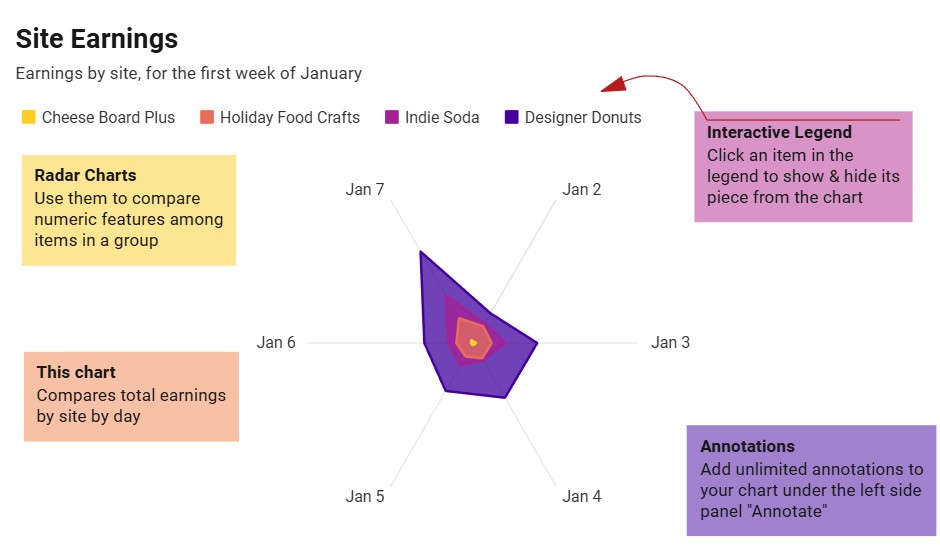
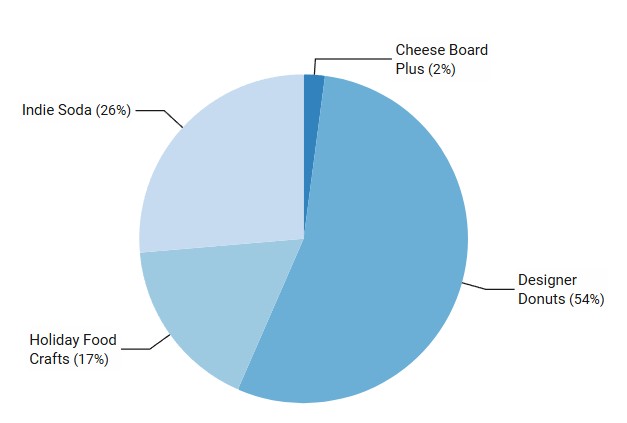
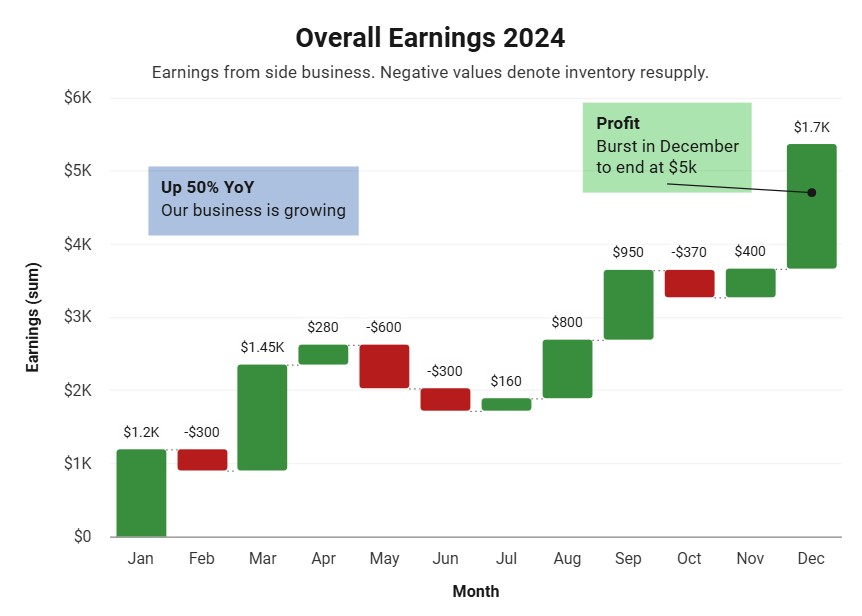
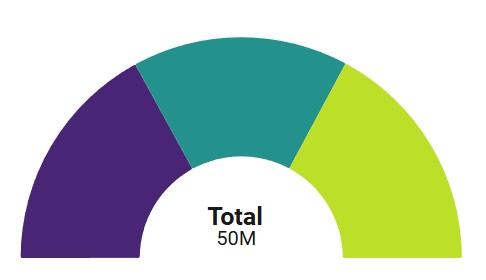
Change themes and colors. Add text annotations, trend lines & data labels. There are many different chart types to choose from.
Datasources
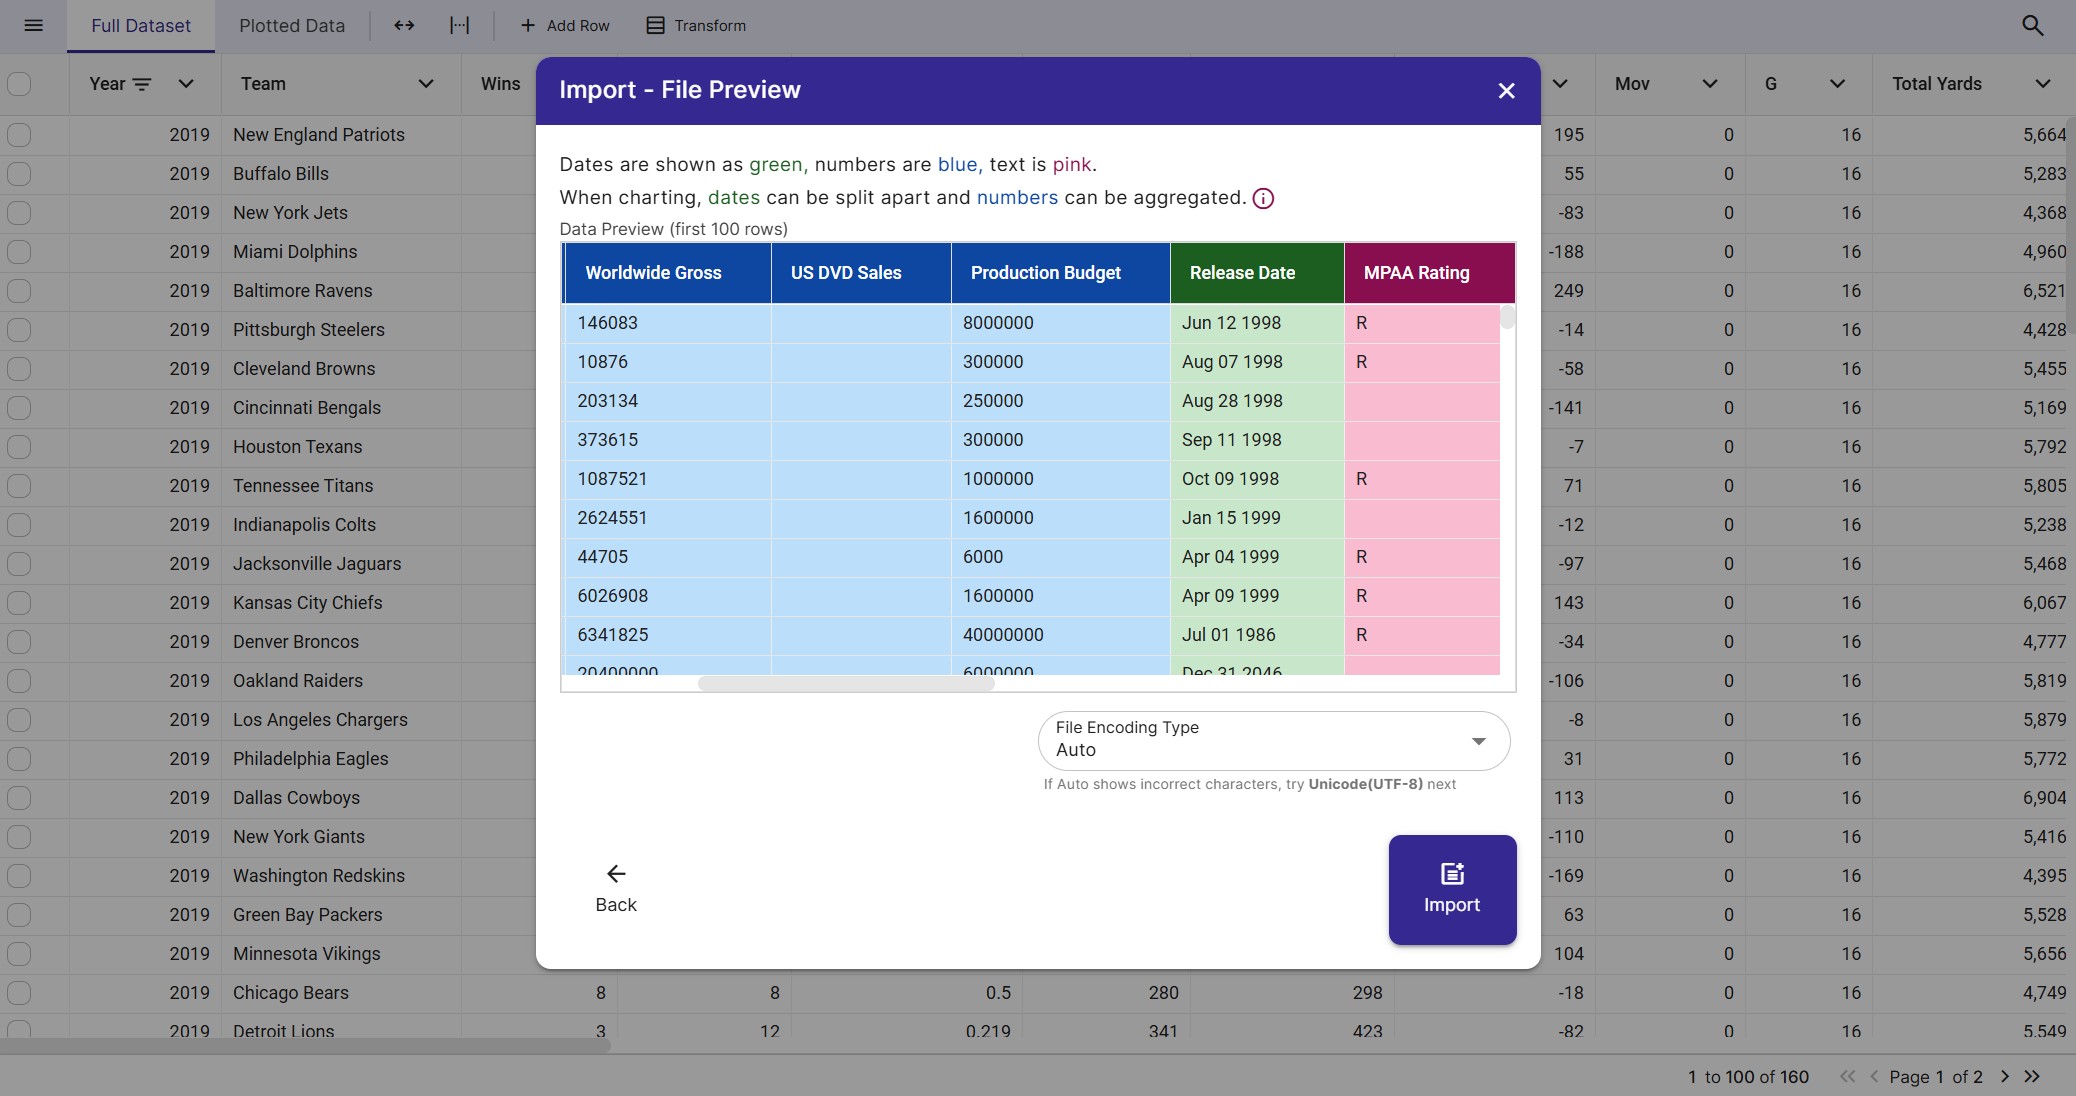
Seamlessly connect your data from many different file formats
Import .xlsx and .xls spreadsheets directly. Supports multiple sheets and complex formulas.
Upload comma-separated and tab-separated value files. Perfect for exporting from databases.
Import structured JSON files from APIs and databases. Nested data structures supported.
Live connection to Google Sheets. Sync automatically and keep charts updated in real-time.
Connect directly to Google Drive. Access all your spreadsheets and data files in one place.
Type data directly or copy-paste from anywhere. Built-in spreadsheet editor for quick edits.
Supported Formats: Excel (.xlsx, .xls), CSV, TSV, JSON, Google Sheets, Google Drive, Manual Entry
Don't just take our word for it. See what our users have to say about InstaCharts.
Read tips on making effective and informative charts. Learn InstaCharts tips and tricks to explore your data faster.
Create a dashboard, add your sheets, then build it out with chart, data table, K...

Evaluating the top online chart makers in 2026, detailing their features, pros a...

InstaCharts is a free, no-code chart maker built for speed. Tableau is a powerfu...
Learn how to add professional watermarks to your charts using InstaCharts' power...
FAQs
InstaCharts is an online chart and dashboard maker that automatically creates charts from spreadsheet files. Combine charts, data tables, KPI and text widgets into live dashboards. Charts, data tables and dashboards can be shared with others through public links. Chart images can be exported for embedding in reports.
Yes. Upload a spreadsheet and InstaCharts' AI automatically generates 3 charts based on your data and column types, with no chart-picking or setup required. You stay in full control and can edit the chart type, axes, colors, and text at any time.
When you upload a new sheet, InstaCharts' AI analyzes your columns and data types, then recommends the 3 best charts for your data in seconds. Each suggestion is a starting point you can refine, and you can ask for more recommendations from the sidebar at any time.
Yes. AI chart generation is optional. If you'd rather not send your data for AI processing, you can opt out and keep your data private, and InstaCharts still builds charts for you automatically without using AI.
Yes. InstaCharts includes a no-code dashboard builder. Combine charts from multiple sheets, data tables, KPI widgets and text widgets into a single dashboard. Dashboards stay in sync with your data, and can be kept private, shared publicly with a link, or shared automatically with your workspace members.
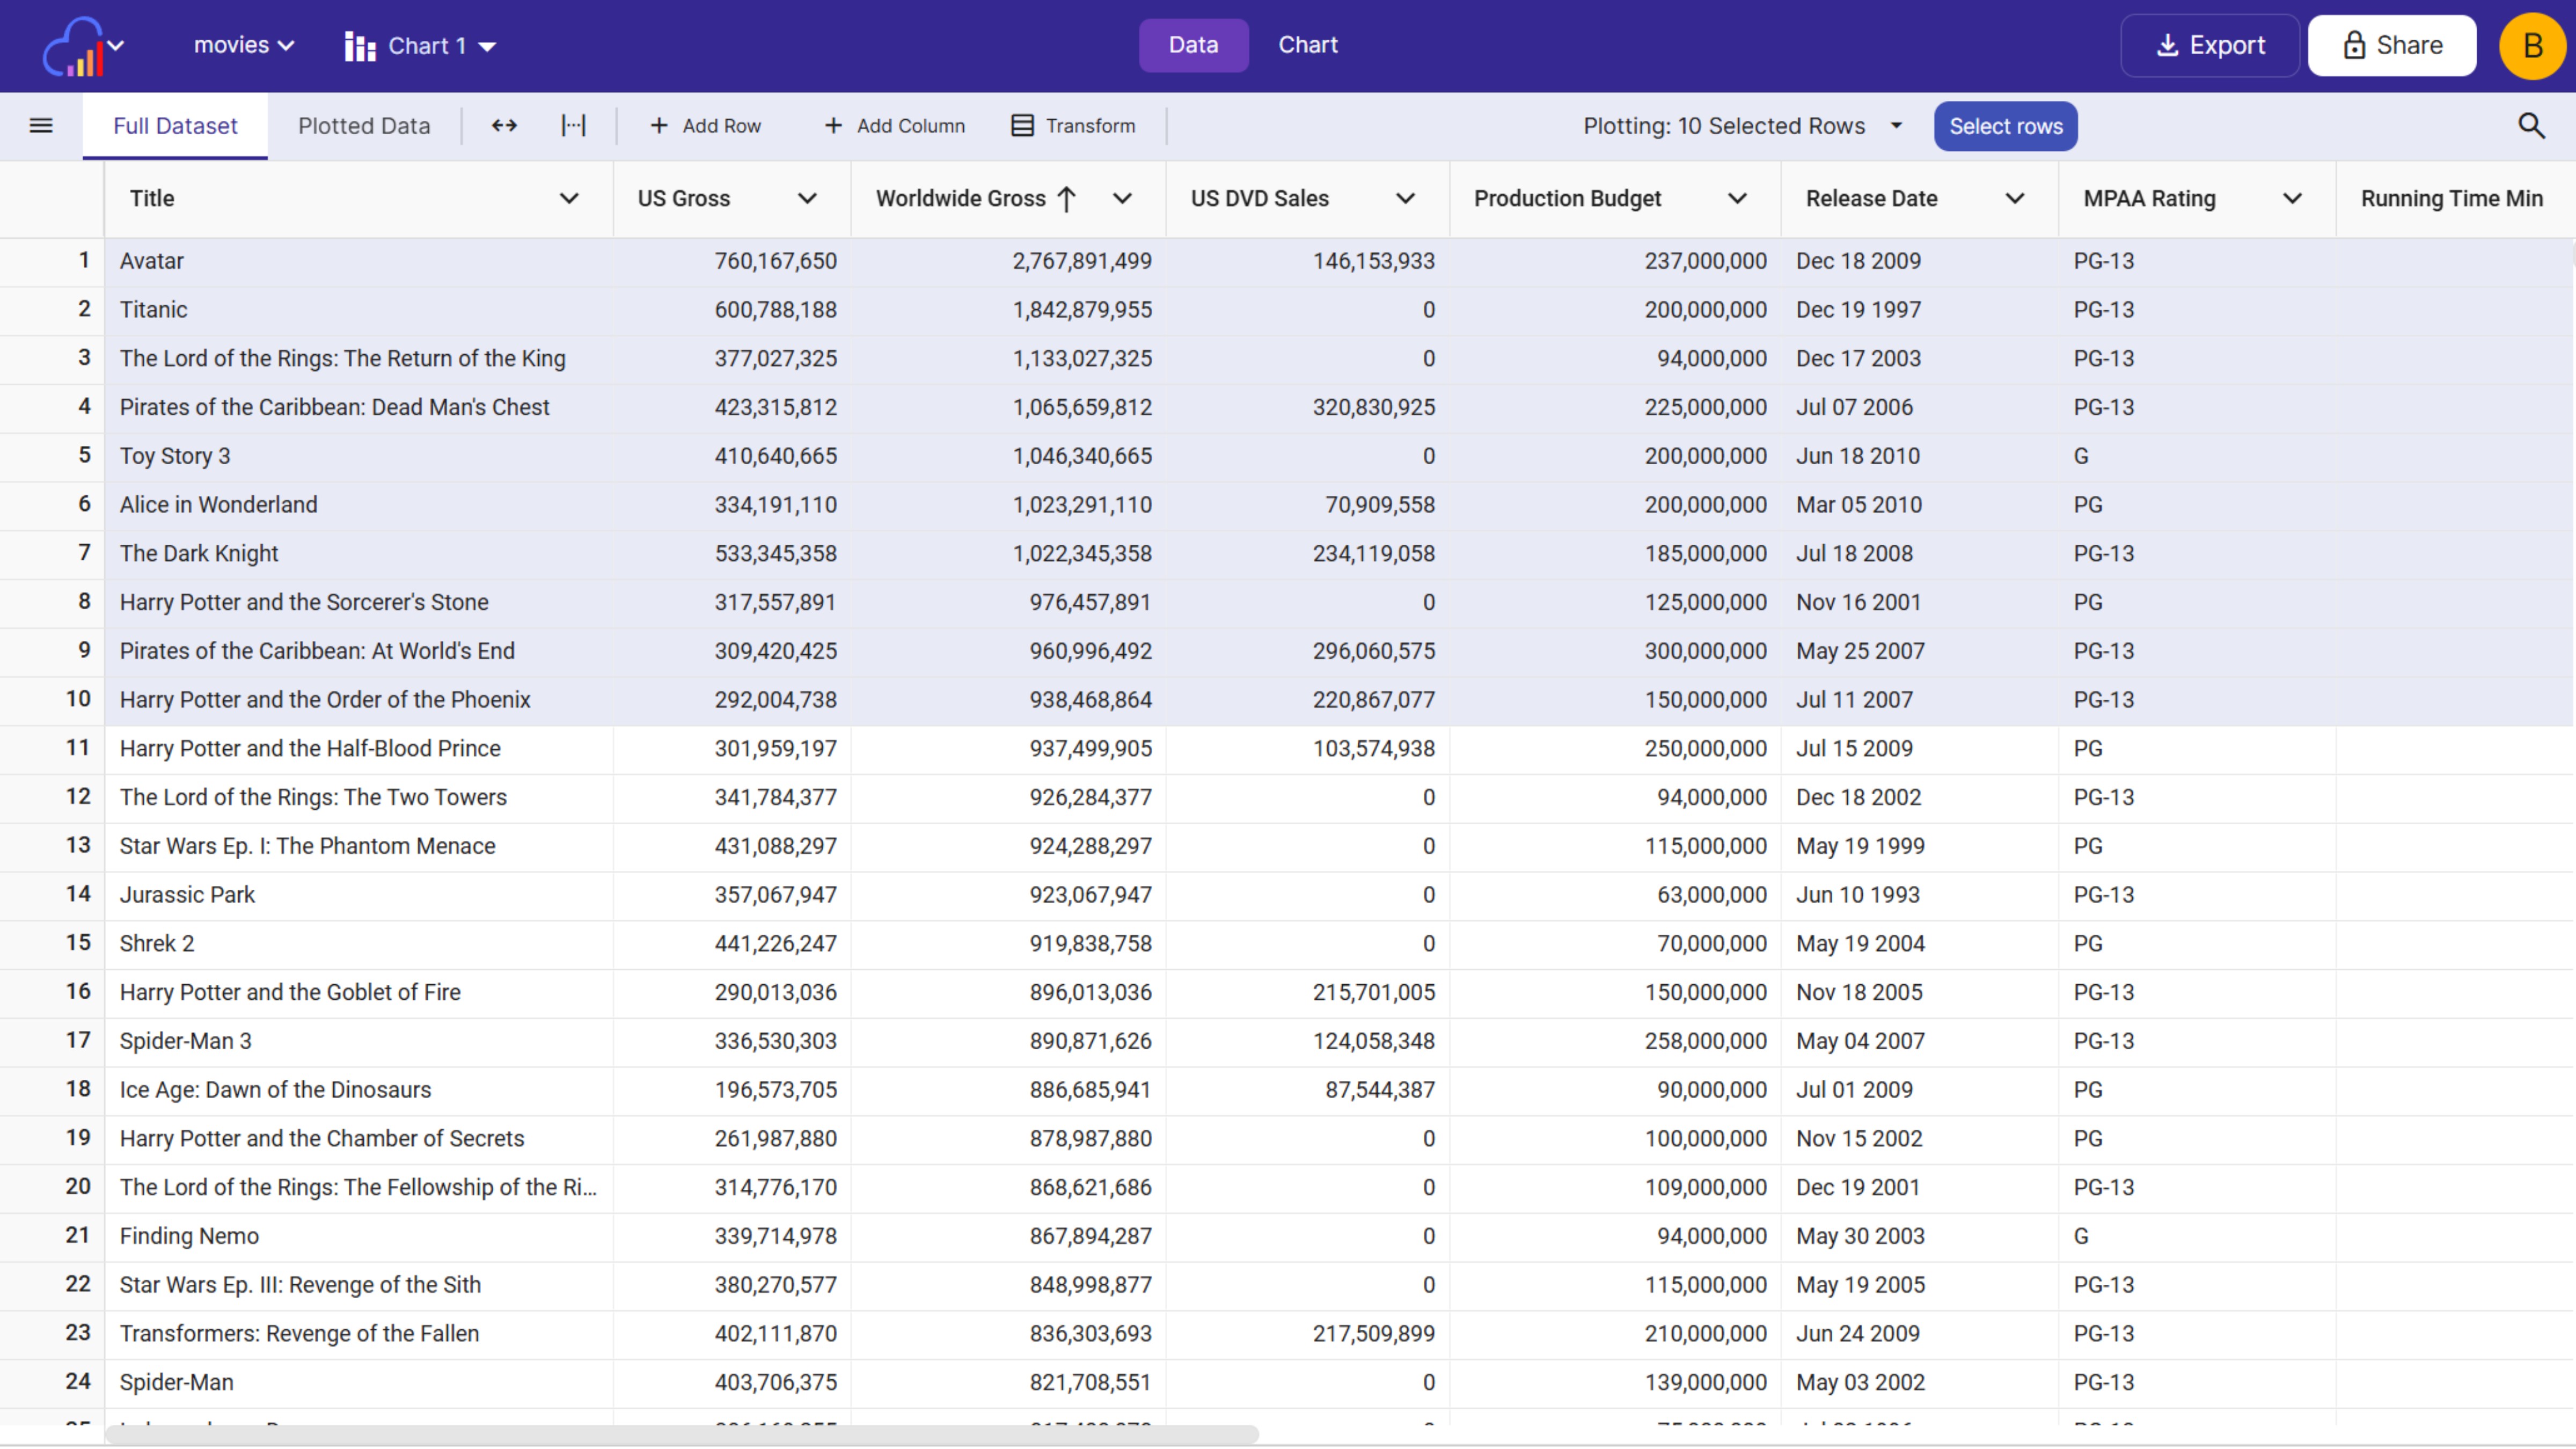
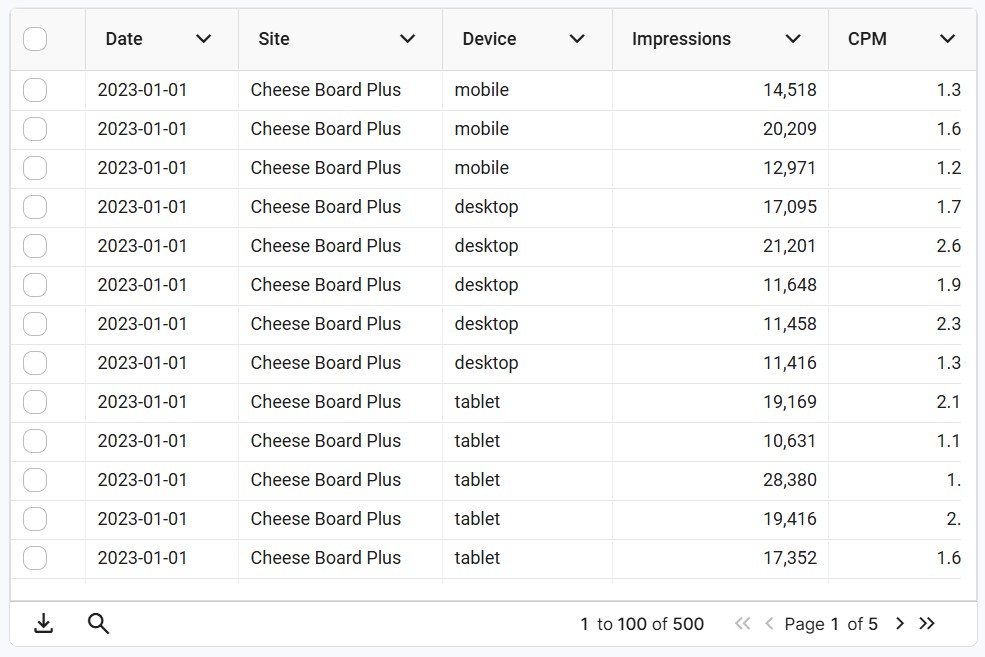
Dashboards support charts, sortable data tables, KPI widgets for key metrics, and text widgets for context and commentary. You can mix data from multiple sheets in one dashboard, so a single view can summarize several spreadsheets.
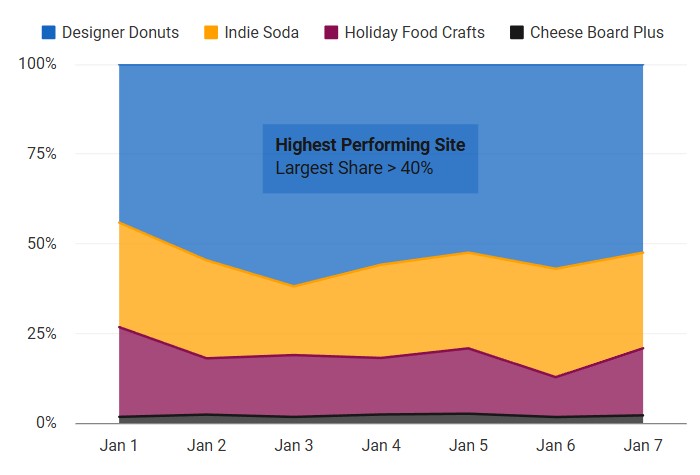
There are 13 chart types available, including a filterable and sortable data table. You can create a line chart, grouped line chart, bar chart, stacked bar chart, area chart, stacked area chart, scatterplot chart, grouped scatterplot chart, pie chart, radar chart, heatmap and a mekko chart.
Yes, InstaCharts has a generous free tier where you can try out all features. It is limited to 500 rows of data and all charts will have a watermark. Upgrade your subscription to remove these restrictions.
Your data will still be accessible, but from within the free tier limits.
InstaCharts can autodetect currencies, some date formats, timestamps, and numbers across various locales. Many spreadsheet file types are supported including csv, excel, psv, tsv, log, json, json lines, Google Sheets, Google Drive and manual entry.
Yes. Charts sync in real time with Google Sheets. Any changes to your spreadsheet automatically update the chart everywhere it's shared or embedded.
No coding required. Upload data, customize visually, and embed with a copy-paste code.
InstaCharts is faster and simpler than both: no setup, no modeling, no learning curve. It's built for quickly sharing and embedding charts online, which neither Excel nor Power BI do well out of the box.
Yes, charts and data tables can be embedded into websites. Paste the embed code into WordPress, Webflow, Squarespace, or any HTML page. Charts are interactive and auto-update if connected to Google Sheets. There is a view limit based on your InstaCharts plan.
Absolutely! From the share window, turn on the public link for a particular chart. You can customize what is shared - the chart, the data table, turn off editor controls, etc.
Yes, exporting to PNG, SVG, PDF, CSV, and XLSX exports are all supported.
Yes! Connect to 5,000+ apps via Zapier to automate chart creation from Airtable, HubSpot, Salesforce, Notion, and more.
Boost your productivity. Elevate your reports. InstaCharts makes data visualization effortless.
 InstaCharts
We use cookies to analyze website traffic and optimize your experience. By accepting our use of cookies, your data will be aggregated with all other user data.
Visit our Privacy Policy for more info.