How to open a csv file online
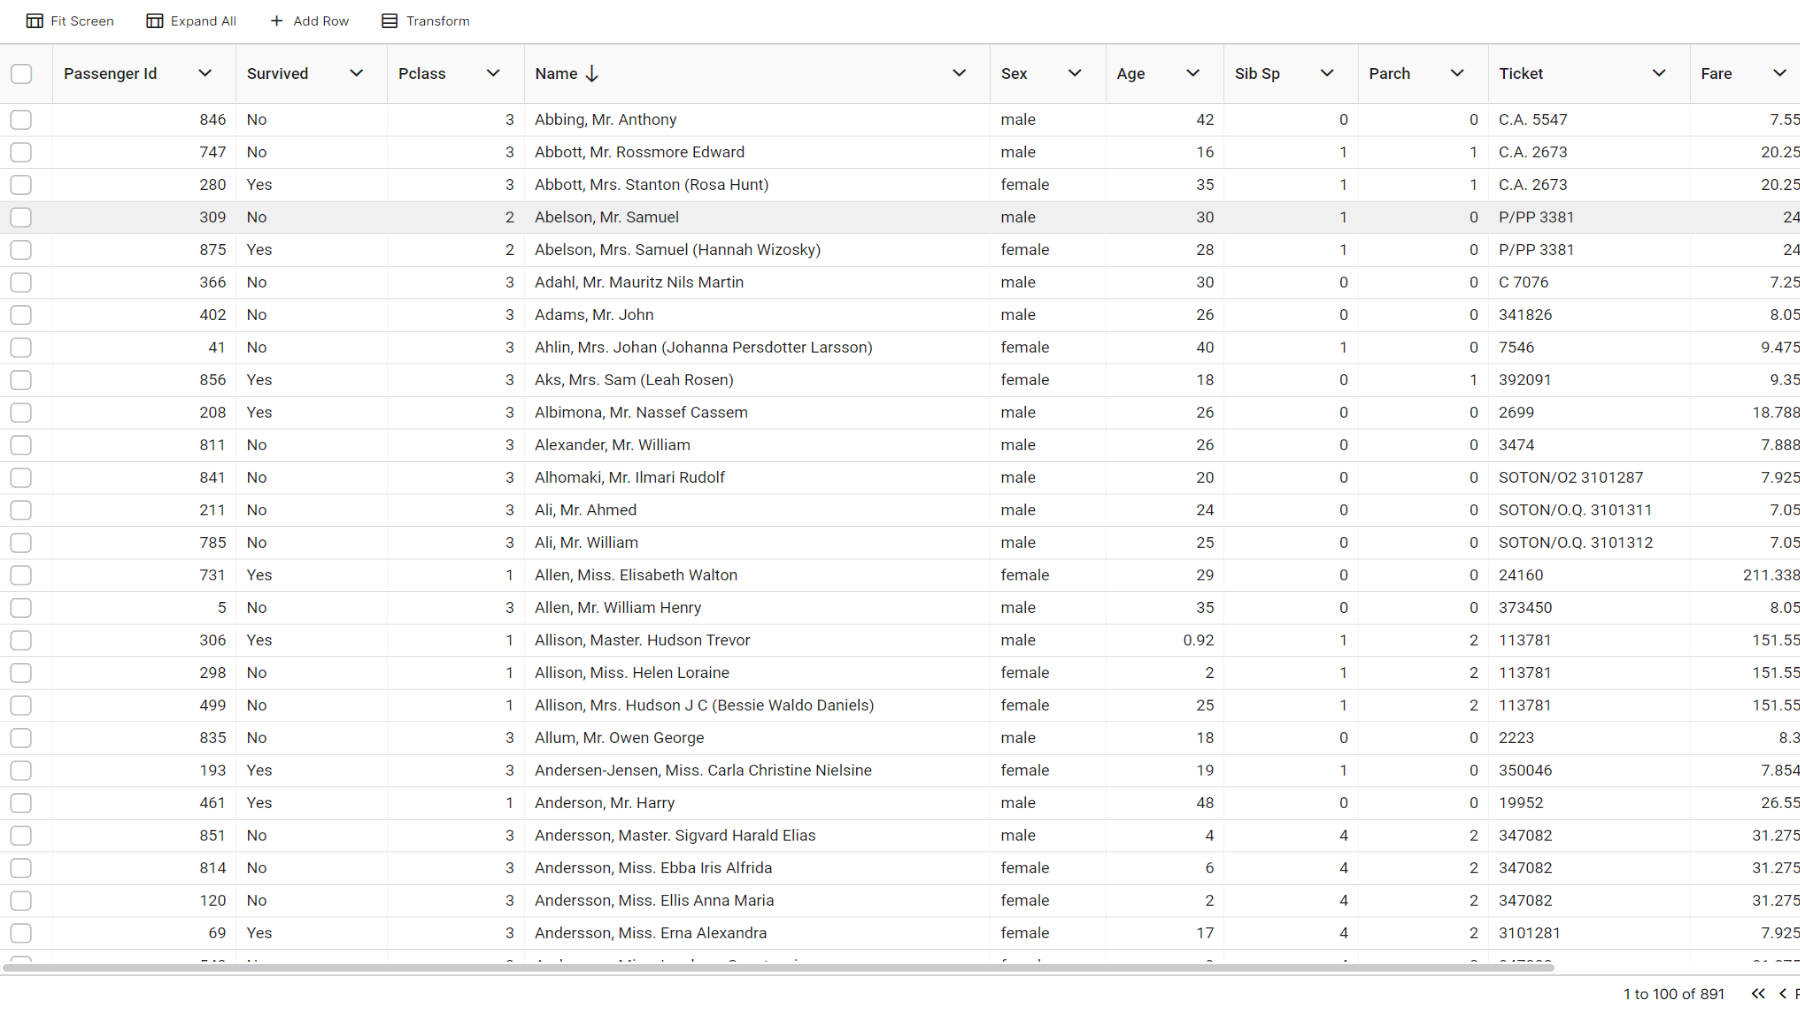
Upload the CSV file to InstaCharts for quick viewing

Bart Howe
· 2 min readUpload the CSV file to InstaCharts for quick viewing

Upload a spreadsheet to InstaCharts for quick data analysis.

Upload the excel workbook to InstaCharts for quick processing
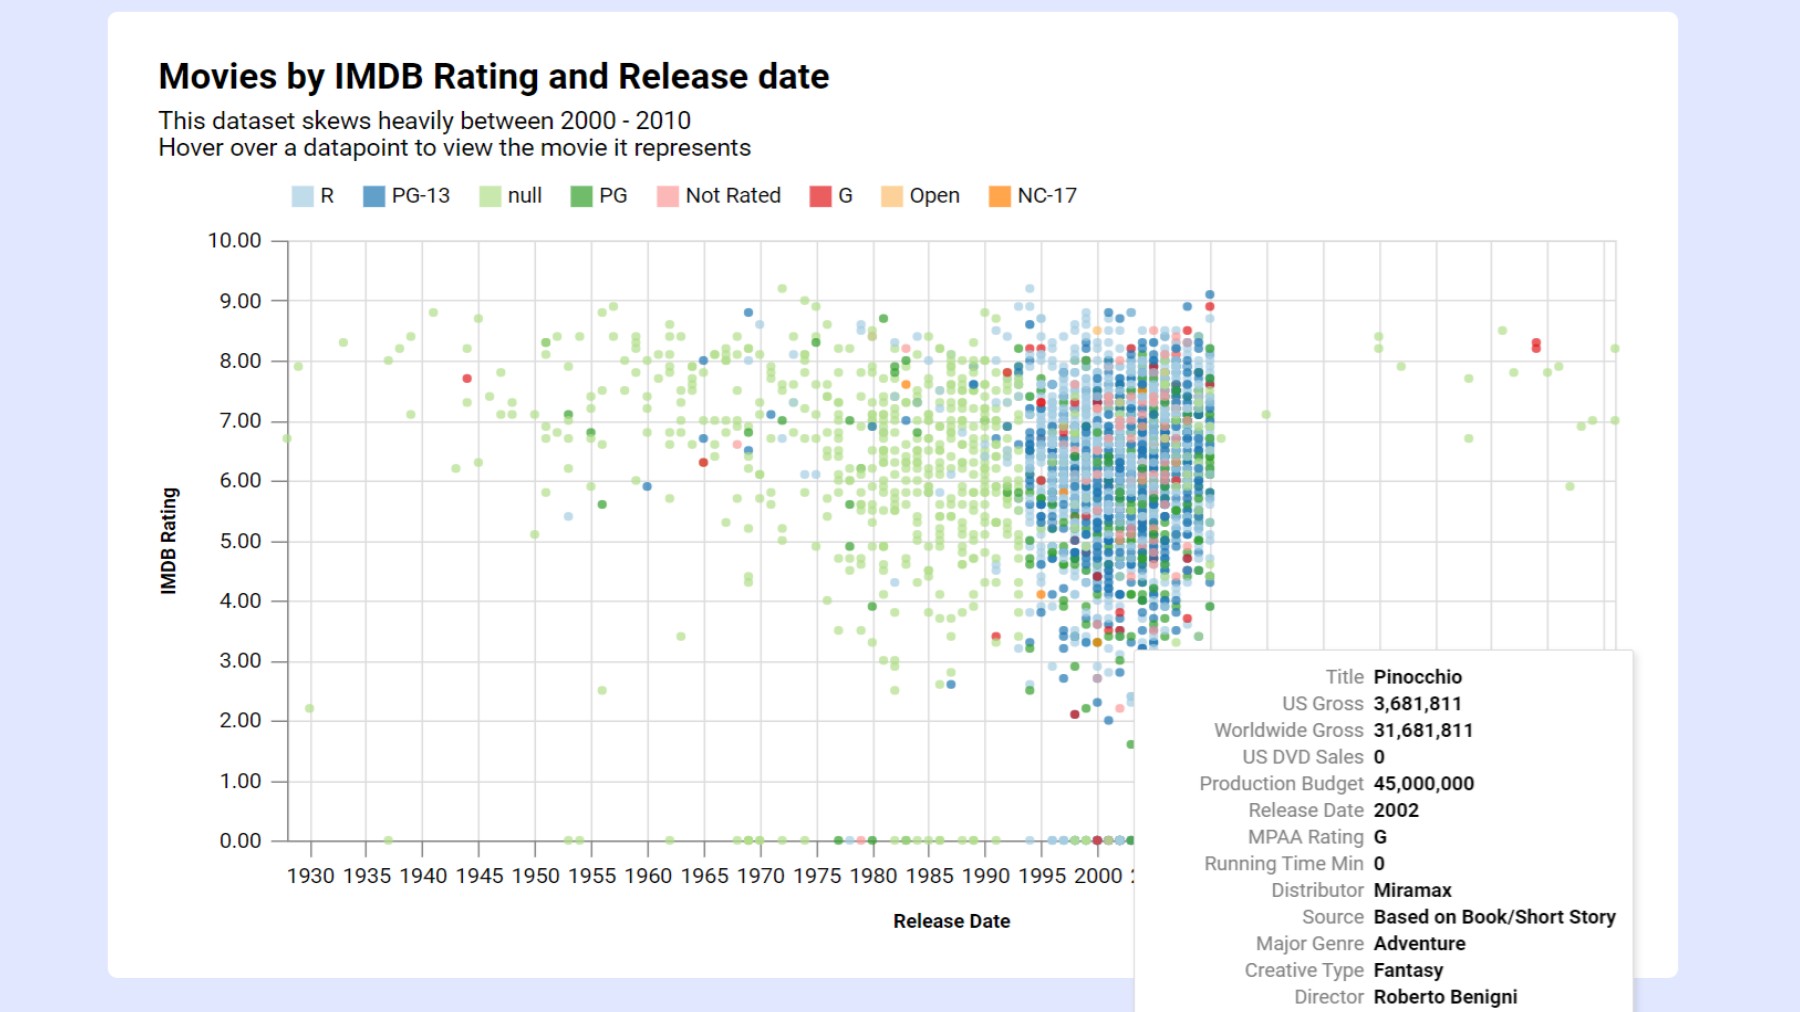
Upload a csv to instantly produce a graph or scatterplot

View the options and features of the UI that make charting quick and easy.


The beta is now open! Quickly create useful charts from your spreadsheet files.
 InstaCharts
We use cookies to analyze website traffic and optimize your experience. By accepting our use of cookies, your data will be aggregated with all other user data.
Visit our Privacy Policy for more info.