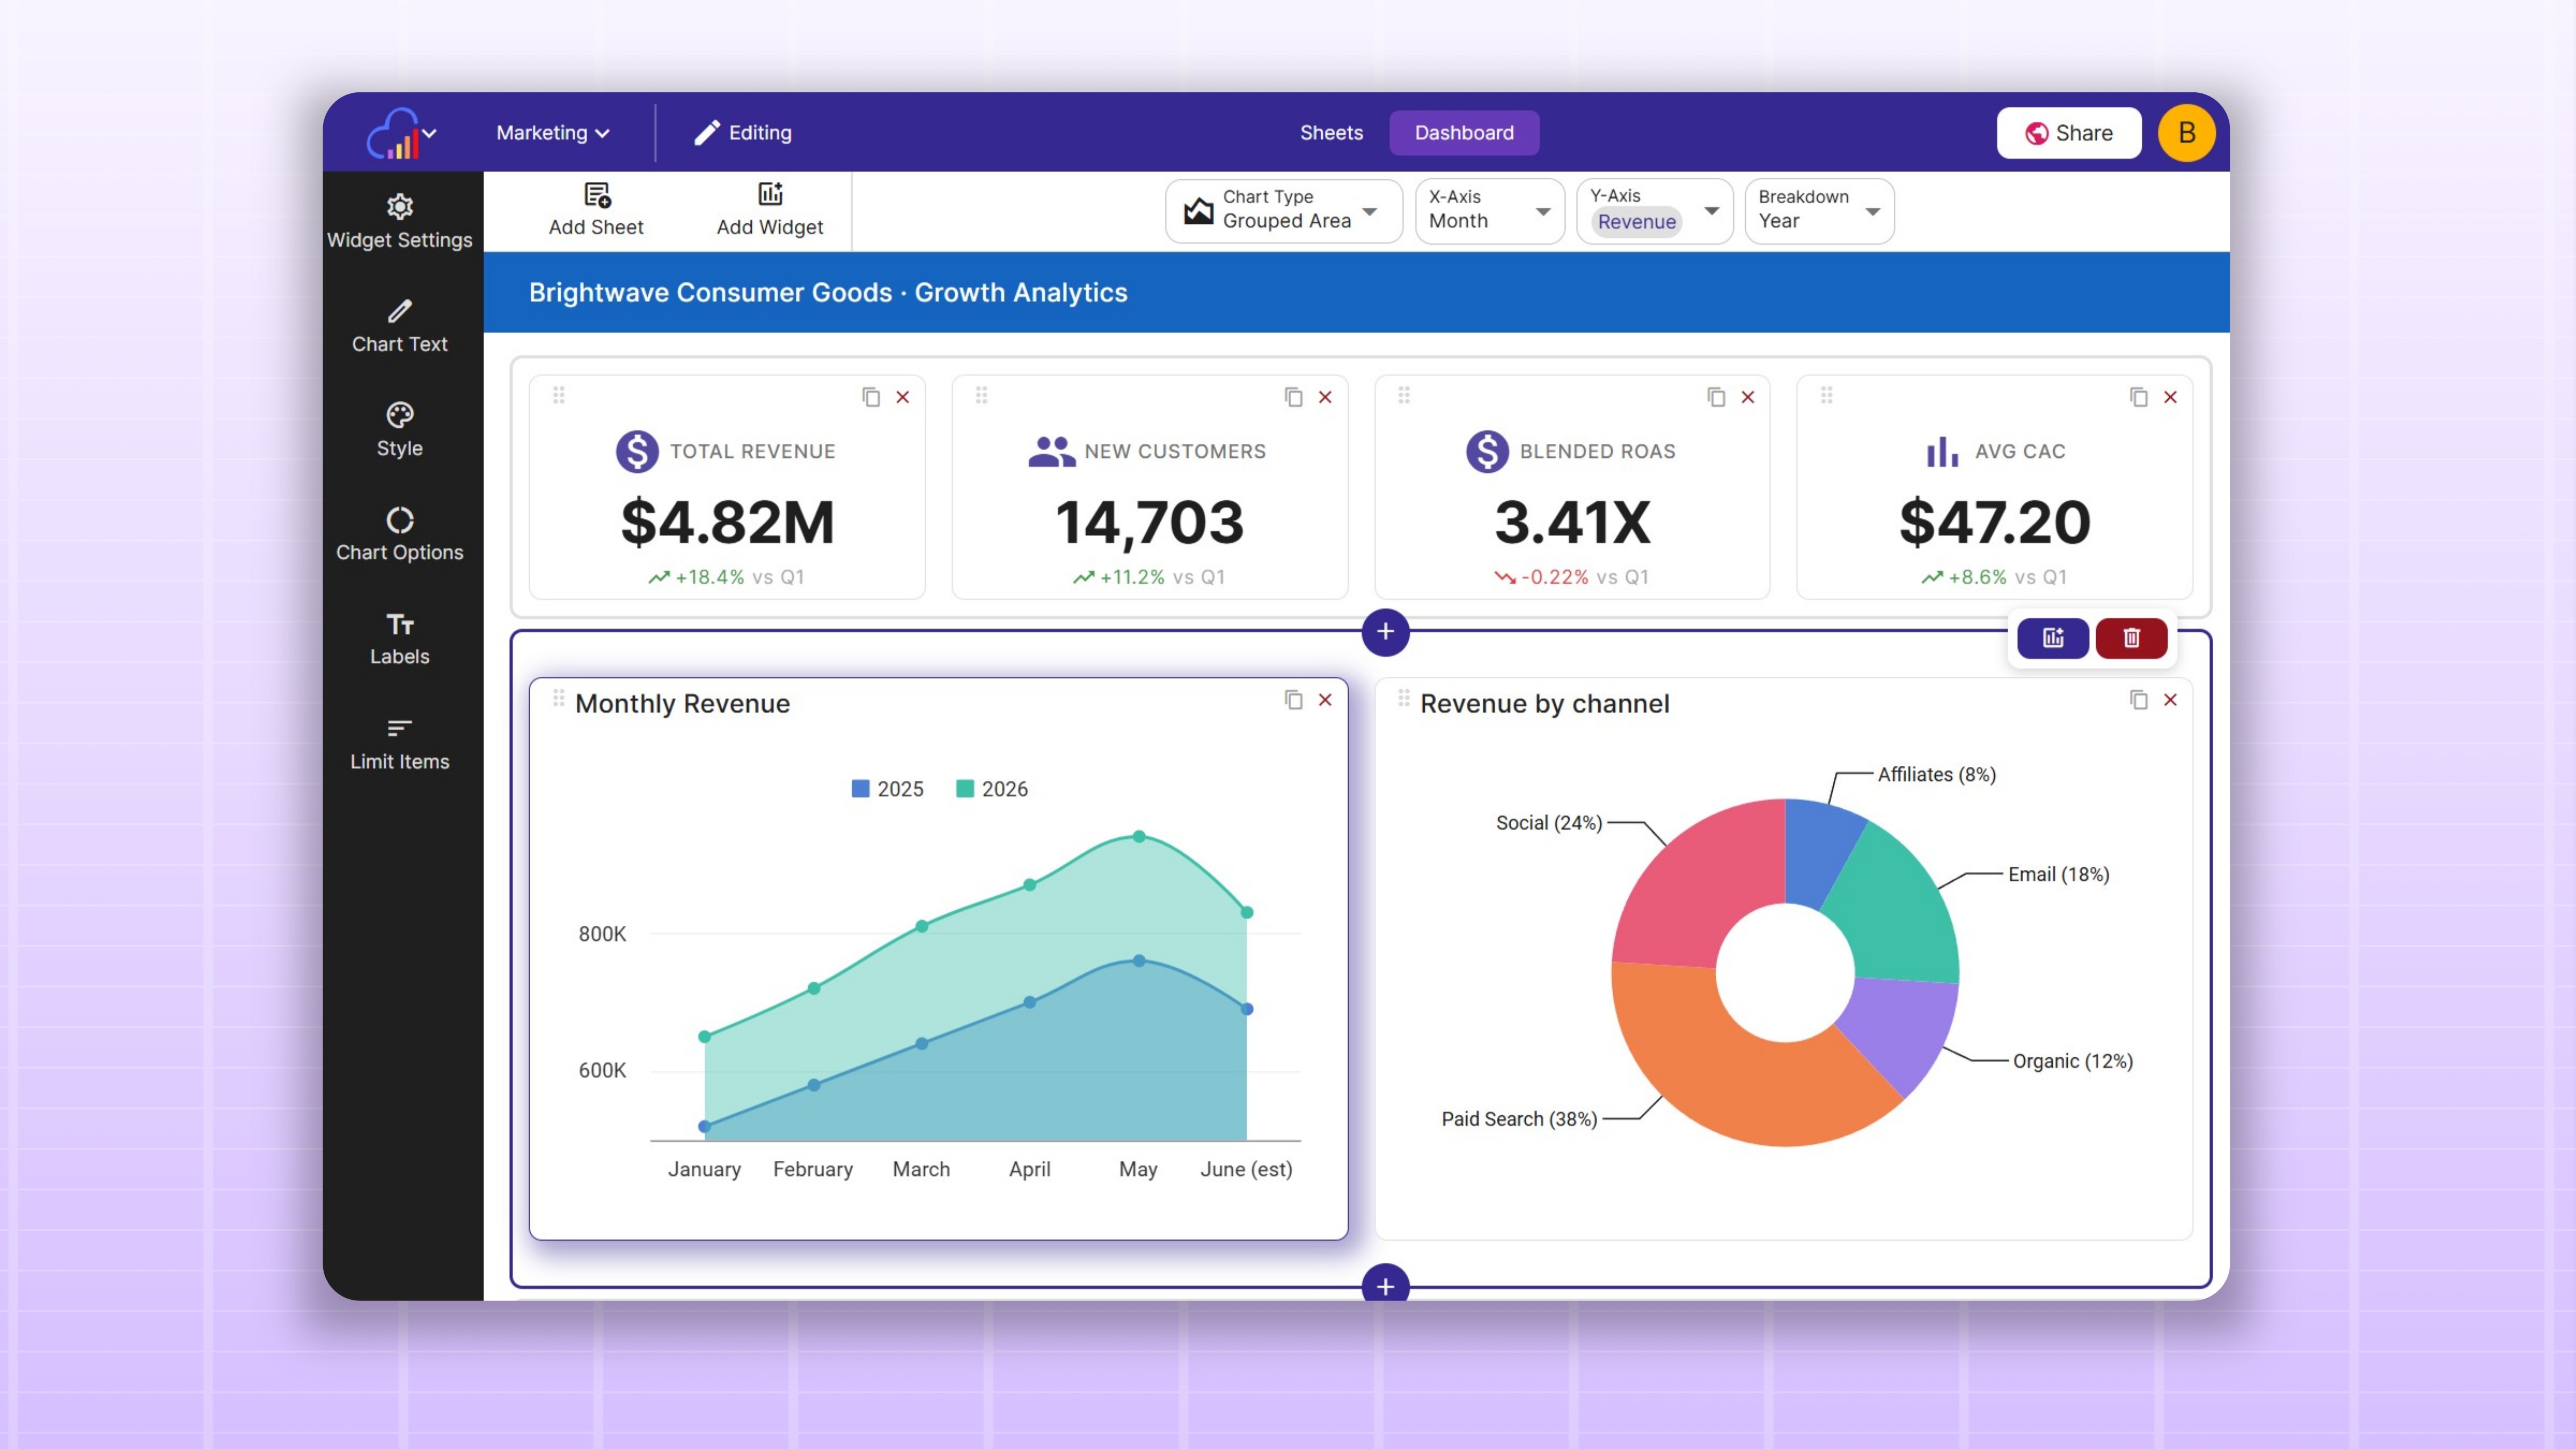
How to create a dashboard from a spreadsheet
Create a dashboard, add your sheets, then build it out with chart, data table, KPI and text widgets.

Bart Howe
· 3 min readCreate a dashboard, add your sheets, then build it out with chart, data table, KPI and text widgets.
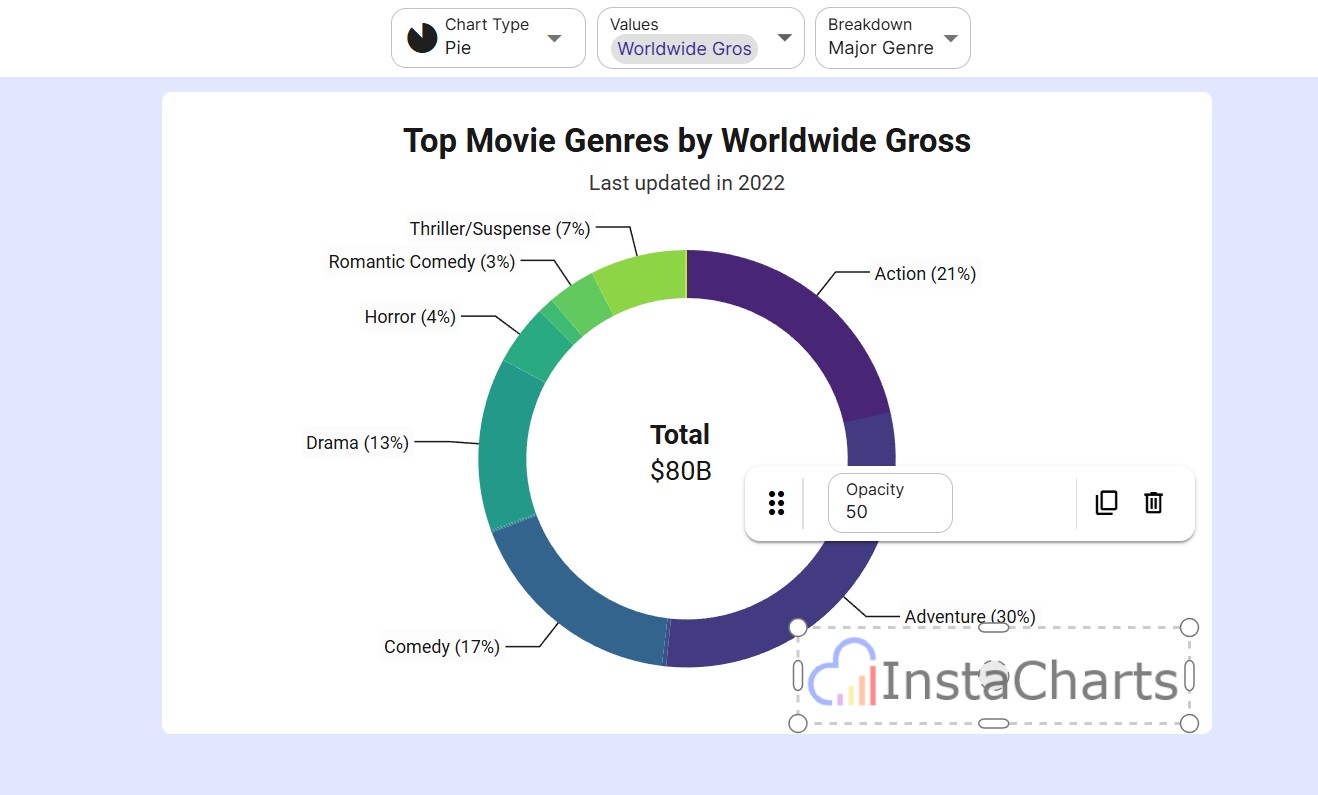
Learn how to add professional watermarks to your charts using InstaCharts' powerful image annotation feature in just four simple steps.
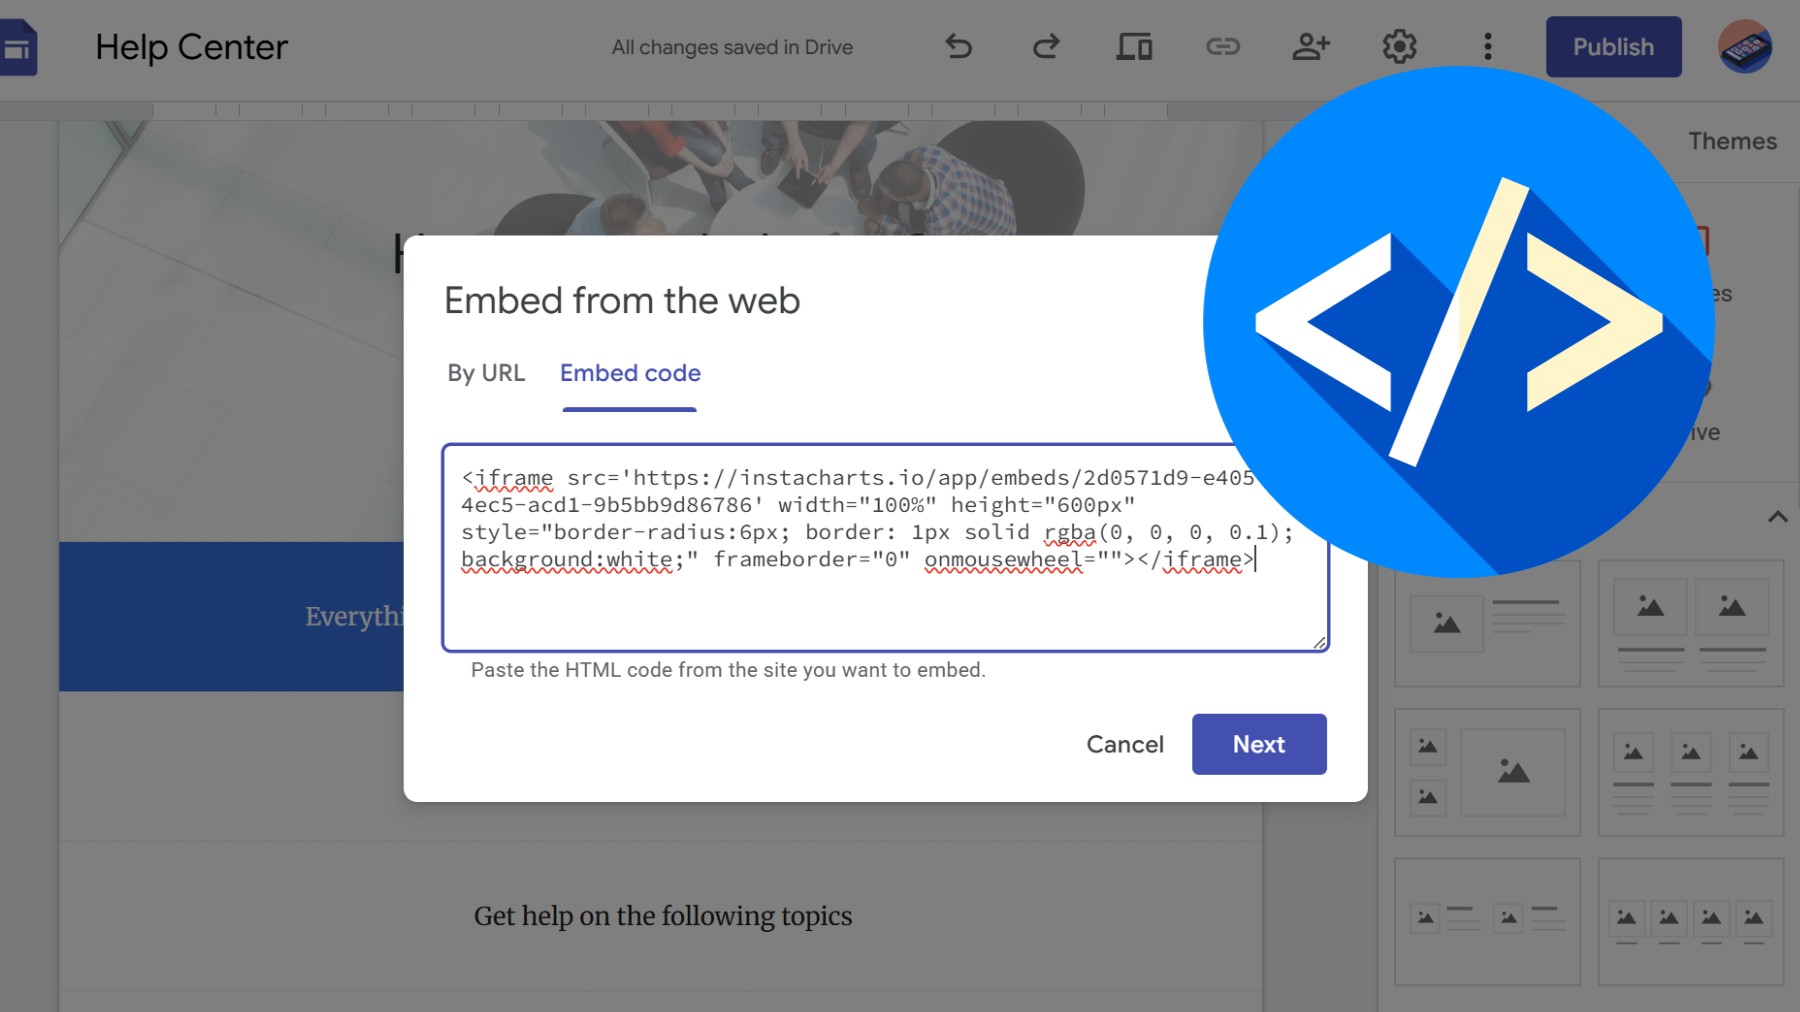
Adding interactive charts to your website can transform static data into engaging content that captivates your audience.
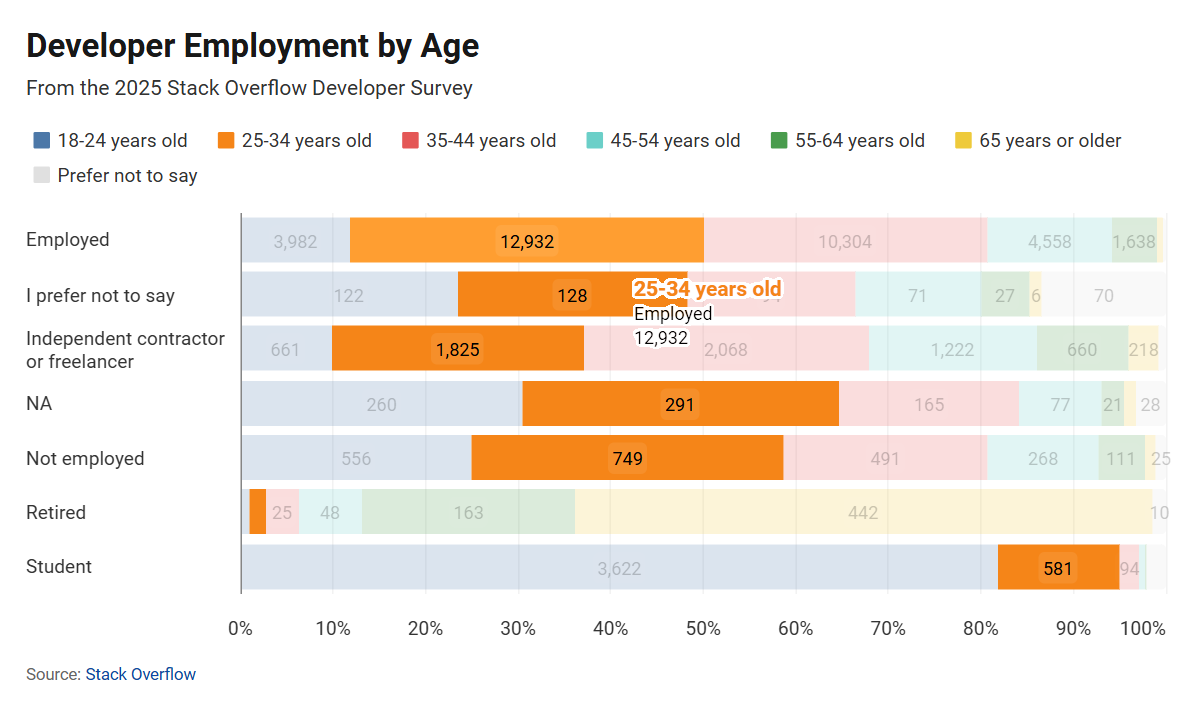
In this guide, we walk you through how to prepare your survey data & choose the perfect visuals to model your survey results
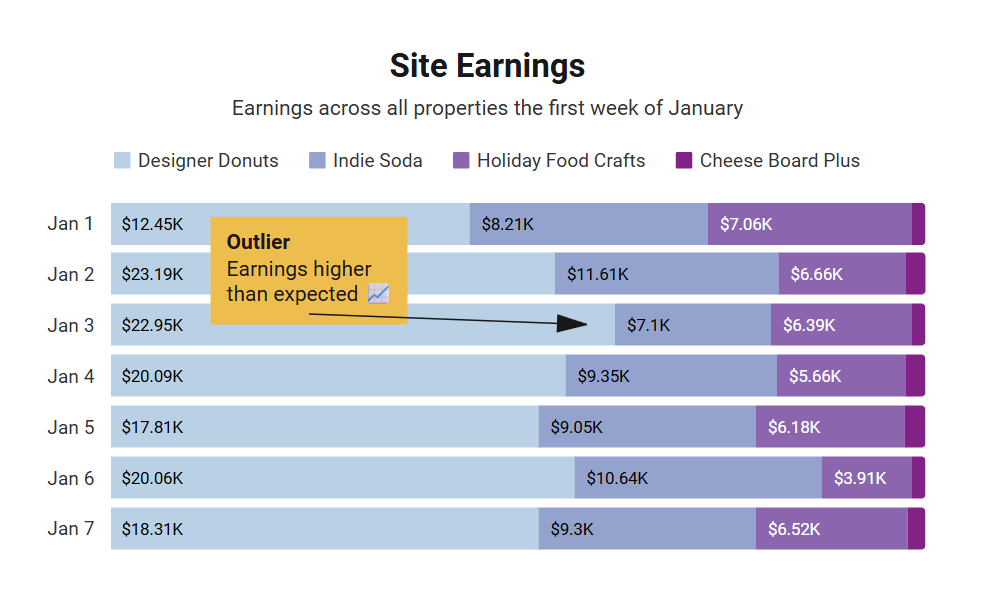
Upload the CSV file to InstaCharts for quick processing
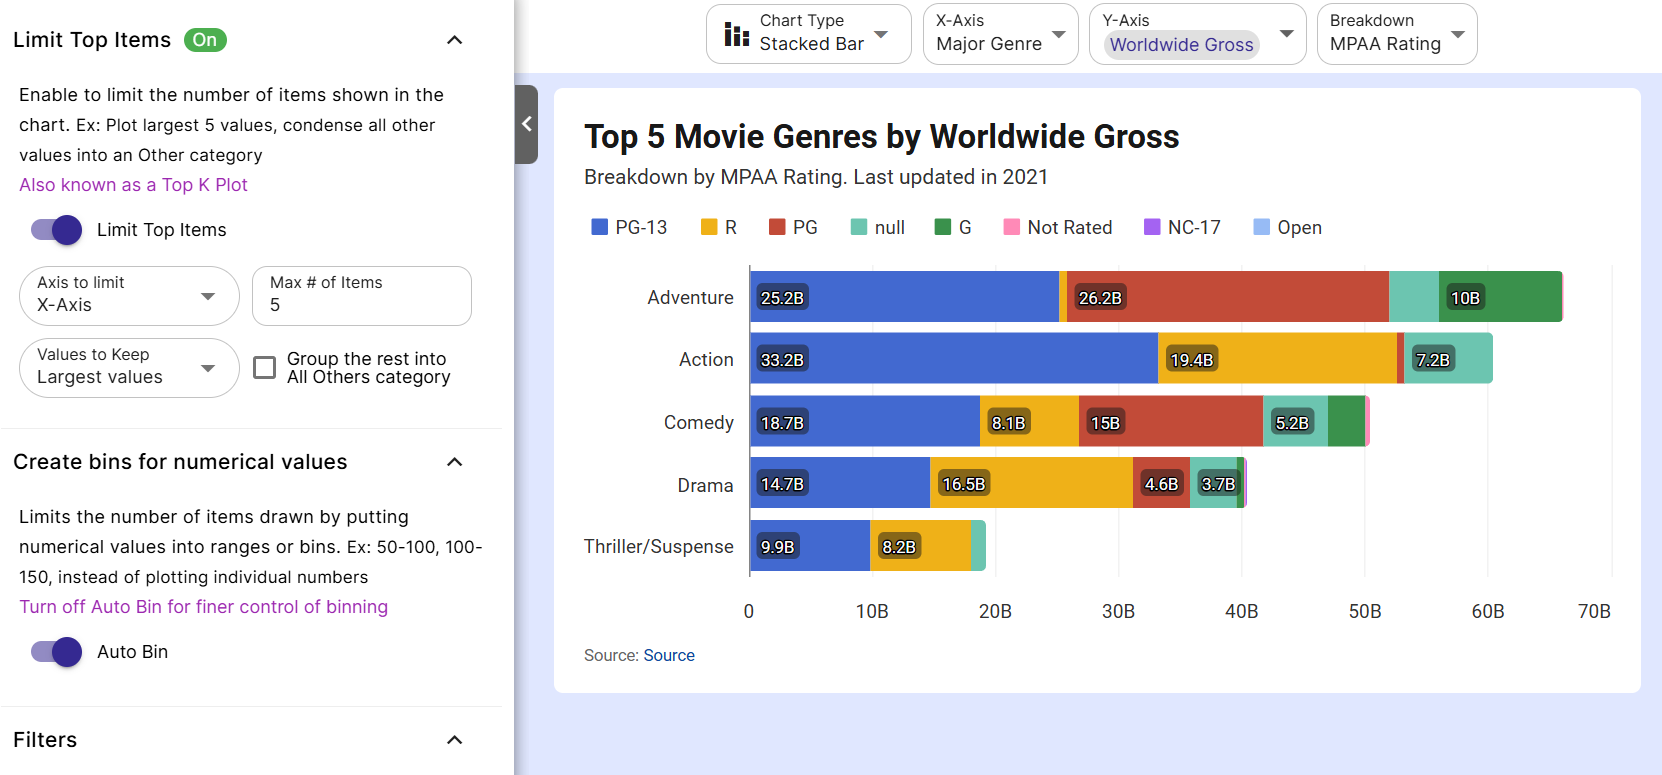
Upload the csv file to InstaCharts and use the Limit Items settings
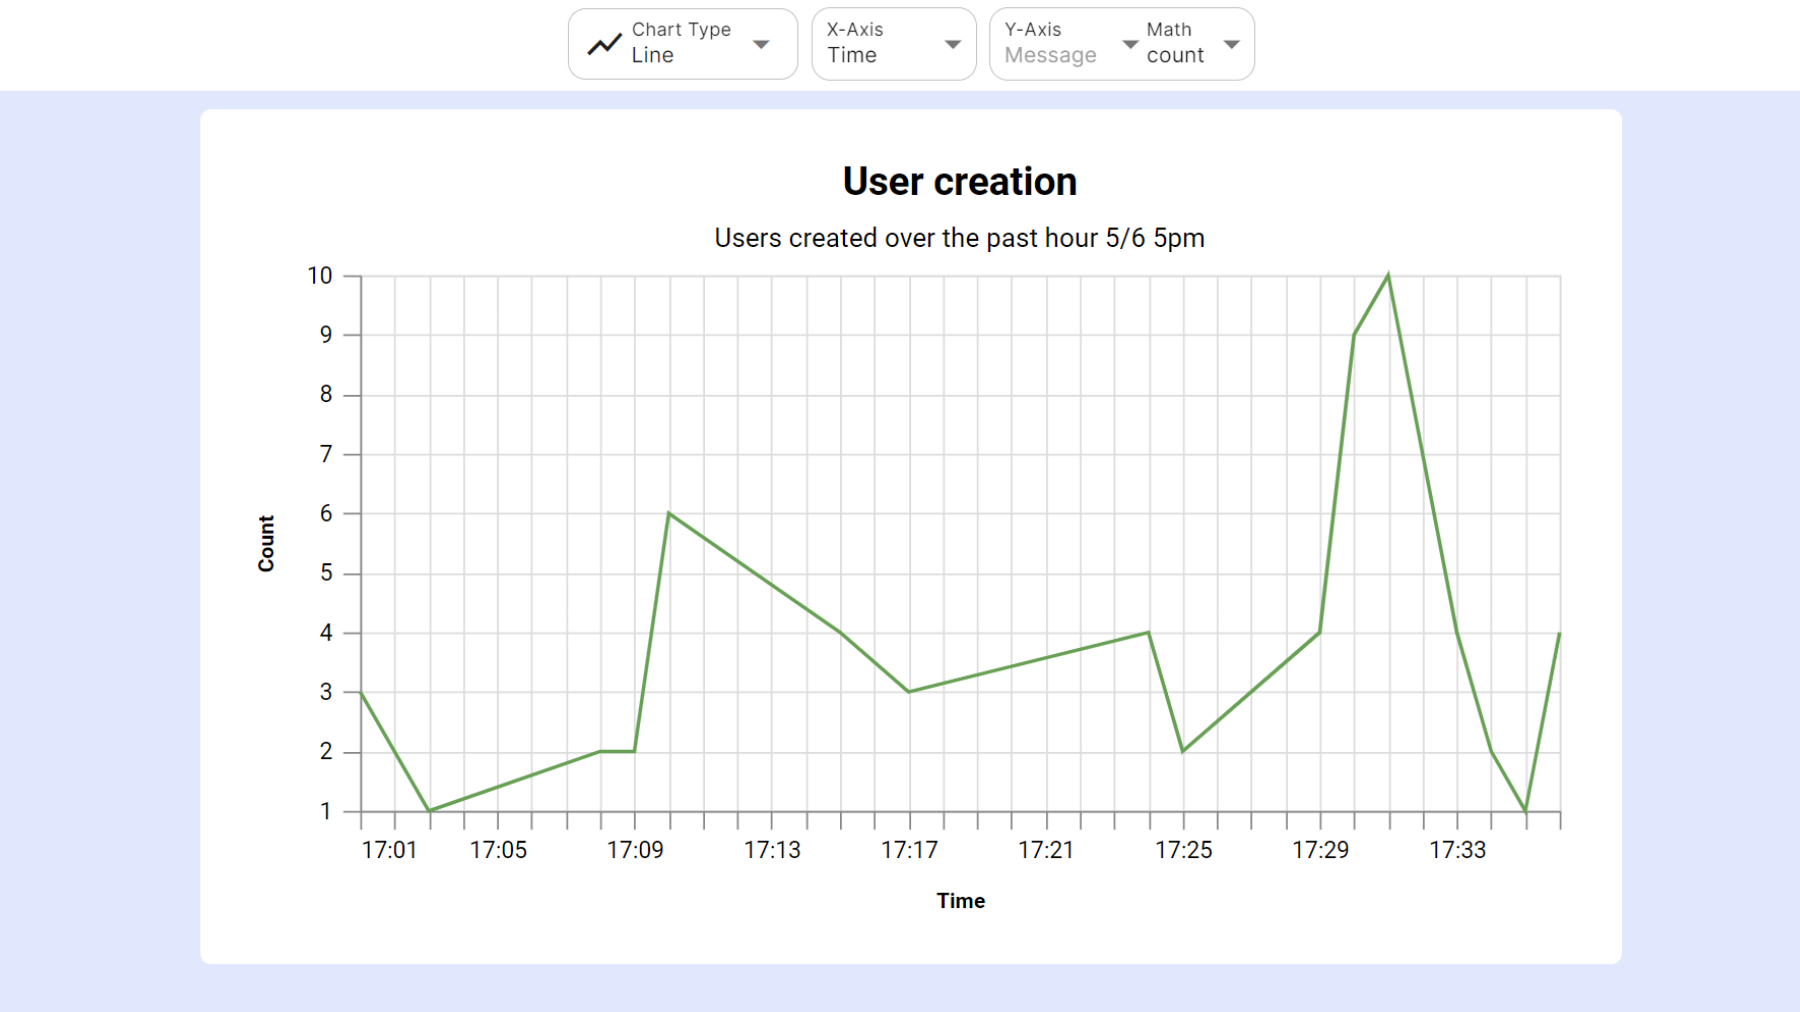
Upload the JSON file to InstaCharts for quick processing
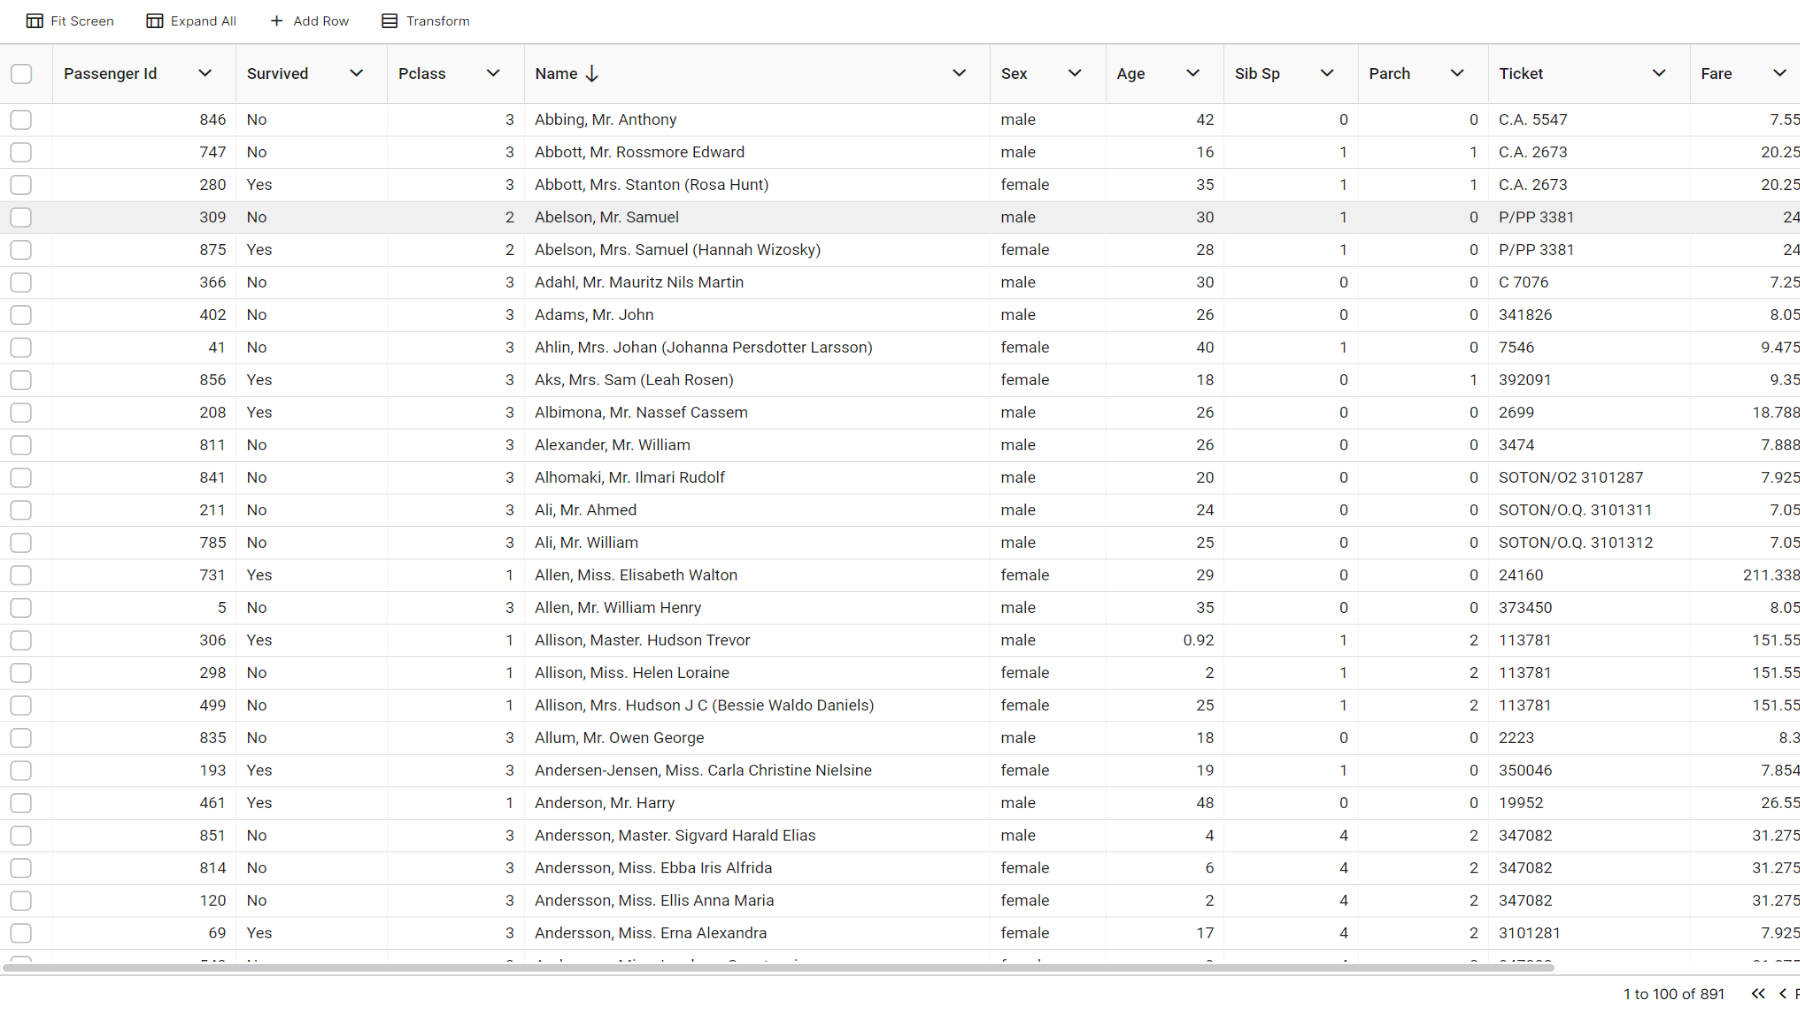
Upload the CSV file to InstaCharts for quick viewing
 InstaCharts
We use cookies to analyze website traffic and optimize your experience. By accepting our use of cookies, your data will be aggregated with all other user data.
Visit our Privacy Policy for more info.