
Chart maker
Budget vs Actual Chart Maker
Compare planned spending with what was actually spent
A budget vs actual chart places planned figures next to what was actually spent or earned, so gaps between the plan and the results stand out. InstaCharts builds it from a sheet with a month column, a Budgeted or Actual label column, and an amount column, using grouped bars, grouped lines, or grouped areas.
A live budget vs actual chart example
An interactive budget vs actual chart built and embedded with InstaCharts.
Templates
Budget vs Actual Chart templates
Choose the Templates tab when you create a new sheet in InstaCharts. Each template loads a sample dataset with a finished chart, so you can replace the sample rows with your own numbers.
Budget vs Actual Expenses
Grouped area chartBudgeted and actual expenses by month, useful for tracking spending against a plan.
| Month | Expense Type | Amount |
|---|---|---|
| 2026-01-01 | Budgeted | 85000.00 |
| 2026-01-01 | Actual | 82500.00 |
| 2026-02-01 | Budgeted | 85000.00 |
| 2026-02-01 | Actual | 87200.00 |
| 2026-03-01 | Budgeted | 88000.00 |
Your data
What data you need for a budget vs actual chart
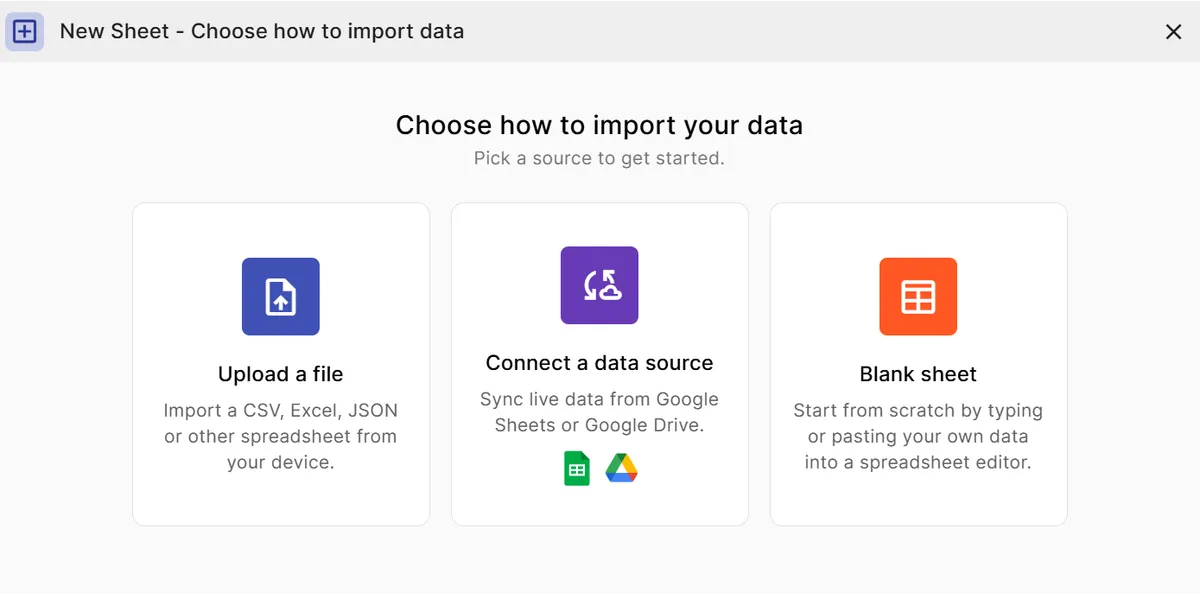
Paste your spreadsheet, upload a CSV or Excel file, or connect a Google Sheet, and InstaCharts detects your column types and builds the budget vs actual chart automatically.
X-Axis
Months or periods, the timeline of the plan
Y-Axis
Numerical values, the amount planned or spent
Breakdown
A label column with the values Budgeted and Actual, each drawn as its own series
Use cases
When to use a budget vs actual chart
Best uses
- Track monthly spending against an approved budget
- Spot the months where actual spending rose above the plan
- Compare forecast and actual revenue for a sales team
- Add an average or custom value line to mark the monthly budget target
When another chart fits better
- Breaking one budget into its parts suits a stacked bar chart or pie chart
- A single series of actual values suits a plain bar chart or line graph
- Cumulative totals over the year read better as a line graph or waterfall chart
How it works
How to make a budget vs actual chart
Step 1
Add your budget data
Use one row for each month and label, with columns for the month, a label such as Budgeted or Actual, and the amount.
Step 2
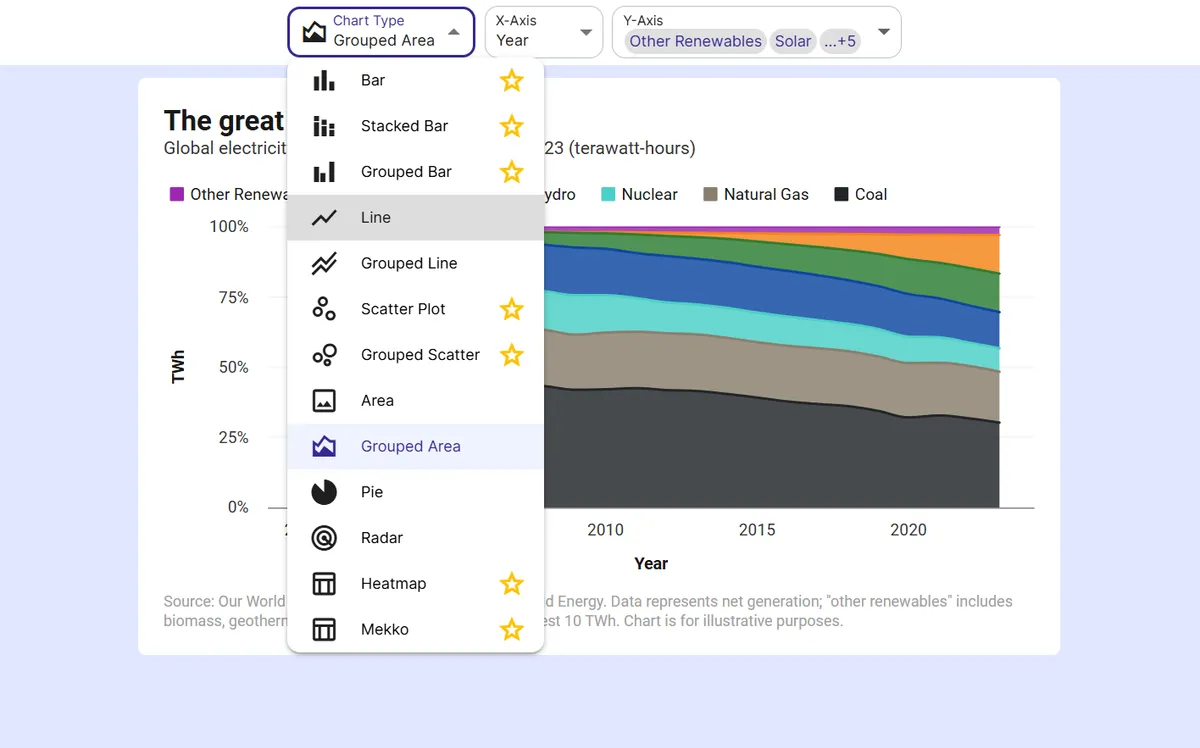
Pick a grouped chart
Choose a grouped bar chart to compare each month side by side, or a grouped line chart to follow the two series over time.
Step 3
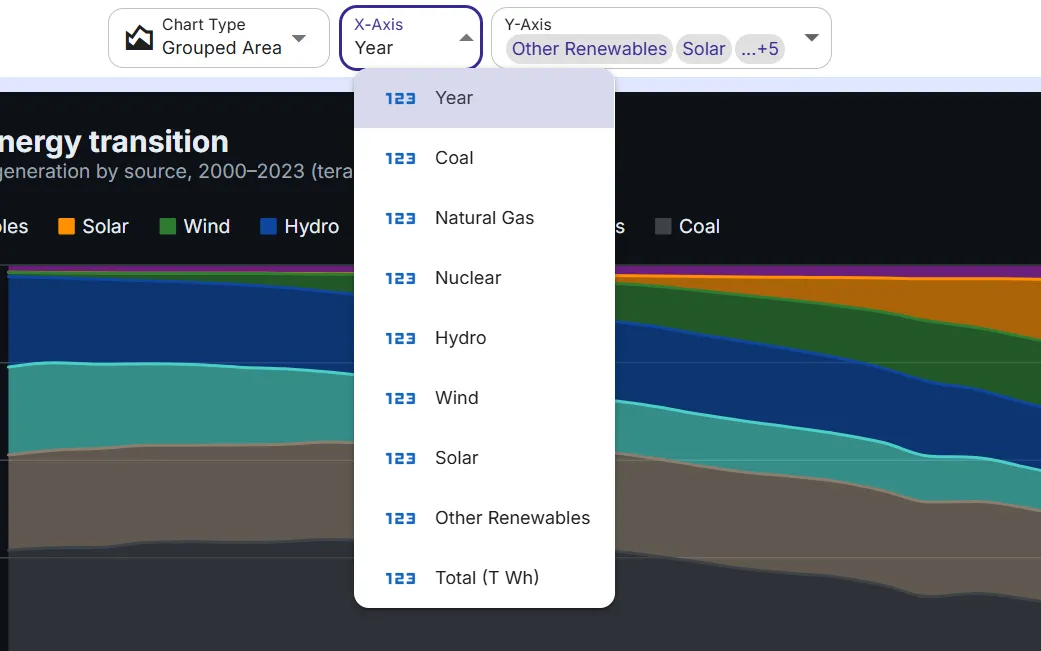
Map your columns
Set the month as the X-axis, the label as the breakdown, and the amount as the Y-axis.
Step 4
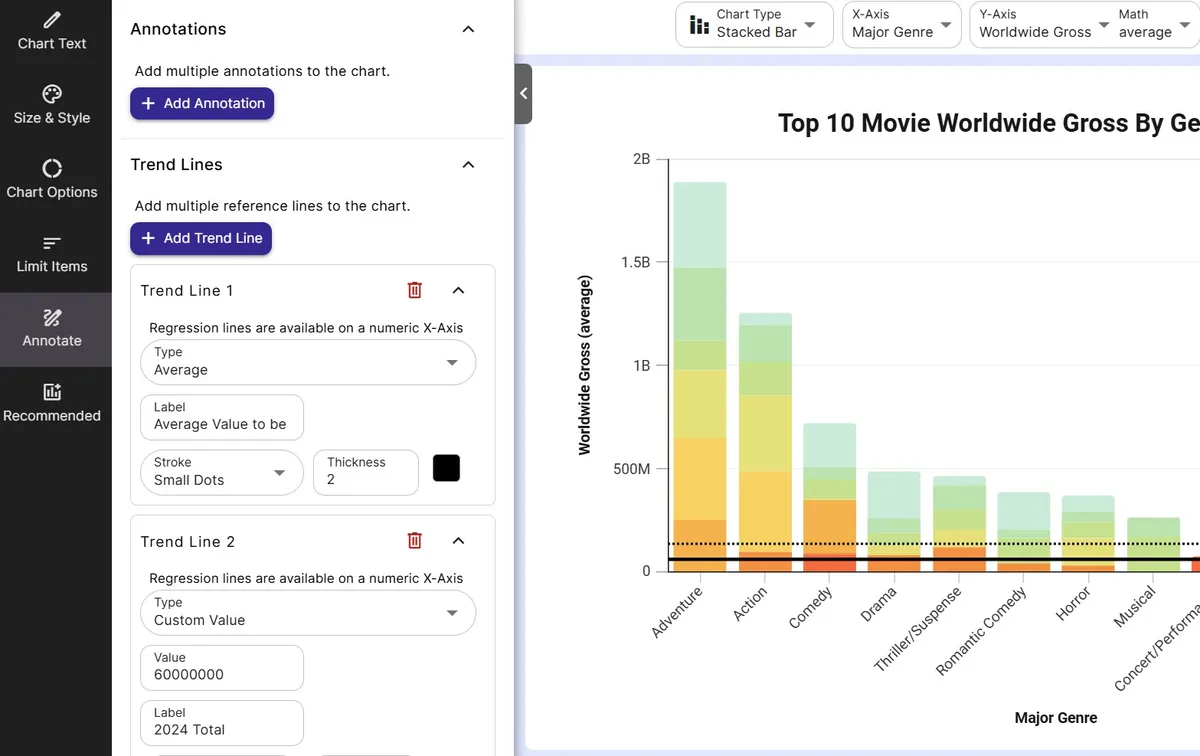
Add a target line
Open the Annotate panel and add a Custom Value trend line to mark a target, or an Average line for the typical month.
Step 5
Export or embed
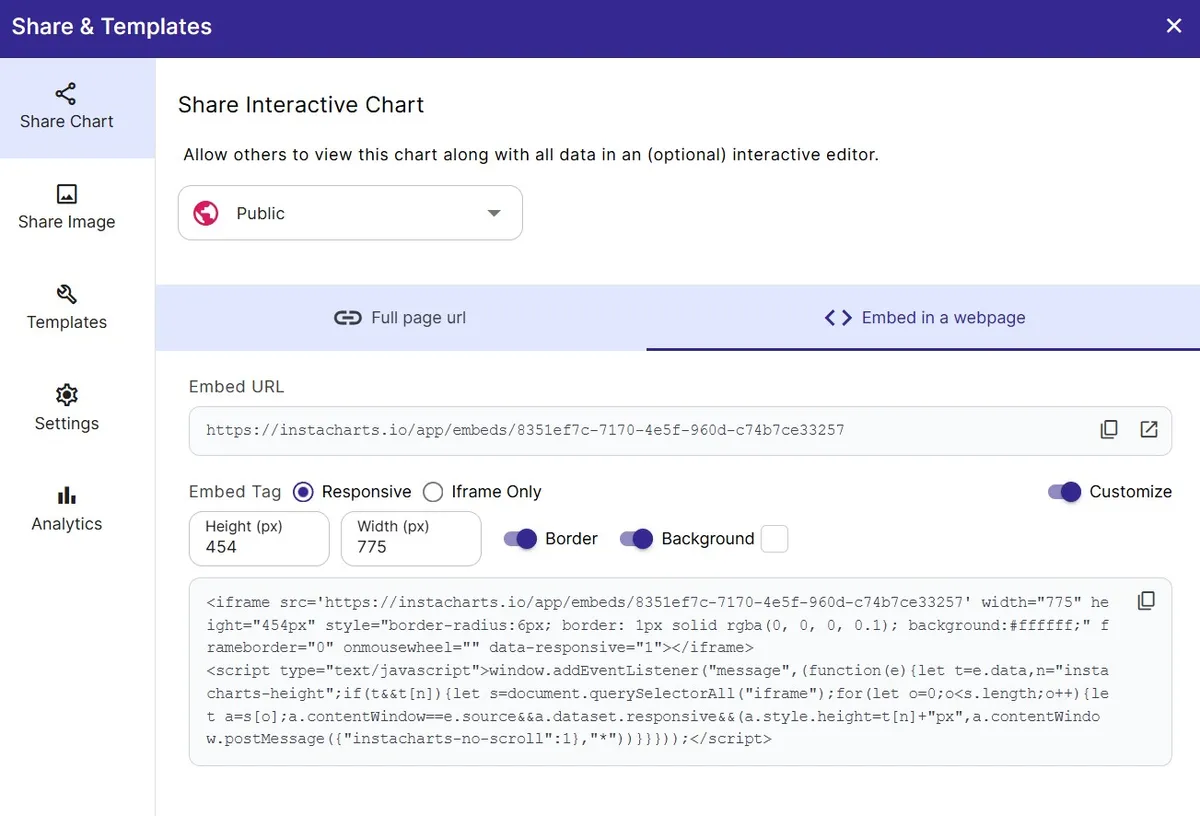
Download as PNG or SVG, share a link, or embed a live chart in a finance report or dashboard.
FAQ
Budget vs Actual Chart maker FAQ
Answers to common questions about making a budget vs actual chart with InstaCharts.
What is a budget vs actual chart?
A budget vs actual chart compares planned amounts with the amounts that really occurred, usually by month or quarter. Placing the two series side by side shows where spending or revenue landed above or below the plan.
What is the best chart for budget vs actual data?
A grouped bar chart works well for a small number of periods because each month shows a budget bar next to an actual bar. A grouped line chart suits longer time series where the trend matters.
How do I make a budget vs actual chart?
Arrange the data with a month column, a label column with Budgeted and Actual values, and an amount column. Choose a grouped chart type and InstaCharts plots the two series together. The Budget vs Actual Expenses template shows the layout.
Can I use an area chart for budget vs actual data?
Yes. Choose a grouped area chart and set it to No Stack in the area options, so each series draws from zero instead of stacking on top of the other. The Budget vs Actual Expenses template is built as a grouped area chart.
How do I add a budget target line to the chart?
Open the Annotate panel, click Add Trend Line, and choose Custom Value. Enter the target amount and a label, and the line draws across the chart.
Is the budget vs actual chart maker free?
Yes. The free plan lets you create and export budget vs actual charts with up to 500 rows per sheet, and charts include a small watermark. Paid plans starting at $10 per user per month remove the watermark.
Want the full reference?
Read the budget vs actual chart documentation.
Related guides
Explore
Related chart makers
Compare related chart types, or browse every InstaCharts chart maker below.
Grouped Bar Chart Maker
Compare several series side by side
Grouped Line Chart Maker
Compare multiple trends on one chart
Cash Flow Waterfall Chart Maker
Show how monthly inflows and outflows build your balance
All InstaCharts chart makers
- Bar Chart Maker
- Stacked Bar Chart Maker
- Grouped Bar Chart Maker
- Line Graph Maker
- Grouped Line Chart Maker
- Area Chart Maker
- Grouped Area Chart Maker
- Pie Chart Maker
- Scatter Plot Maker
- Grouped Scatter Plot Maker
- Radar Chart Maker
- Heatmap Maker
- Mekko Chart Maker
- Gauge Chart Maker
- Grouped Gauge Chart Maker
- Donut Chart Maker
- Waterfall Chart Maker
- Horizontal Bar Chart Maker
- 100% Stacked Bar Chart Maker
- 100% Stacked Area Chart Maker
- Trend Line Graph Maker
- Pie Chart Maker with Percentages
- Semi Circle Pie Chart Maker
- Likert Scale Chart Maker
- Survey Chart Maker
- Cash Flow Waterfall Chart Maker
See every option on the chart maker page.
Make your budget vs actual chart in seconds
InstaCharts makes data visualization easy, so you can build clear reports without design experience.