
Chart maker
Cash Flow Waterfall Chart Maker
Show how monthly inflows and outflows build your balance
A cash flow waterfall chart shows each period's net cash flow as a floating bar that rises when cash comes in and drops when cash goes out, building toward the ending balance. InstaCharts creates one from a column of months and a column of net cash flow with the Waterfall Bars option.
A live cash flow waterfall chart example
An interactive cash flow waterfall chart built and embedded with InstaCharts.
Templates
Cash Flow Waterfall Chart templates
Choose the Templates tab when you create a new sheet in InstaCharts. Each template loads a sample dataset with a finished chart, so you can replace the sample rows with your own numbers.
Cash Flow Waterfall
Waterfall chartNet cash flow for each month of the year, shown as a waterfall of rises and drops building toward the ending balance.
| Month | Net Cash Flow |
|---|---|
| 2026-01-01 | 185000 |
| 2026-02-01 | 96000 |
| 2026-03-01 | -62000 |
| 2026-04-01 | 134000 |
| 2026-05-01 | -78000 |
Your data
What data you need for a cash flow waterfall chart
Paste your spreadsheet, upload a CSV or Excel file, or connect a Google Sheet, and InstaCharts detects your column types and builds the cash flow waterfall chart automatically.
X-Axis
Months or periods, listed in order
Y-Axis
Net cash flow, positive for inflows and negative for outflows
Use cases
When to use a cash flow waterfall chart
Best uses
- Show how monthly inflows and outflows build up or drain the cash balance
- Explain which months created the biggest gains and drops in cash
- Present a cash runway or funding review to investors and executives
- Reconcile a starting cash balance to an ending balance in a board report
When another chart fits better
- Unordered categories fit a standard bar chart better than a running total
- Cash balances at each date read more clearly as a line graph
- Splits of a single total suit a pie chart or stacked bar chart
How it works
How to make a cash flow waterfall chart
Step 1
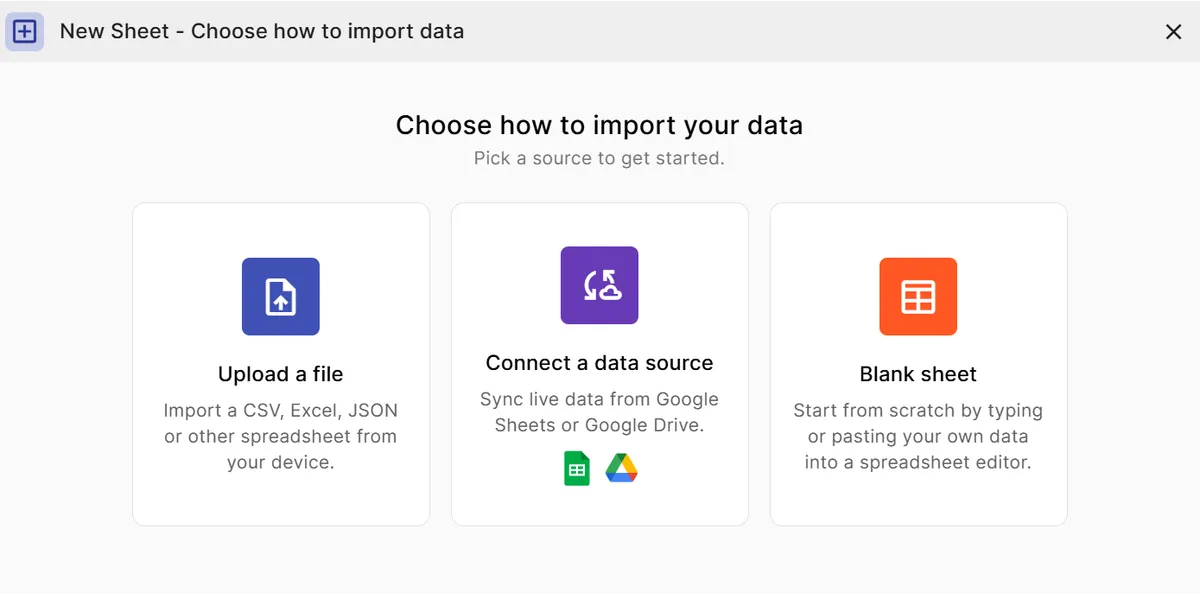
Add your cash flow data
Use one column for the month and one column for net cash flow, entering outflows as negative numbers.
Step 2
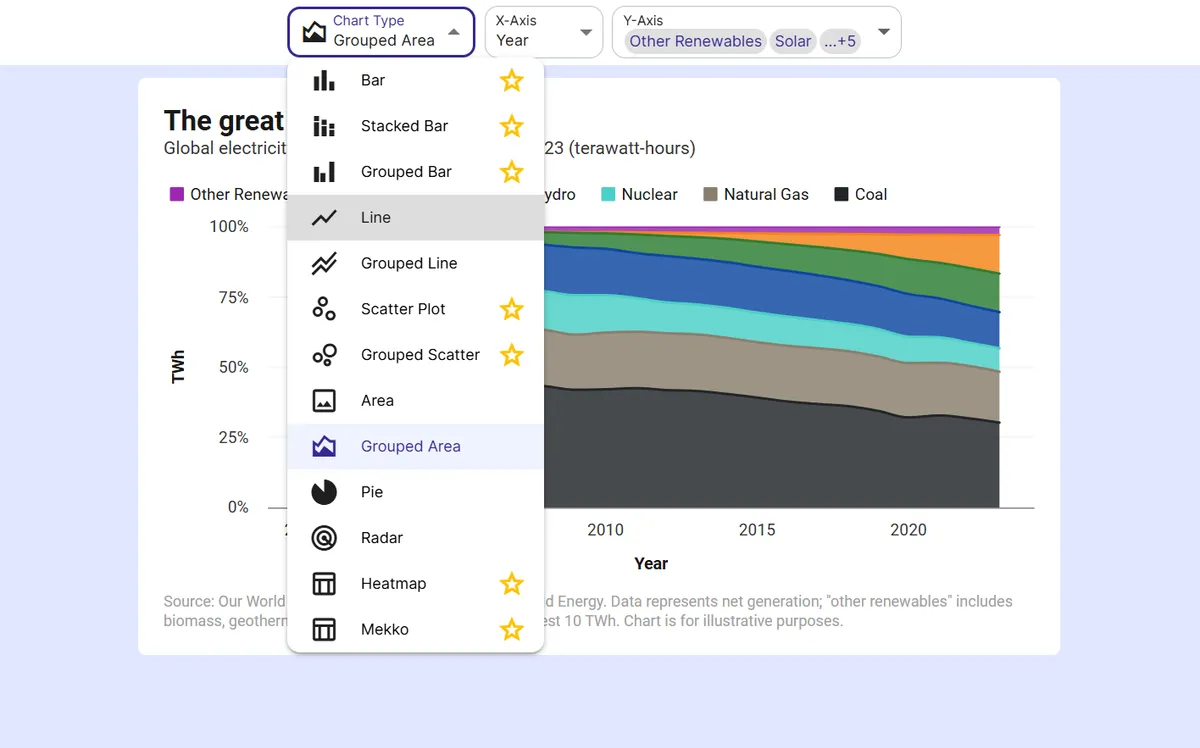
Pick the bar chart
Choose the bar chart type and map the month to the X-axis and net cash flow to the Y-axis.
Step 3
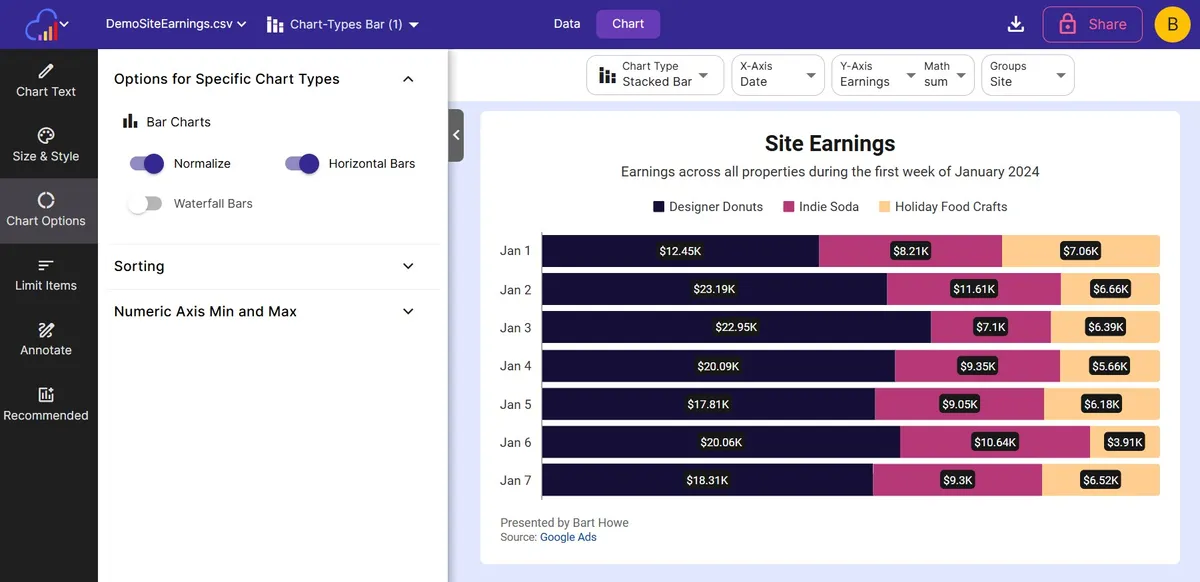
Turn on Waterfall Bars
Switch on the Waterfall Bars toggle in Options for Specific Chart Types so each bar starts where the previous one ended.
Step 4
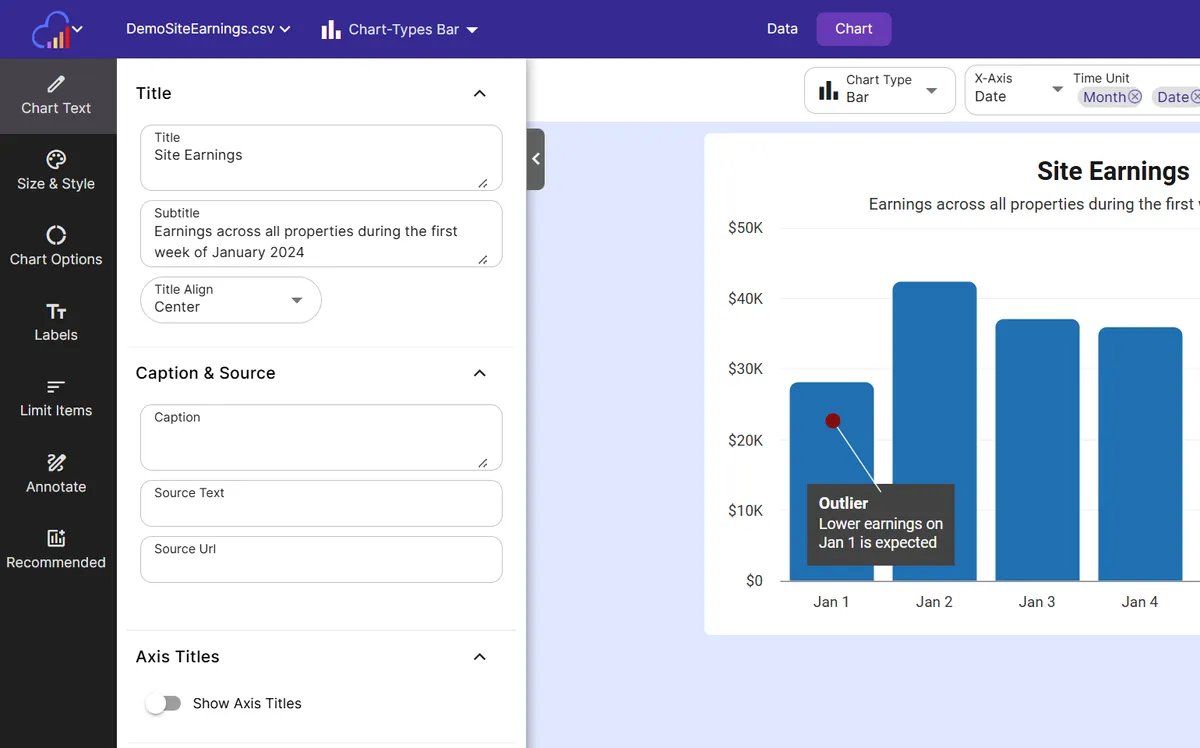
Label the chart
Add a title, data labels, and a caption that names the source of the numbers, such as the bank reconciliation.
Step 5
Export or embed
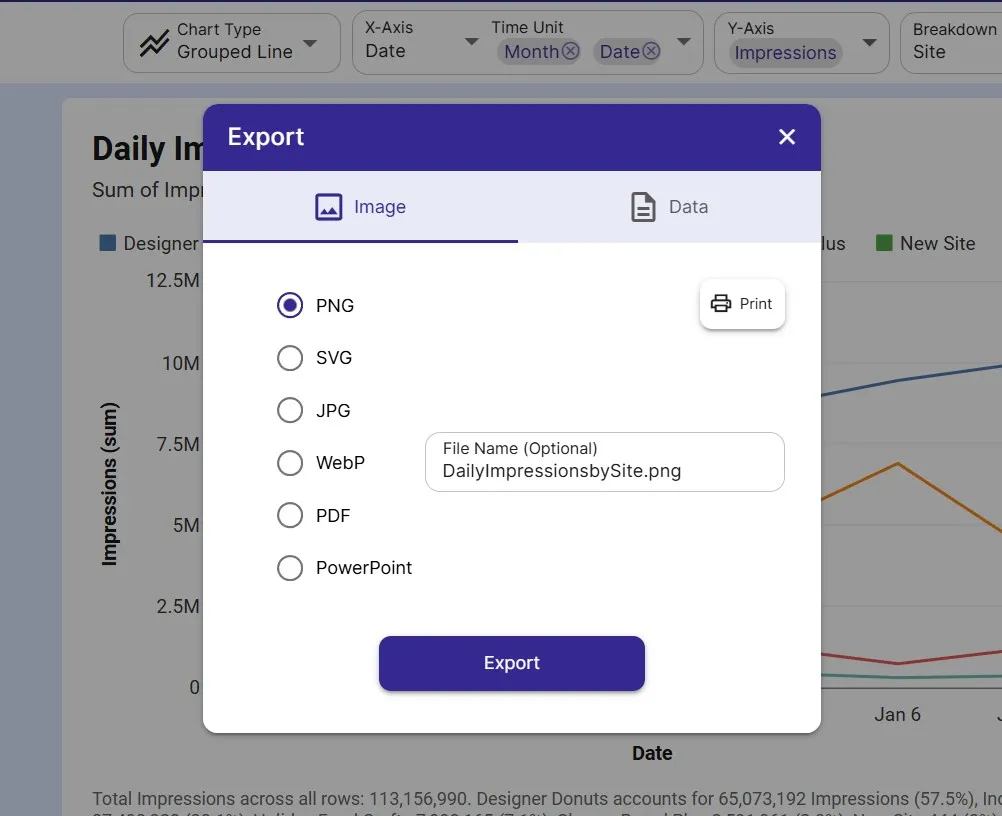
Download as PNG or SVG, share a link, or embed a live chart in a board report or finance dashboard.
FAQ
Cash Flow Waterfall Chart maker FAQ
Answers to common questions about making a cash flow waterfall chart with InstaCharts.
What is a cash flow waterfall chart?
A cash flow waterfall chart plots the net cash flow for each period as a bar that starts where the previous bar ended. Rises show months with cash coming in, drops show months with cash going out, and the running total builds across the chart.
How do I make a cash flow waterfall chart?
Upload a sheet with one column of months and one column of net cash flow, choose the bar chart type, and switch on Waterfall Bars. The Cash Flow Waterfall template shows the layout.
How do I show negative cash flow in a waterfall chart?
Enter outflows and net losses as negative numbers. The waterfall draws those bars as drops, and the Cash Flow Waterfall template colors them separately from the rises.
What is the difference between a waterfall chart and a bar chart?
A bar chart draws every bar from zero, while a waterfall chart starts each bar where the previous one ended. The waterfall therefore shows a running total, which is what a cash flow review needs.
Can I use a waterfall chart for a profit and loss statement?
Yes. The same setup works for revenue, cost, and profit line items, and for any budget that moves from a starting value to an ending value through positive and negative steps.
Is the cash flow waterfall chart maker free?
Yes. The free plan lets you create and export waterfall charts with up to 500 rows per sheet, and charts include a small watermark. Paid plans starting at $10 per user per month remove the watermark.
Want the full reference?
Read the cash flow waterfall chart documentation.
Related guides
Explore
Related chart makers
Compare related chart types, or browse every InstaCharts chart maker below.
Waterfall Chart Maker
Show how a value builds up step by step
Budget vs Actual Chart Maker
Compare planned spending with what was actually spent
Bar Chart Maker
Compare values across categories online
All InstaCharts chart makers
- Bar Chart Maker
- Stacked Bar Chart Maker
- Grouped Bar Chart Maker
- Line Graph Maker
- Grouped Line Chart Maker
- Area Chart Maker
- Grouped Area Chart Maker
- Pie Chart Maker
- Scatter Plot Maker
- Grouped Scatter Plot Maker
- Radar Chart Maker
- Heatmap Maker
- Mekko Chart Maker
- Gauge Chart Maker
- Grouped Gauge Chart Maker
- Donut Chart Maker
- Waterfall Chart Maker
- Horizontal Bar Chart Maker
- 100% Stacked Bar Chart Maker
- 100% Stacked Area Chart Maker
- Trend Line Graph Maker
- Pie Chart Maker with Percentages
- Semi Circle Pie Chart Maker
- Likert Scale Chart Maker
- Survey Chart Maker
- Budget vs Actual Chart Maker
See every option on the chart maker page.
Make your cash flow waterfall chart in seconds
InstaCharts makes data visualization easy, so you can build clear reports without design experience.