
Mekko Chart Maker
Show size and composition at once
A Mekko, or Marimekko, chart is a two-dimensional stacked bar chart where column width shows each category's total and segment height shows its internal composition, so cell area is proportional to the actual value. InstaCharts builds this market-share favorite straight from your spreadsheet.
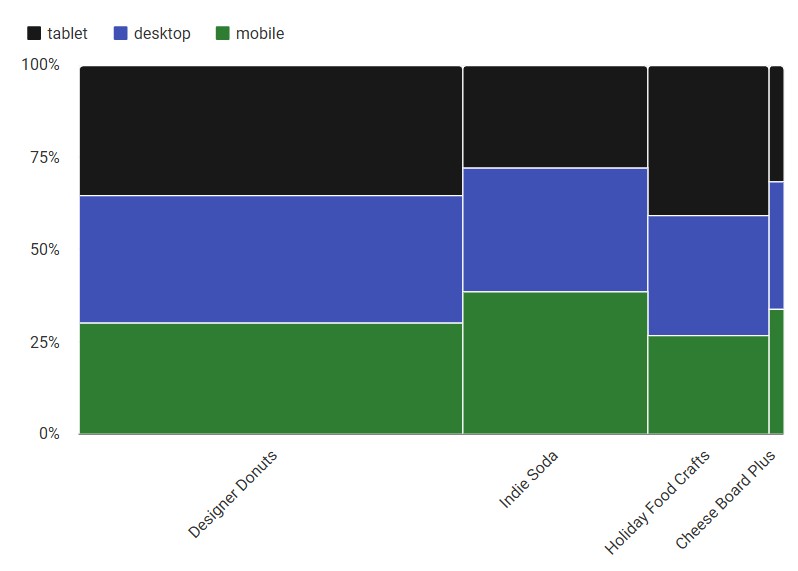
A live mekko chart example
An interactive mekko chart built and embedded with InstaCharts.
What data you need for a mekko chart
Paste your spreadsheet, upload a CSV or Excel file, or connect a Google Sheet, and InstaCharts detects your column types and builds the mekko chart automatically.
When to use a mekko chart
- Show that one category is larger than another and how each is composed
- Compare segment share across markets of different sizes in one view
- Visualize how a budget or resource is split within departments
- Present a two-level categorical breakdown with one numeric measure
When another chart fits better
- Many thin segments become unreadable; group small ones into Other
- For exact numbers, use a table or stacked bar chart
- Mekko charts are not designed for negative values
How to make a mekko chart
- 1Add your data: Paste a spreadsheet, or upload a CSV, Excel, TSV, or JSON file.
- 2Pick the mekko chart: InstaCharts auto-suggests a chart; switch to this type in one click.
- 3Map your columns: Choose which columns drive each axis, or accept the smart defaults.
- 4Customize styling: Adjust colors, labels, and titles to match your brand or report.
- 5Export or embed: Download as PNG, SVG, or PDF, share a link, or embed a live, auto-updating chart.
Mekko Chart maker FAQ
Is the Mekko chart maker free?
Yes. Creating and exporting a Mekko chart is free with no account. The free tier supports up to 500 rows and adds a watermark; paid plans from $10/month remove it.
What is the difference between a Mekko and a stacked bar chart?
A stacked bar chart uses equal-width bars, so only height carries meaning. A Mekko chart also varies the column width by the category total, so both width and height encode data and cell area reflects the absolute value.
What data do I need for a Mekko chart?
A category column for the columns, a numeric value column, and a breakdown column for the segments within each column. InstaCharts can pivot raw data into this shape automatically.
When should I use a Mekko chart?
Reach for a Mekko chart for market-share and resource-allocation analysis, where you need to compare both the size of each category and how it breaks down internally in a single picture.
Want the full reference? Read the mekko chart documentation.
Related chart makers
Stacked Bar Chart Maker
Show totals and composition in one chart
Bar Chart Maker
Compare values across categories online, free
Heatmap Maker
Reveal patterns across a data grid
See every option on the chart maker page.
Craft professional charts in seconds
Boost your productivity. Elevate your reports. InstaCharts makes data visualization effortless.