
Science templates
Science Chart Templates
3 free templates you can edit online
Lab and research data can run from nanometers to billions of cells in a single study. These templates chart a bacterial growth curve, the visible light spectrum and wastewater monitoring with values written in scientific notation, ready for a lab report, poster or public dashboard.
- 3 templates
- Real sample data
- No account needed
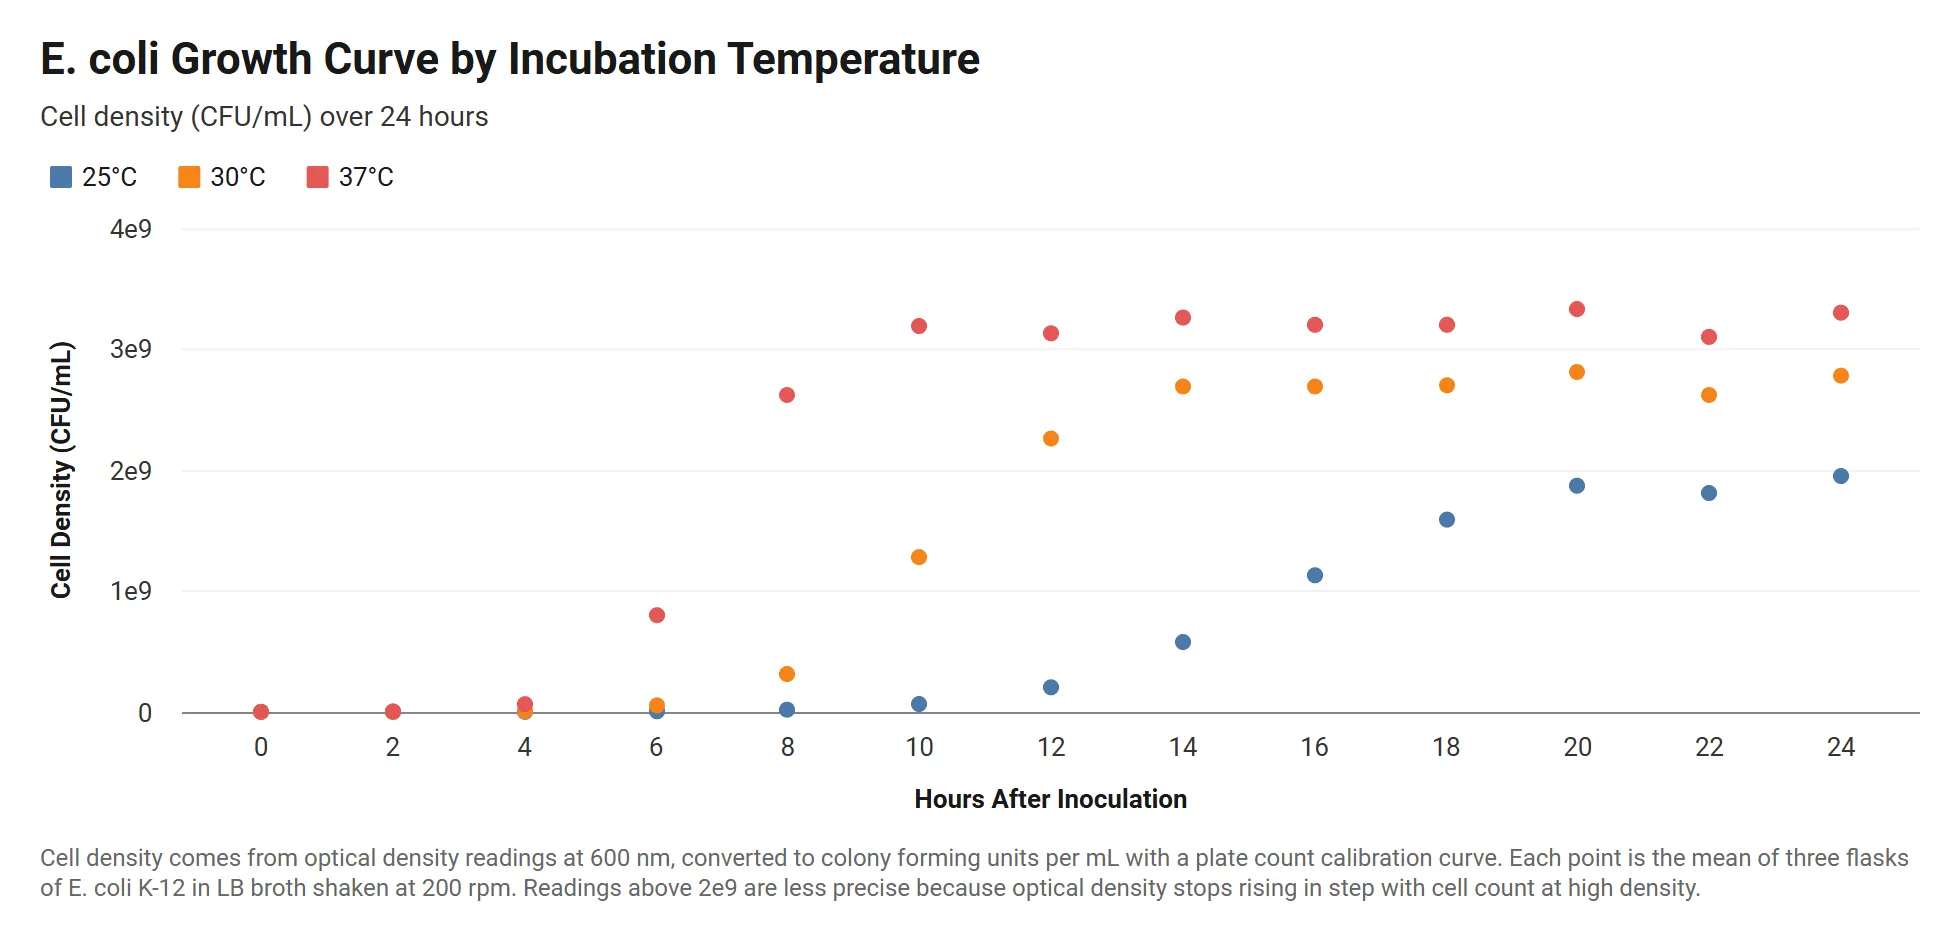
Bacterial Growth Curve by Temperature
Science
Science Chart Templates
Each template opens in the InstaCharts chart maker with its sample data loaded. Replace the rows with your own numbers, then export, share or embed the chart.
 Grouped Scatter Plot
Bacterial Growth Curve by Temperature
E. coli cell density over 24 hours at three incubation temperatures, with readings written in scientific notation.
View template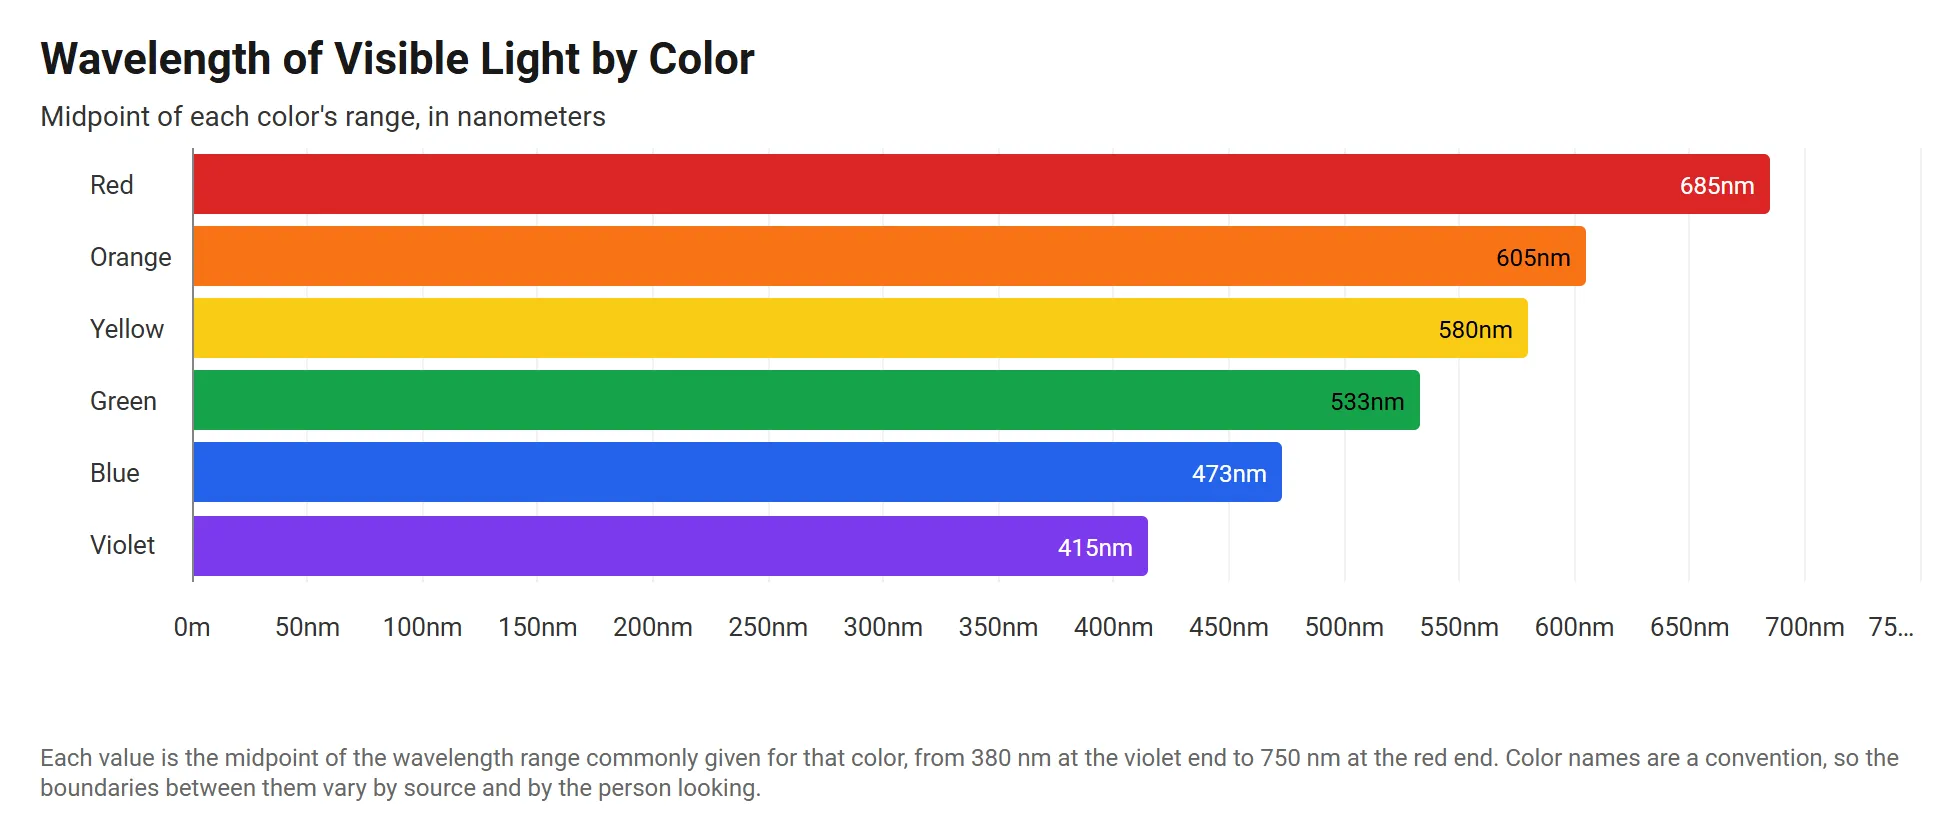 Horizontal Stacked Bar Chart
Visible Light Wavelengths by Color
The wavelength of each color in the visible spectrum, in meters, drawn as horizontal bars from violet to red.
View template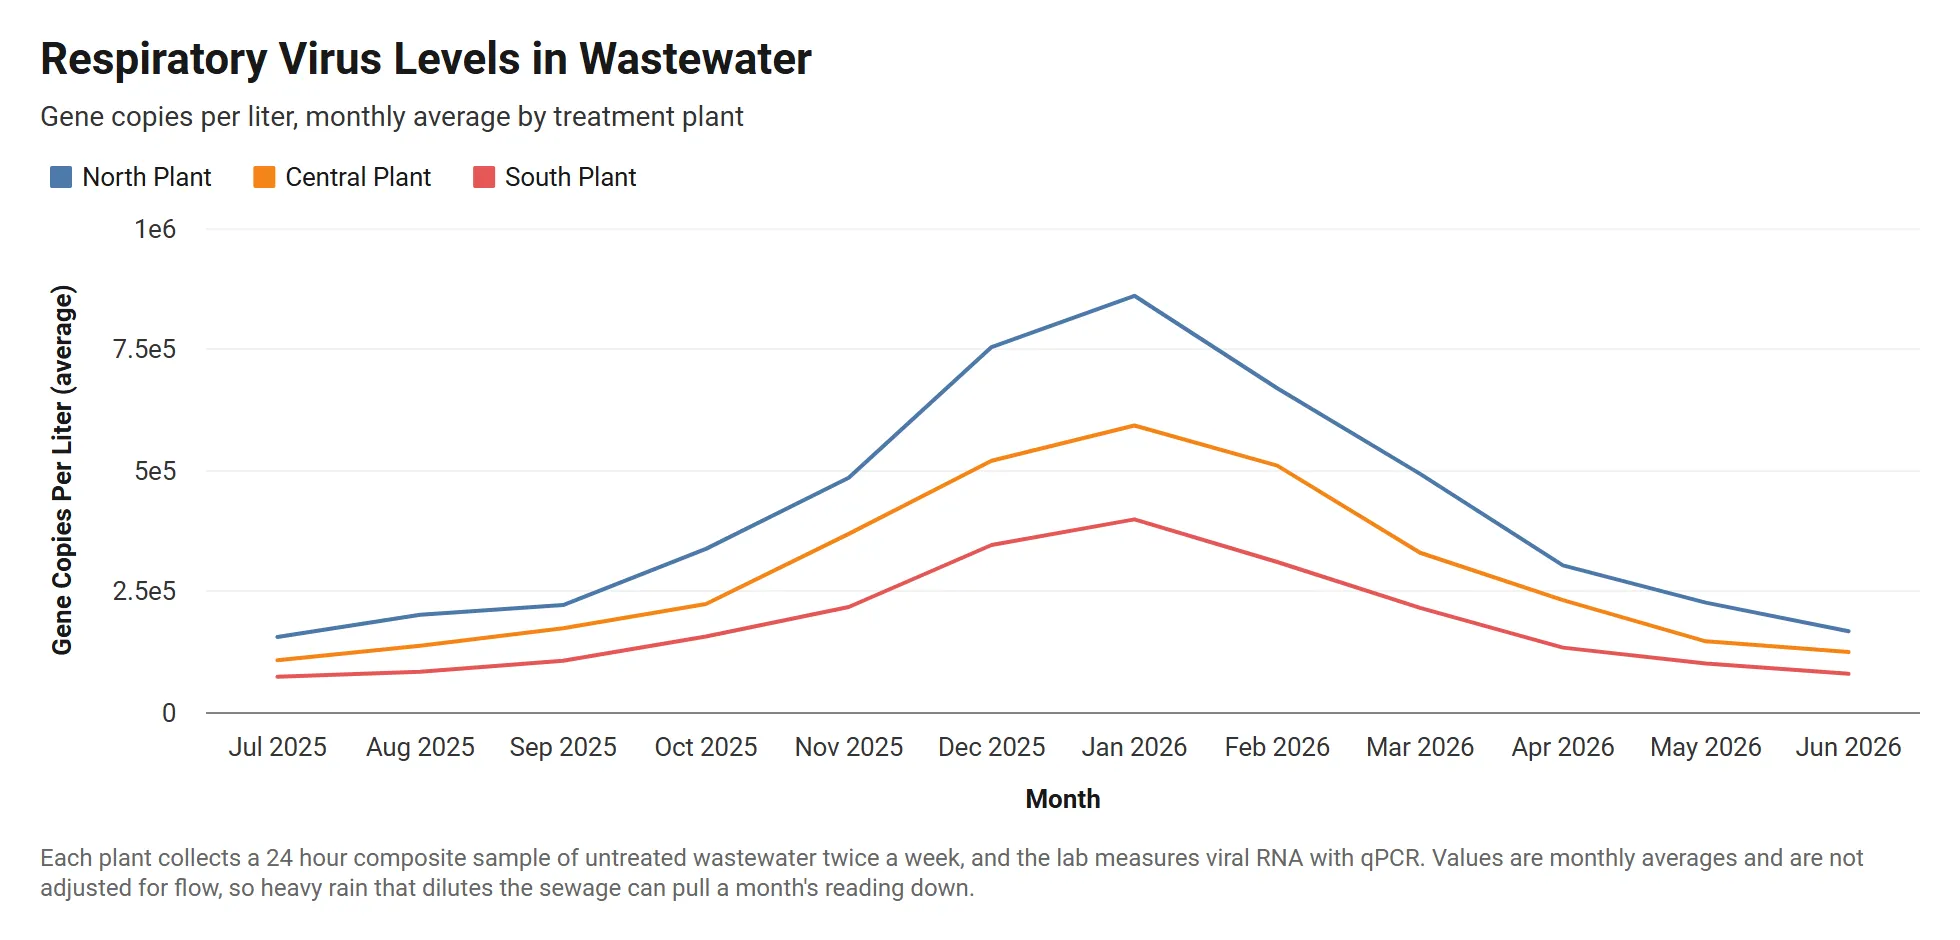 Grouped Line Chart
Wastewater Viral Load by Treatment Plant
Monthly respiratory virus levels in wastewater at three treatment plants, in gene copies per liter written in scientific notation.
View templateTemplates for other industries
Craft professional charts in seconds
InstaCharts makes data visualization easy, so you can build clear reports without design experience.