
Visible Light Spectrum Chart Template
The wavelength of each color in the visible spectrum, in meters, drawn as horizontal bars from violet to red.
Show the wavelength of each color of visible light in one horizontal bar chart. Each bar is drawn in its own color and labeled in nanometers, from violet at 415 nm to red at 685 nm.
- 6 sample rows
- 3 columns
- Export, share or embed
Visible Light Wavelengths by Color
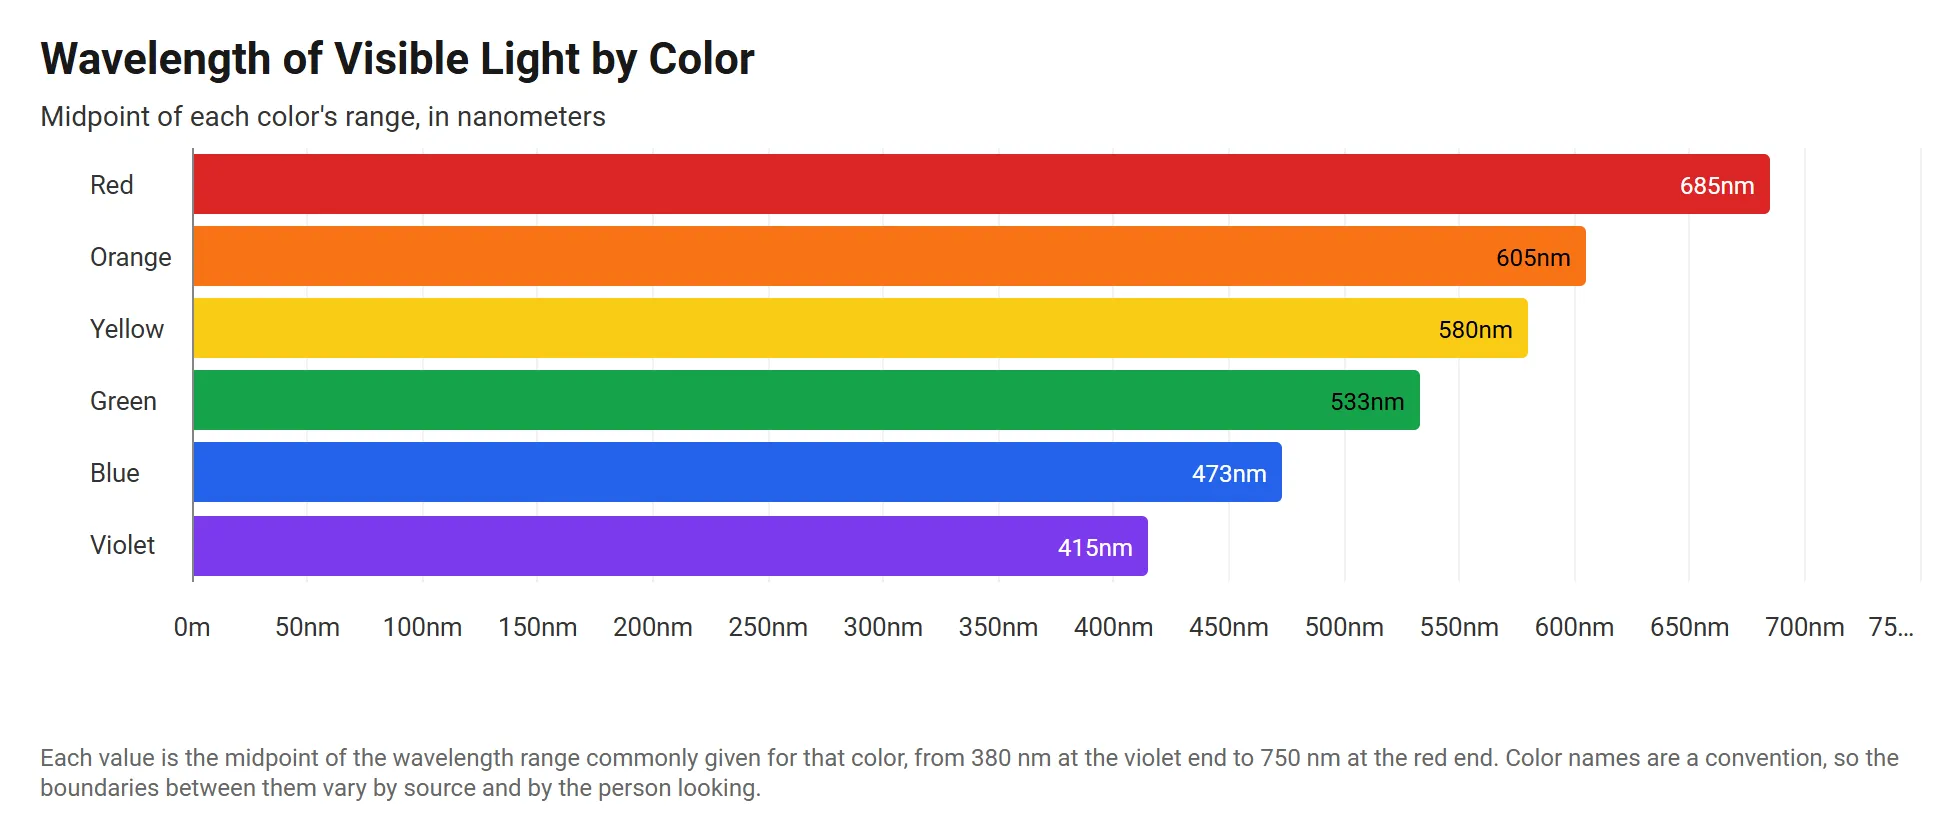
A live horizontal stacked bar chart drawn from the sample data below. Click Edit this template to change it.
About this template
What the visible light wavelengths by color chart shows
The sample uses the midpoint of the range commonly given for each color. Violet sits at 415 nm, green at 533 nm and red at 685 nm, so red light has a wavelength about 1.65 times longer than violet.
The wavelengths are stored in meters, such as 4.15e-7. The axis uses the Auto metric abbreviation with an m suffix, which writes each value in nanometers.
About the sample data
Each value is the midpoint of the wavelength range commonly given for that color, from 380 nm at the violet end to 750 nm at the red end. Color names are a convention, so the boundaries between them vary by source and by the person looking.
Sample data
Sample data for the visible light wavelengths by color template
The template loads these 6 rows. Keep the same columns, replace the rows with your own numbers, and the horizontal stacked bar chart redraws to match.
Color
Categories
Wavelength Range
Kept in the sheet for other charts
Wavelength (m)
Values
| Color | Wavelength Range | Wavelength (m) |
|---|---|---|
| Violet | 380 to 450 nm | 4.15e-7 |
| Blue | 450 to 495 nm | 4.73e-7 |
| Green | 495 to 570 nm | 5.33e-7 |
| Yellow | 570 to 590 nm | 5.80e-7 |
| Orange | 590 to 620 nm | 6.05e-7 |
| Red | 620 to 750 nm | 6.85e-7 |
How to use it
How to adapt the visible light wavelengths by color template
- 1 Click Edit this template to open the chart and its sample data in the InstaCharts chart maker. No account is needed.
- 2 Use one row per color with its wavelength in meters, or enter nanometers directly and use nm as the axis suffix.
- 3 Pick each bar's color under Customize Colors with Keep color with label, so each color stays with its name when the sort changes.
- 4 Add a frequency column and chart it on the value axis to compare frequency instead of wavelength.
- 5 Turn off the legend when the bar labels already name each color.
- 6 Download the chart as a PNG, SVG or PDF, share it with a link, or embed it on a website. Sign up free to save it.
FAQ
Visible Light Wavelengths by Color template FAQ
What is the wavelength range of visible light?
Visible light runs from about 380 nanometers at the violet end to about 750 nanometers at the red end. The template charts the midpoint of each color's range.
How do I show small numbers like 4.15e-7 as nanometers?
Turn off Auto Format under Number Formatting and turn on Customize for the axis. Set Abbreviate to Auto metric and type m as the suffix, and 4.15e-7 shows as 415nm.
Is this chart template free?
Yes. Click Edit this template to open it in the InstaCharts chart maker with no account needed. Sign up free to save the chart, share it with a link or embed it on a website.
How do I use my own data with this template?
Open the template in the chart maker, then paste in your own spreadsheet or upload a CSV or Excel file with the same kind of columns. The new chart keeps this template's horizontal stacked bar chart type, and you can pick which columns go on each axis.
Learn more about this chart type on the stacked bar chart maker page.
More templates
Related chart templates
 Grouped Scatter Plot
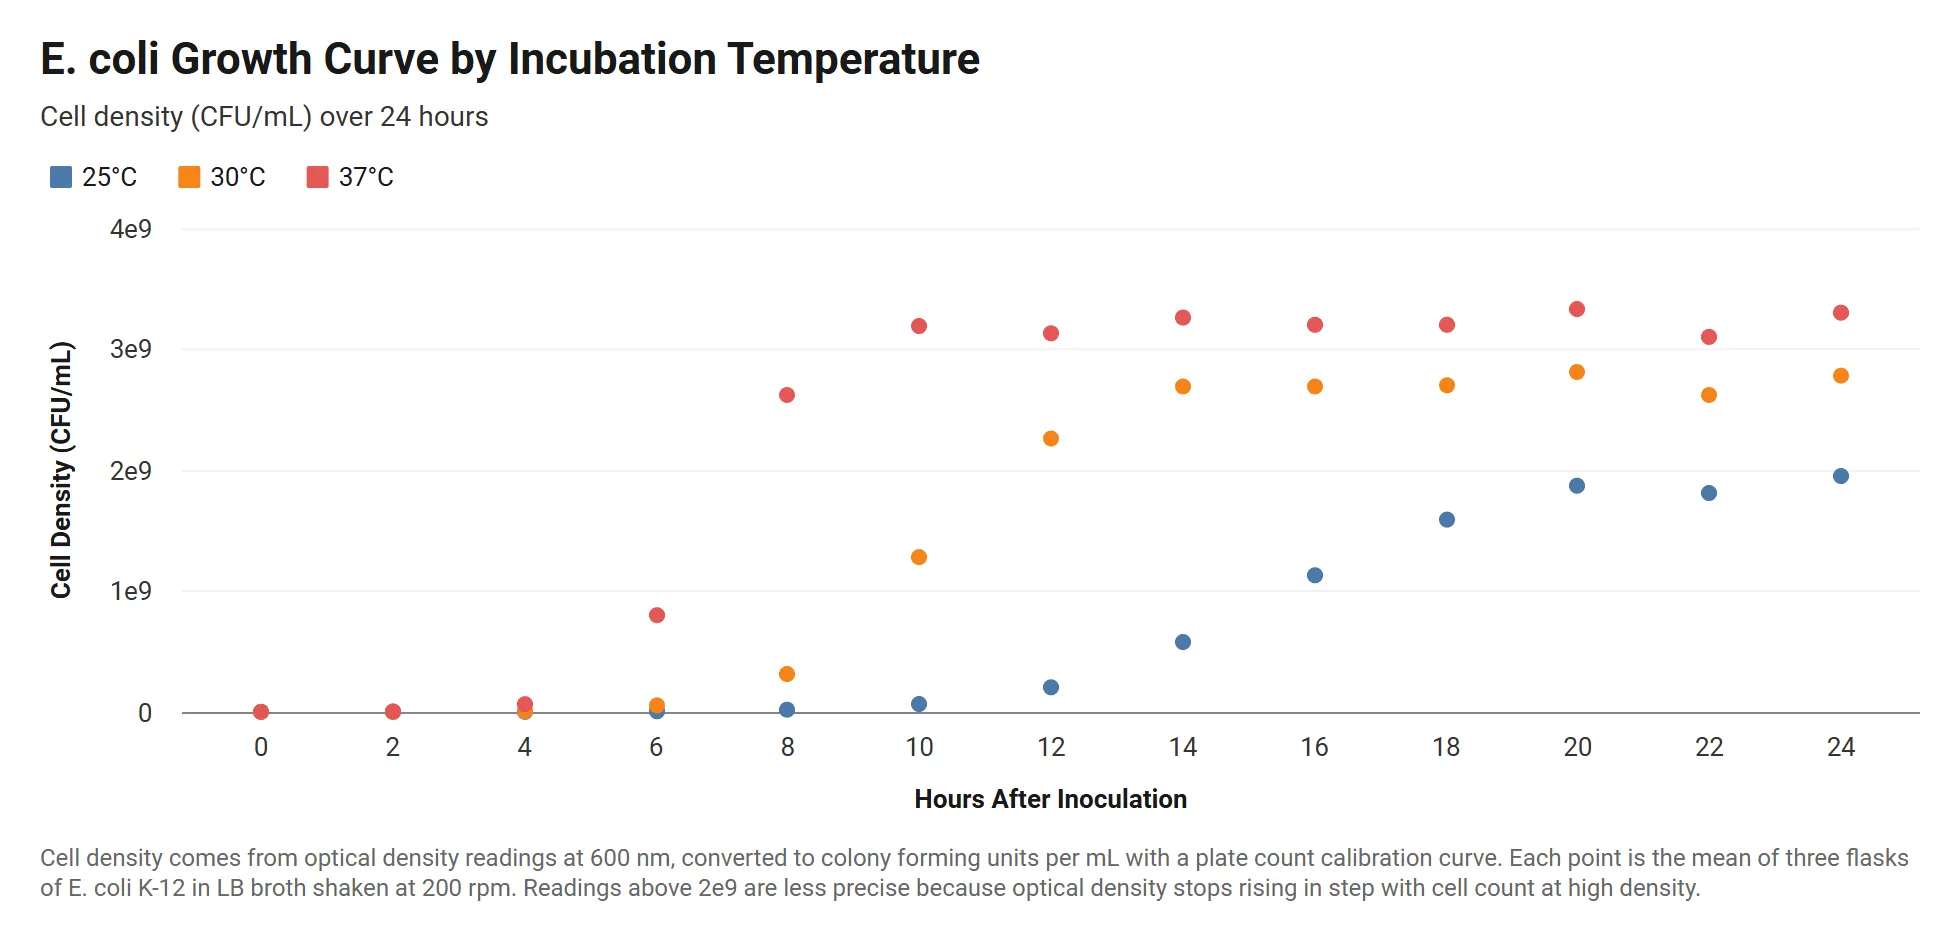
Bacterial Growth Curve by Temperature
E. coli cell density over 24 hours at three incubation temperatures, with readings written in scientific notation.
View template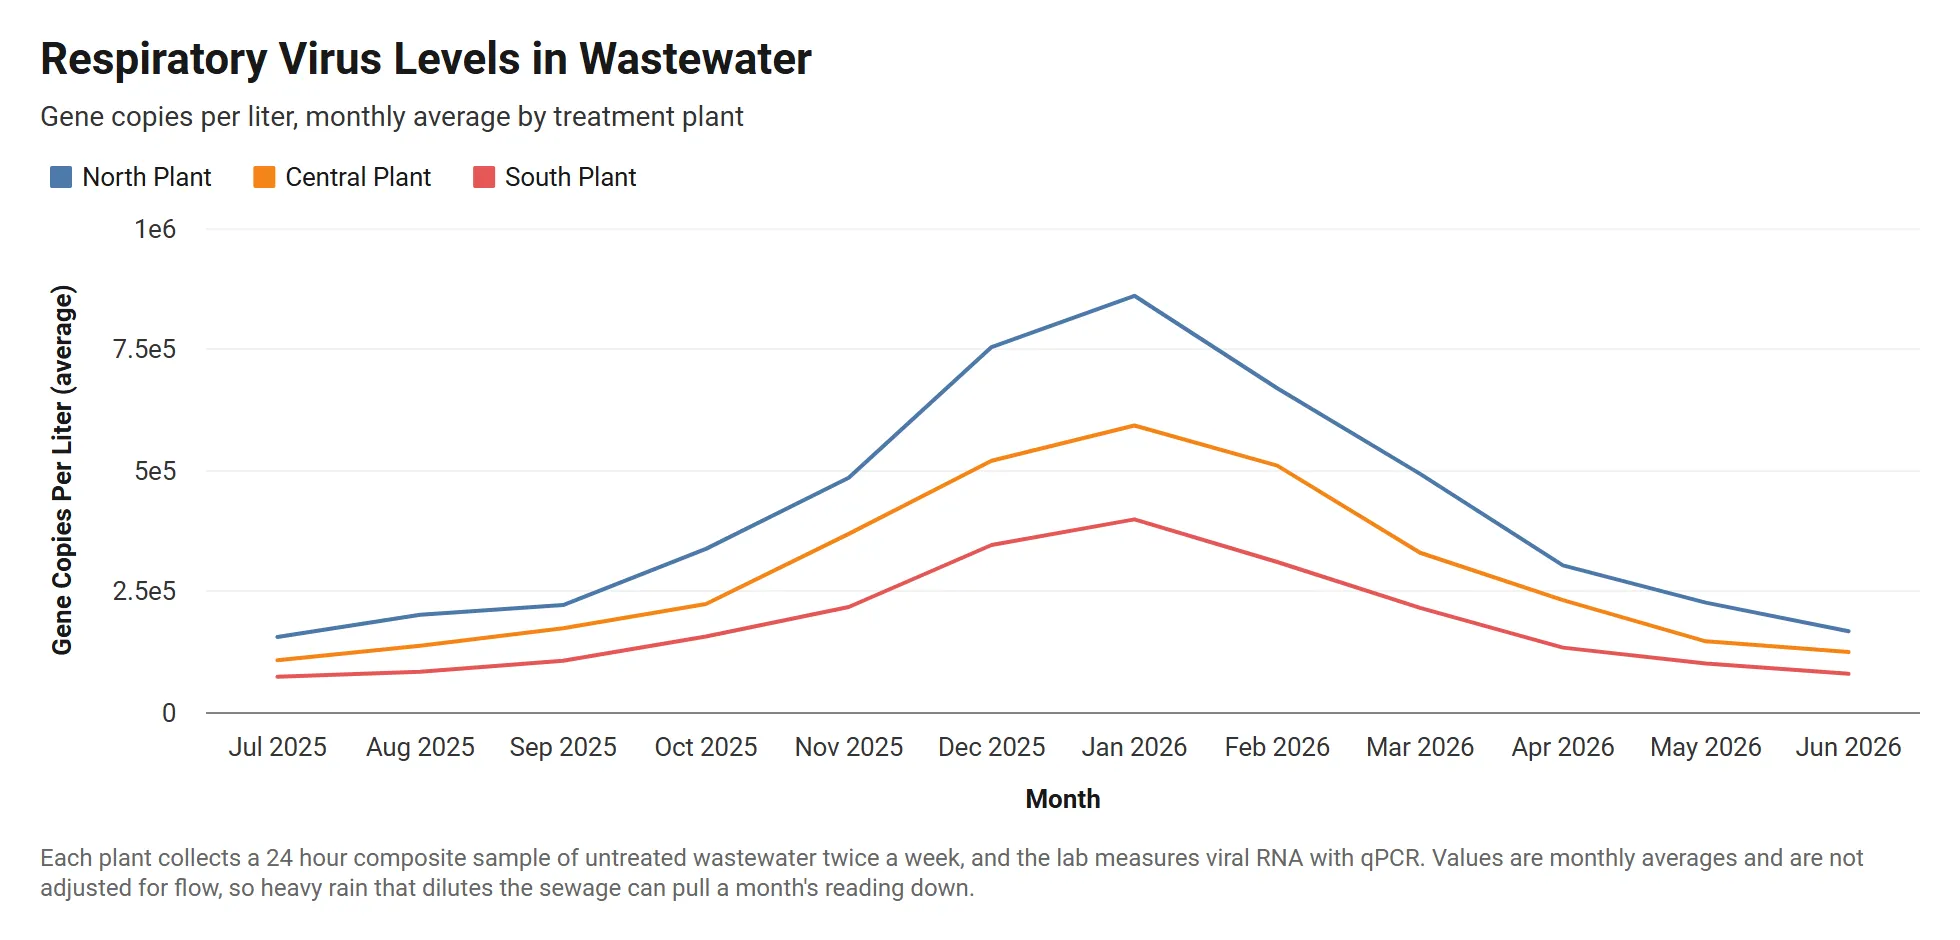 Grouped Line Chart
Wastewater Viral Load by Treatment Plant
Monthly respiratory virus levels in wastewater at three treatment plants, in gene copies per liter written in scientific notation.
View template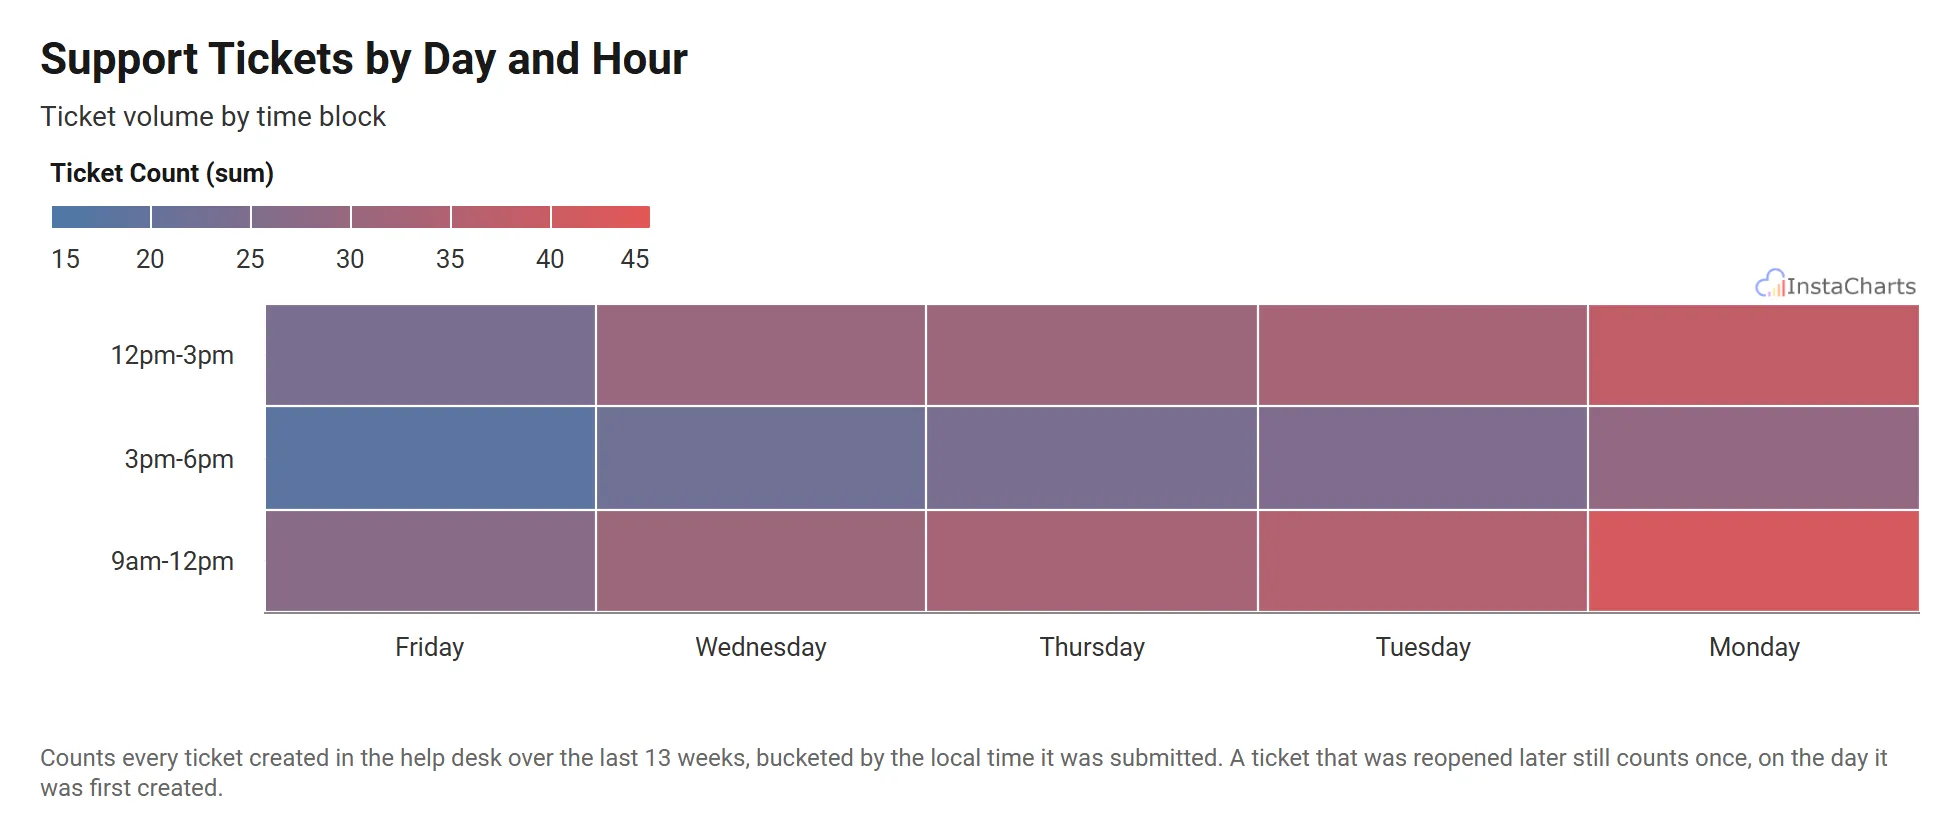 Heatmap
Support Tickets by Day and Hour
Customer support ticket volume by day of the week and time block.
View template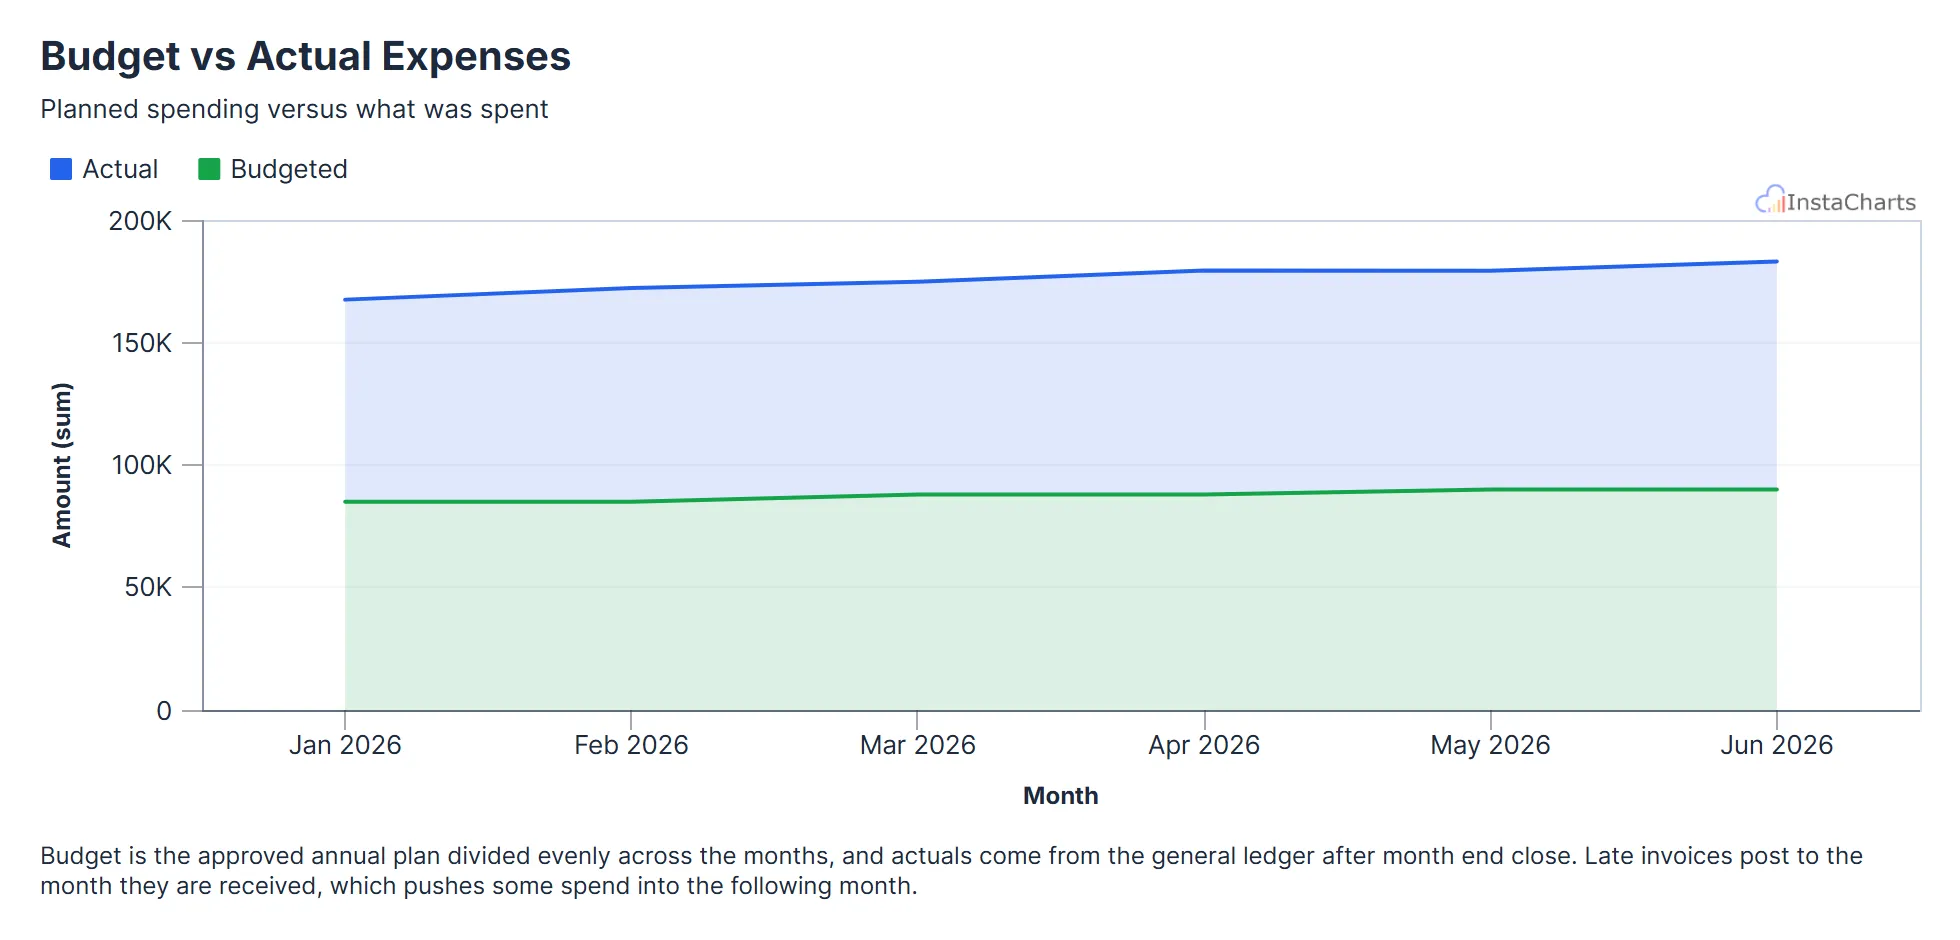 Grouped Area Chart
Budget vs Actual Expenses
Budgeted and actual expenses by month, useful for tracking spending against a plan.
View template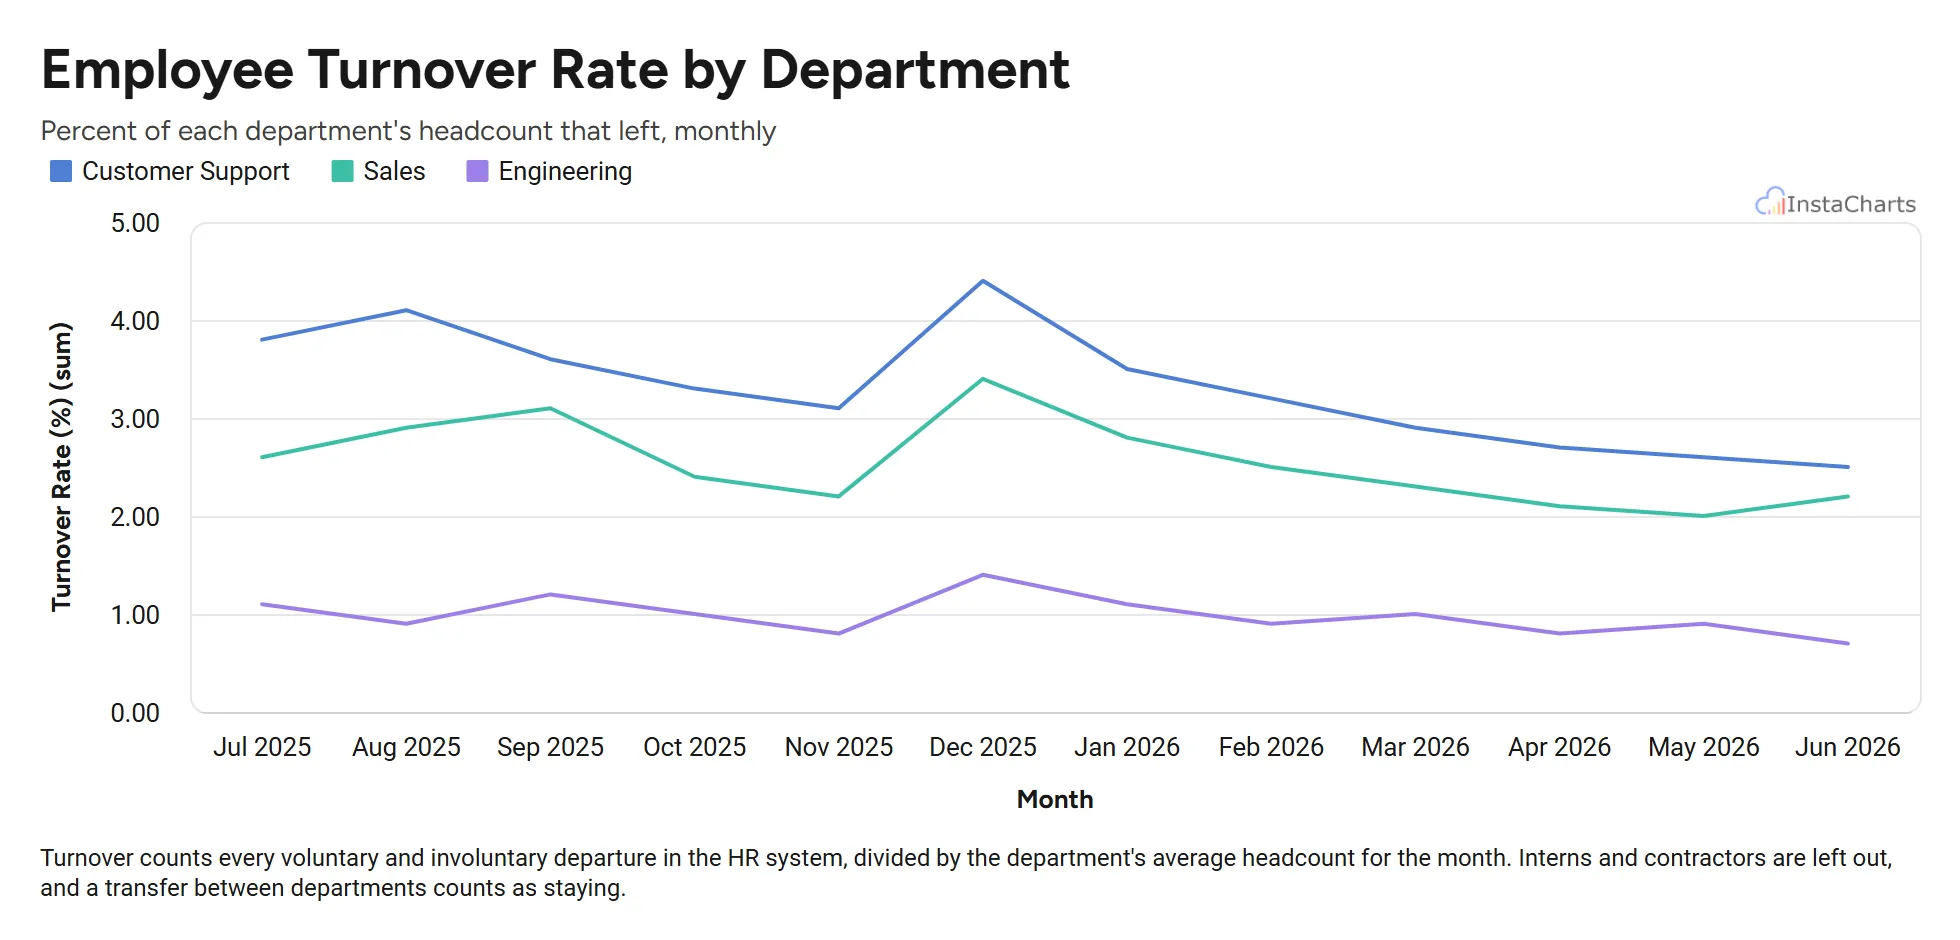 Grouped Line Chart
Employee Turnover by Department
Monthly employee turnover rate for sales, engineering and customer support over twelve months.
View template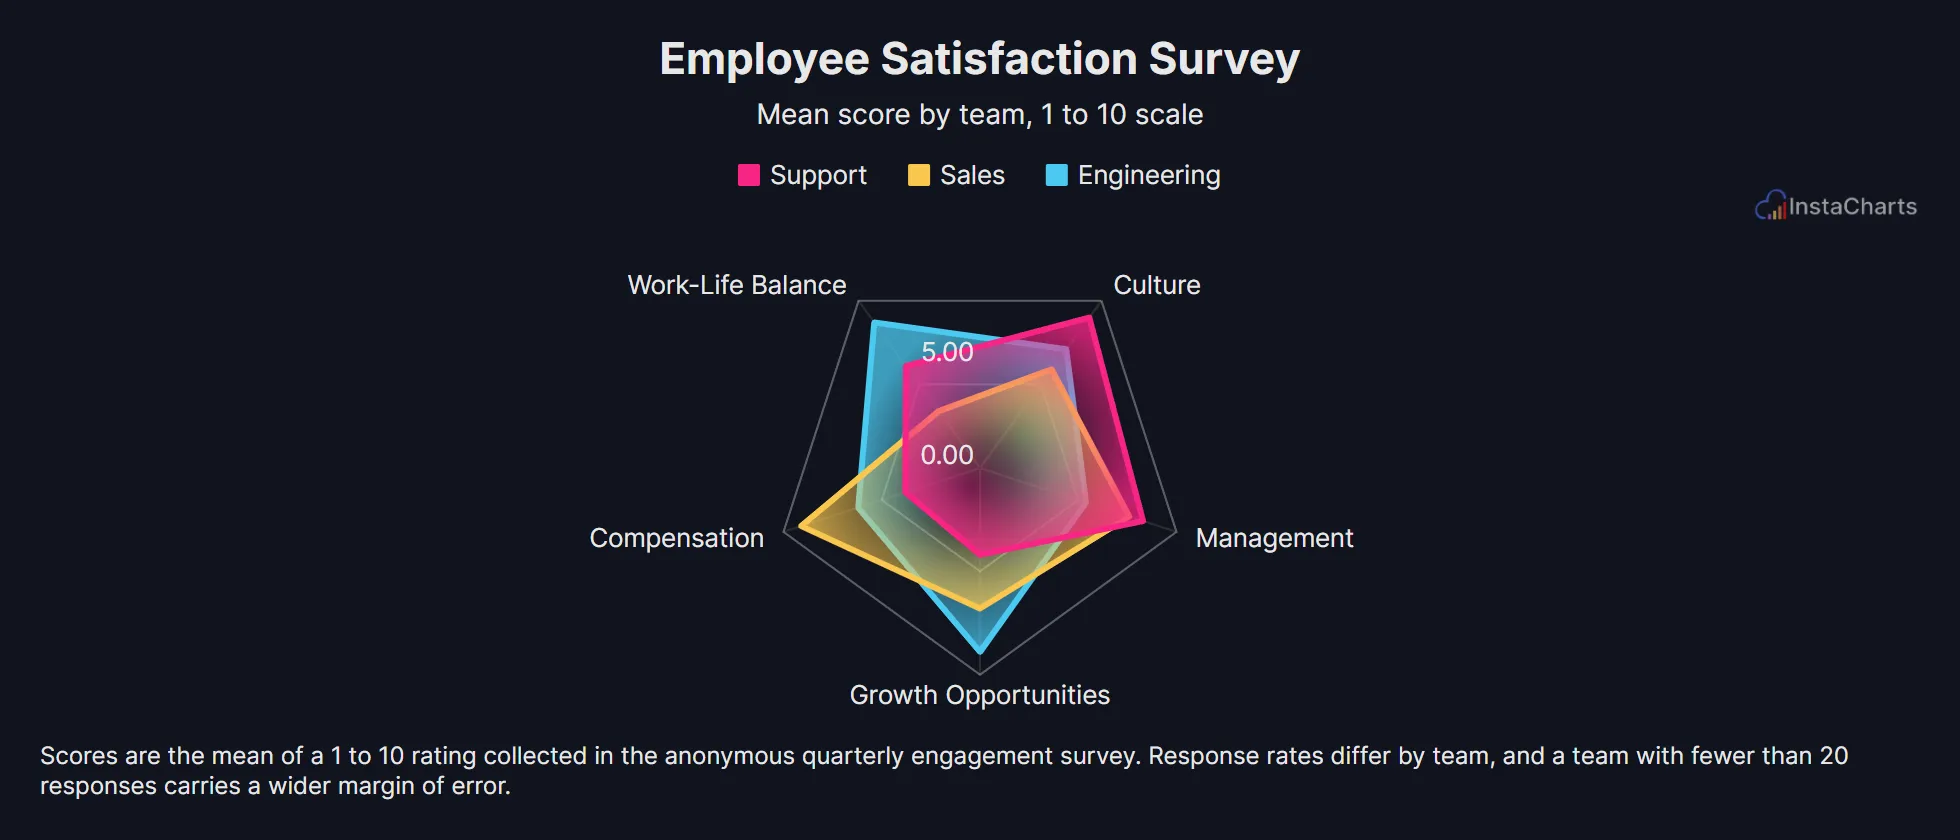 Radar Chart
Employee Satisfaction Survey
Survey scores across compensation, work-life balance, management, growth and culture for three teams.
View templateSee all Science Chart Templates, or browse all chart templates.
Make your own horizontal stacked bar chart in seconds
InstaCharts makes data visualization easy, so you can build clear reports without design experience.