
Wastewater Surveillance Chart Template
Monthly respiratory virus levels in wastewater at three treatment plants, in gene copies per liter written in scientific notation.
Track respiratory virus levels in wastewater at several treatment plants on one line chart. The template plots twelve months of monthly averages in gene copies per liter, written in scientific notation.
- 36 sample rows
- 3 columns
- Export, share or embed
Wastewater Viral Load by Treatment Plant
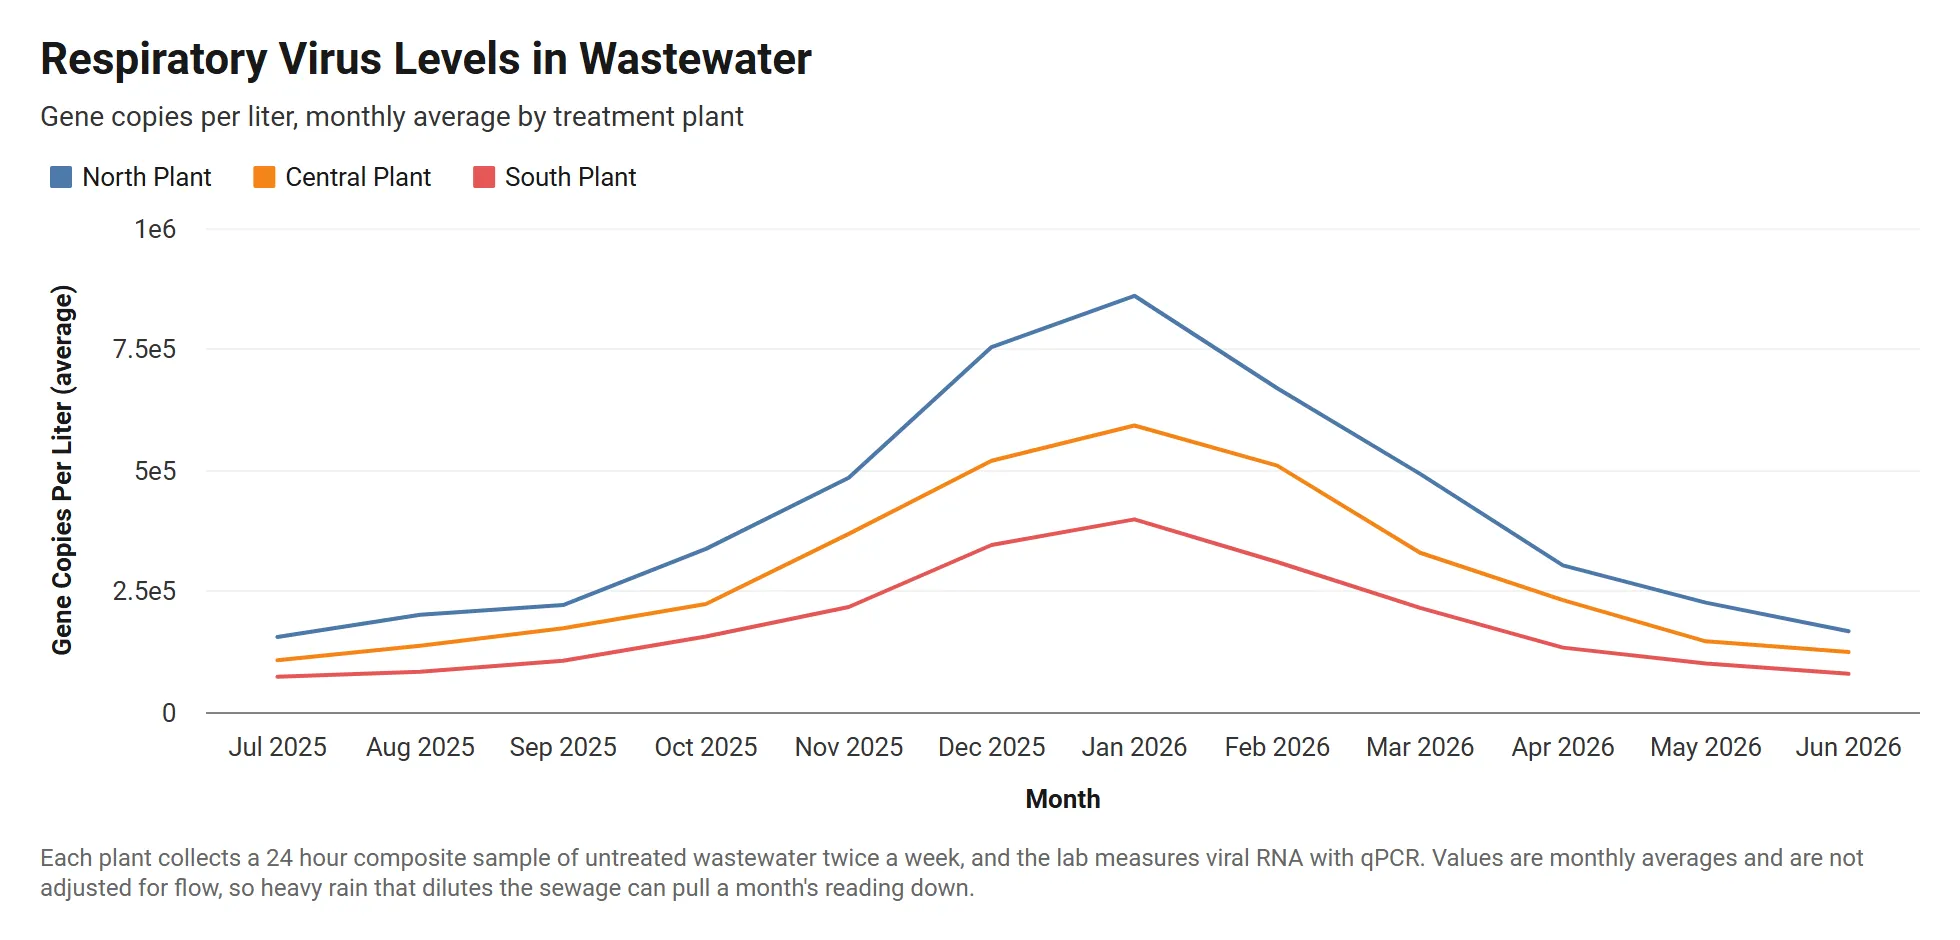
A live grouped line chart drawn from the sample data below. Click Edit this template to change it.
About this template
What the wastewater viral load by treatment plant chart shows
All three plants peak in January 2026. The North Plant rises from 1.55e5 gene copies per liter in July 2025 to 8.60e5 in January, about 5.5 times higher, and falls back to 1.67e5 by June 2026.
The South Plant stays lowest all year, from 7.30e4 in July to a peak of 3.98e5, so the grouped line chart shows the shared winter wave and the difference in levels between plants.
About the sample data
Each plant collects a 24 hour composite sample of untreated wastewater twice a week, and the lab measures viral RNA with qPCR. Values are monthly averages and are not adjusted for flow, so heavy rain that dilutes the sewage can pull a month's reading down.
Sample data
Sample data for the wastewater viral load by treatment plant template
The template loads these 36 rows. Keep the same columns, replace the rows with your own numbers, and the grouped line chart redraws to match.
Month
Time axis
Treatment Plant
Breakdown, one color per value
Gene Copies per Liter
Values
| Month | Treatment Plant | Gene Copies per Liter |
|---|---|---|
| 2025-07-01 | North Plant | 1.55e5 |
| 2025-08-01 | North Plant | 2.01e5 |
| 2025-09-01 | North Plant | 2.21e5 |
| 2025-10-01 | North Plant | 3.37e5 |
| 2025-11-01 | North Plant | 4.84e5 |
| 2025-12-01 | North Plant | 7.54e5 |
| 2026-01-01 | North Plant | 8.60e5 |
| 2026-02-01 | North Plant | 6.69e5 |
| 2026-03-01 | North Plant | 4.92e5 |
| 2026-04-01 | North Plant | 3.03e5 |
| 2026-05-01 | North Plant | 2.26e5 |
| 2026-06-01 | North Plant | 1.67e5 |
| 2025-07-01 | Central Plant | 1.07e5 |
| 2025-08-01 | Central Plant | 1.37e5 |
| 2025-09-01 | Central Plant | 1.73e5 |
| 2025-10-01 | Central Plant | 2.23e5 |
| 2025-11-01 | Central Plant | 3.68e5 |
| 2025-12-01 | Central Plant | 5.19e5 |
| 2026-01-01 | Central Plant | 5.92e5 |
| 2026-02-01 | Central Plant | 5.09e5 |
| 2026-03-01 | Central Plant | 3.29e5 |
| 2026-04-01 | Central Plant | 2.31e5 |
| 2026-05-01 | Central Plant | 1.46e5 |
| 2026-06-01 | Central Plant | 1.24e5 |
| 2025-07-01 | South Plant | 7.30e4 |
| 2025-08-01 | South Plant | 8.32e4 |
| 2025-09-01 | South Plant | 1.06e5 |
| 2025-10-01 | South Plant | 1.56e5 |
| 2025-11-01 | South Plant | 2.17e5 |
| 2025-12-01 | South Plant | 3.45e5 |
| 2026-01-01 | South Plant | 3.98e5 |
| 2026-02-01 | South Plant | 3.10e5 |
| 2026-03-01 | South Plant | 2.15e5 |
| 2026-04-01 | South Plant | 1.33e5 |
| 2026-05-01 | South Plant | 1.00e5 |
| 2026-06-01 | South Plant | 7.88e4 |
How to use it
How to adapt the wastewater viral load by treatment plant template
- 1 Click Edit this template to open the chart and its sample data in the InstaCharts chart maker. No account is needed.
- 2 Use one row per plant per month with the sampling date and the measured concentration.
- 3 Enter concentrations in scientific notation, such as 4.84e5, to keep the data table and the axis in the same notation.
- 4 Divide each concentration by the plant's daily flow in a new column to adjust for rain that dilutes the samples.
- 5 Connect a Google Sheet so the chart updates when the lab adds new results.
- 6 Download the chart as a PNG, SVG or PDF, share it with a link, or embed it on a website. Sign up free to save it.
FAQ
Wastewater Viral Load by Treatment Plant template FAQ
What does gene copies per liter mean?
It is the number of copies of a virus's genetic material the lab finds in one liter of wastewater. Higher values mean more virus is being shed by people in the area the plant serves.
Can I put this chart on a public health dashboard?
Yes. Add the chart to an InstaCharts dashboard with other charts and KPI numbers, or embed it on your website and share it with a link.
Is this chart template free?
Yes. Click Edit this template to open it in the InstaCharts chart maker with no account needed. Sign up free to save the chart, share it with a link or embed it on a website.
How do I use my own data with this template?
Open the template in the chart maker, then paste in your own spreadsheet or upload a CSV or Excel file with the same kind of columns. The new chart keeps this template's grouped line chart type, and you can pick which columns go on each axis.
Learn more about this chart type on the grouped line chart maker page.
More templates
Related chart templates
 Grouped Scatter Plot
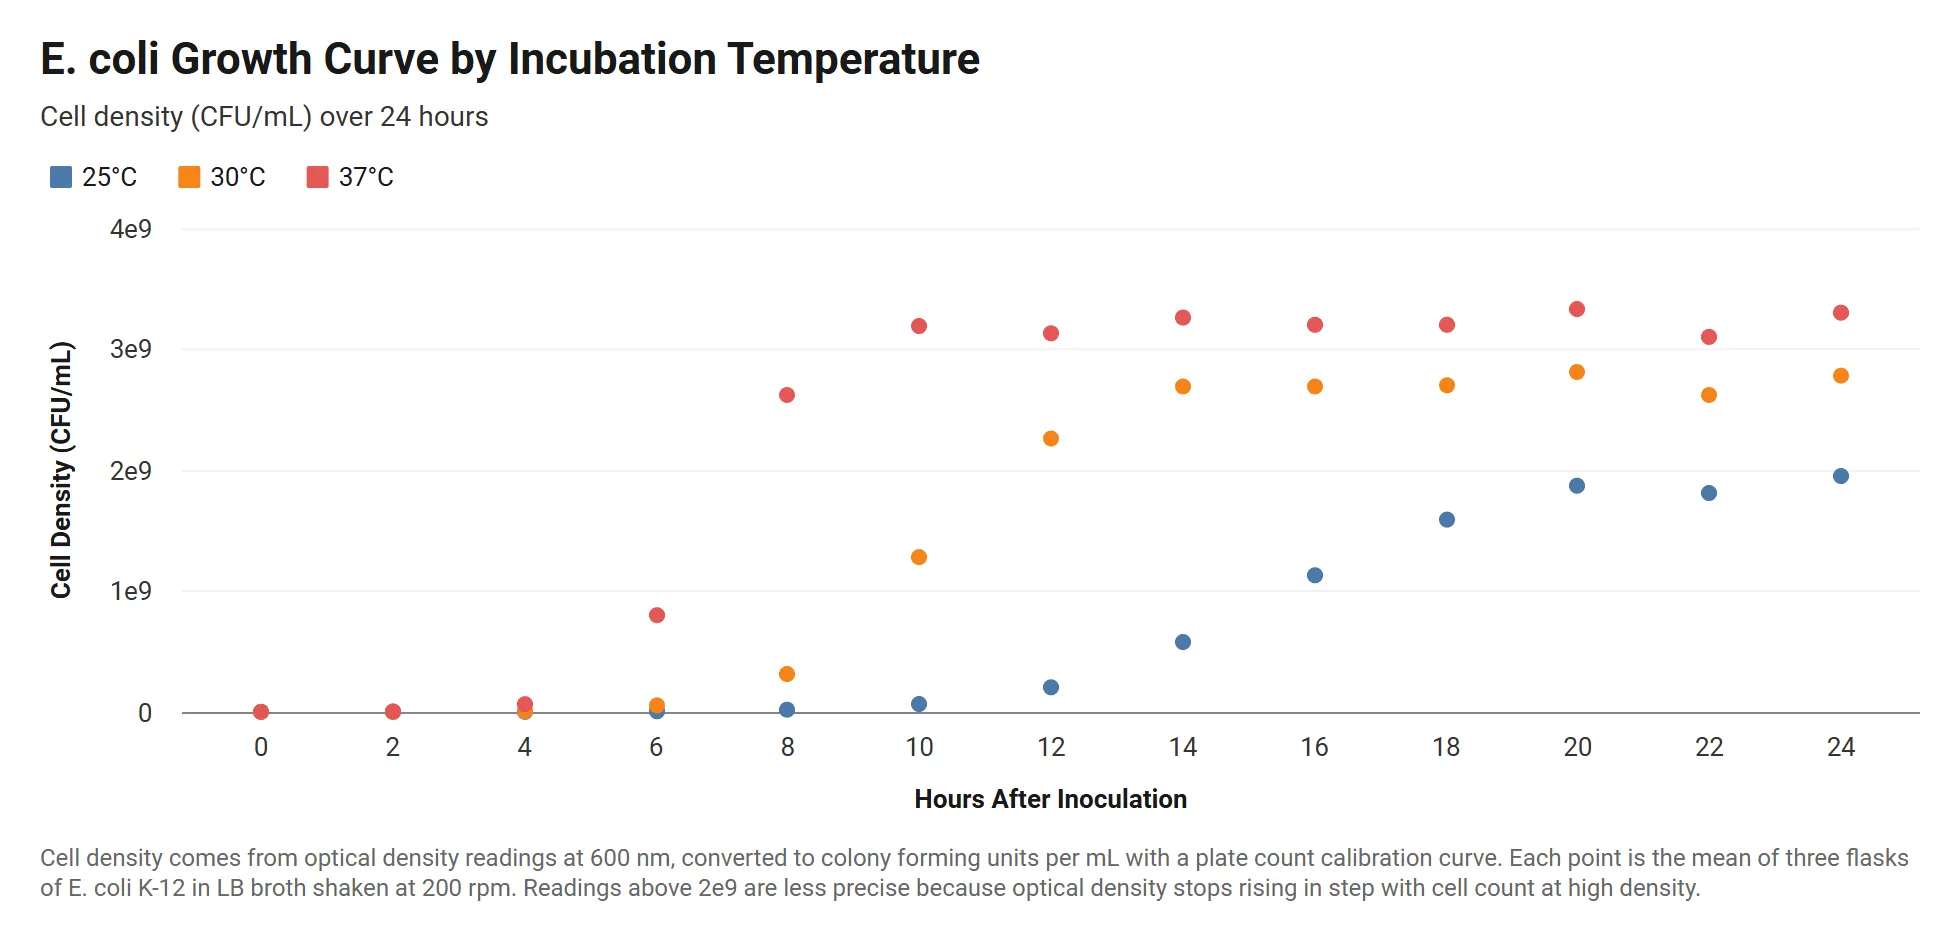
Bacterial Growth Curve by Temperature
E. coli cell density over 24 hours at three incubation temperatures, with readings written in scientific notation.
View template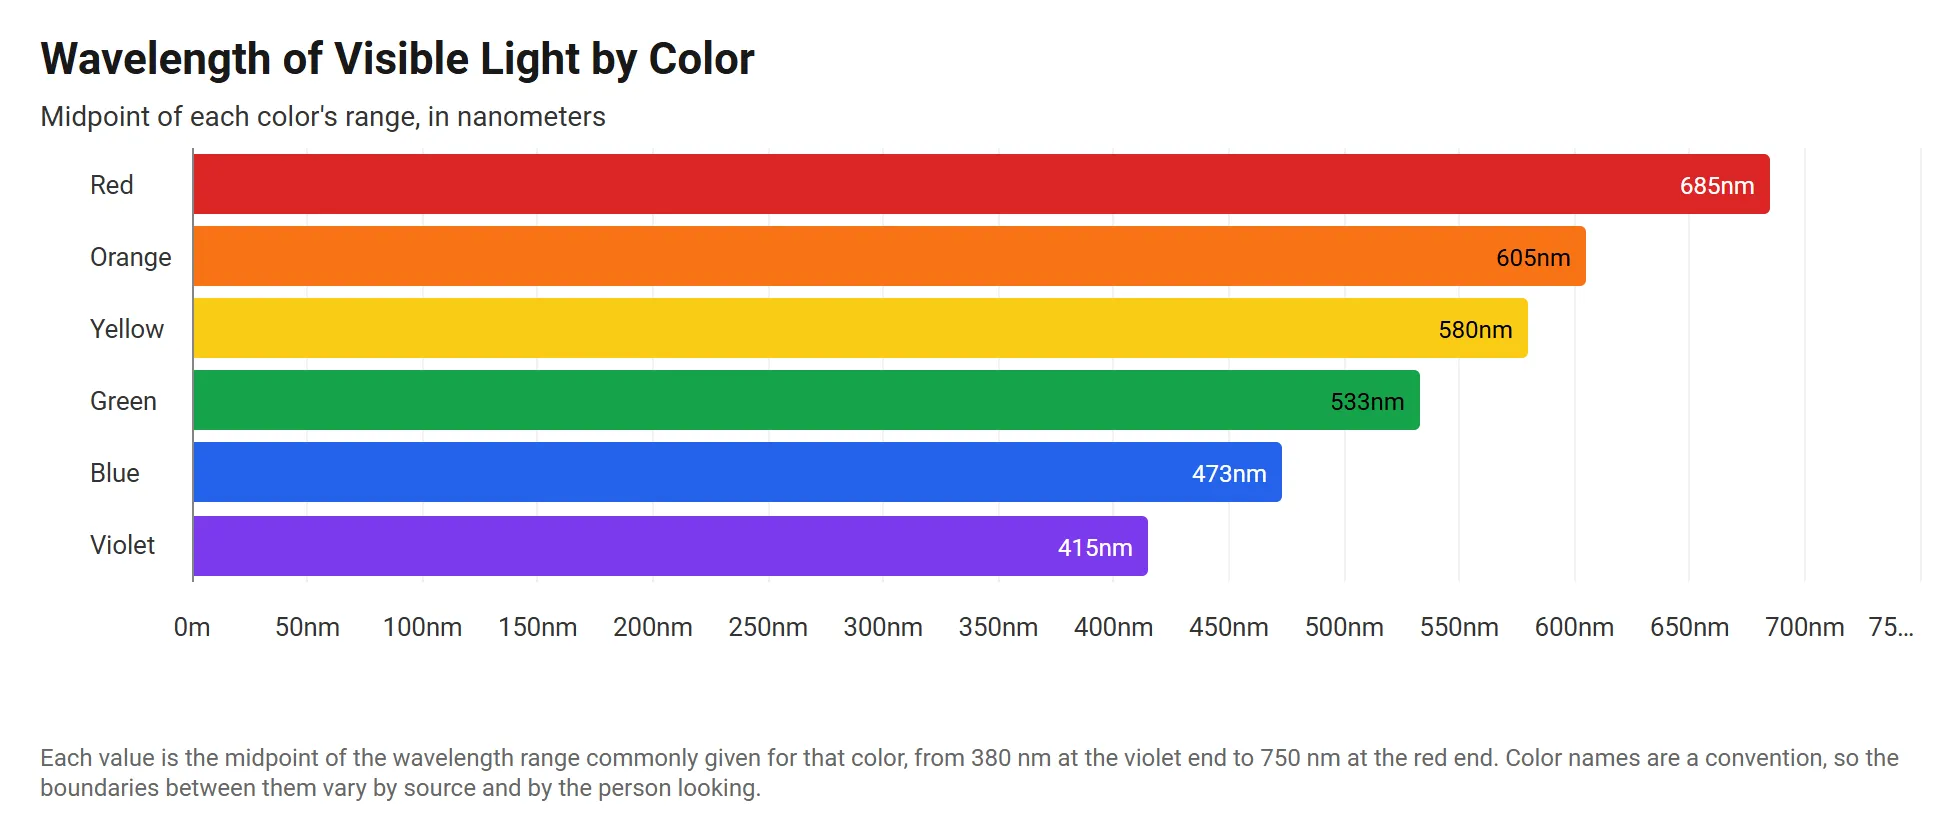 Horizontal Stacked Bar Chart
Visible Light Wavelengths by Color
The wavelength of each color in the visible spectrum, in meters, drawn as horizontal bars from violet to red.
View template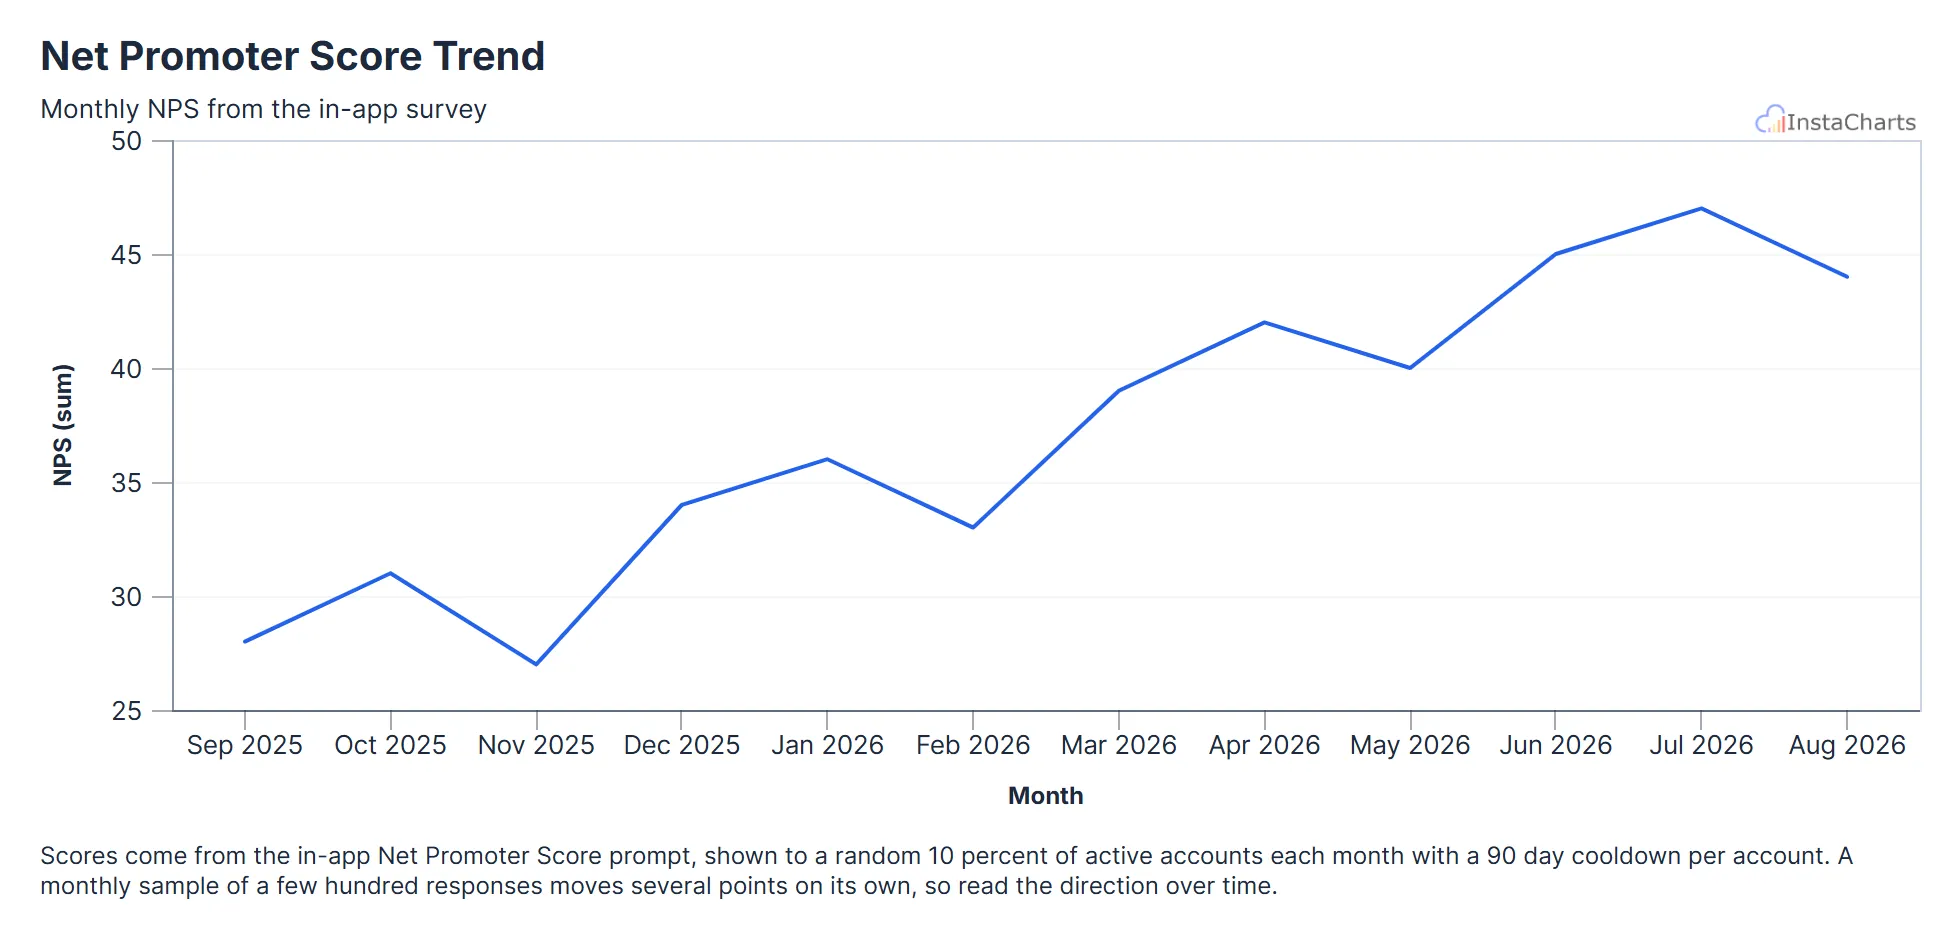 Line Chart
Net Promoter Score Trend
Net Promoter Score from the in-app survey for each month over the last year.
View template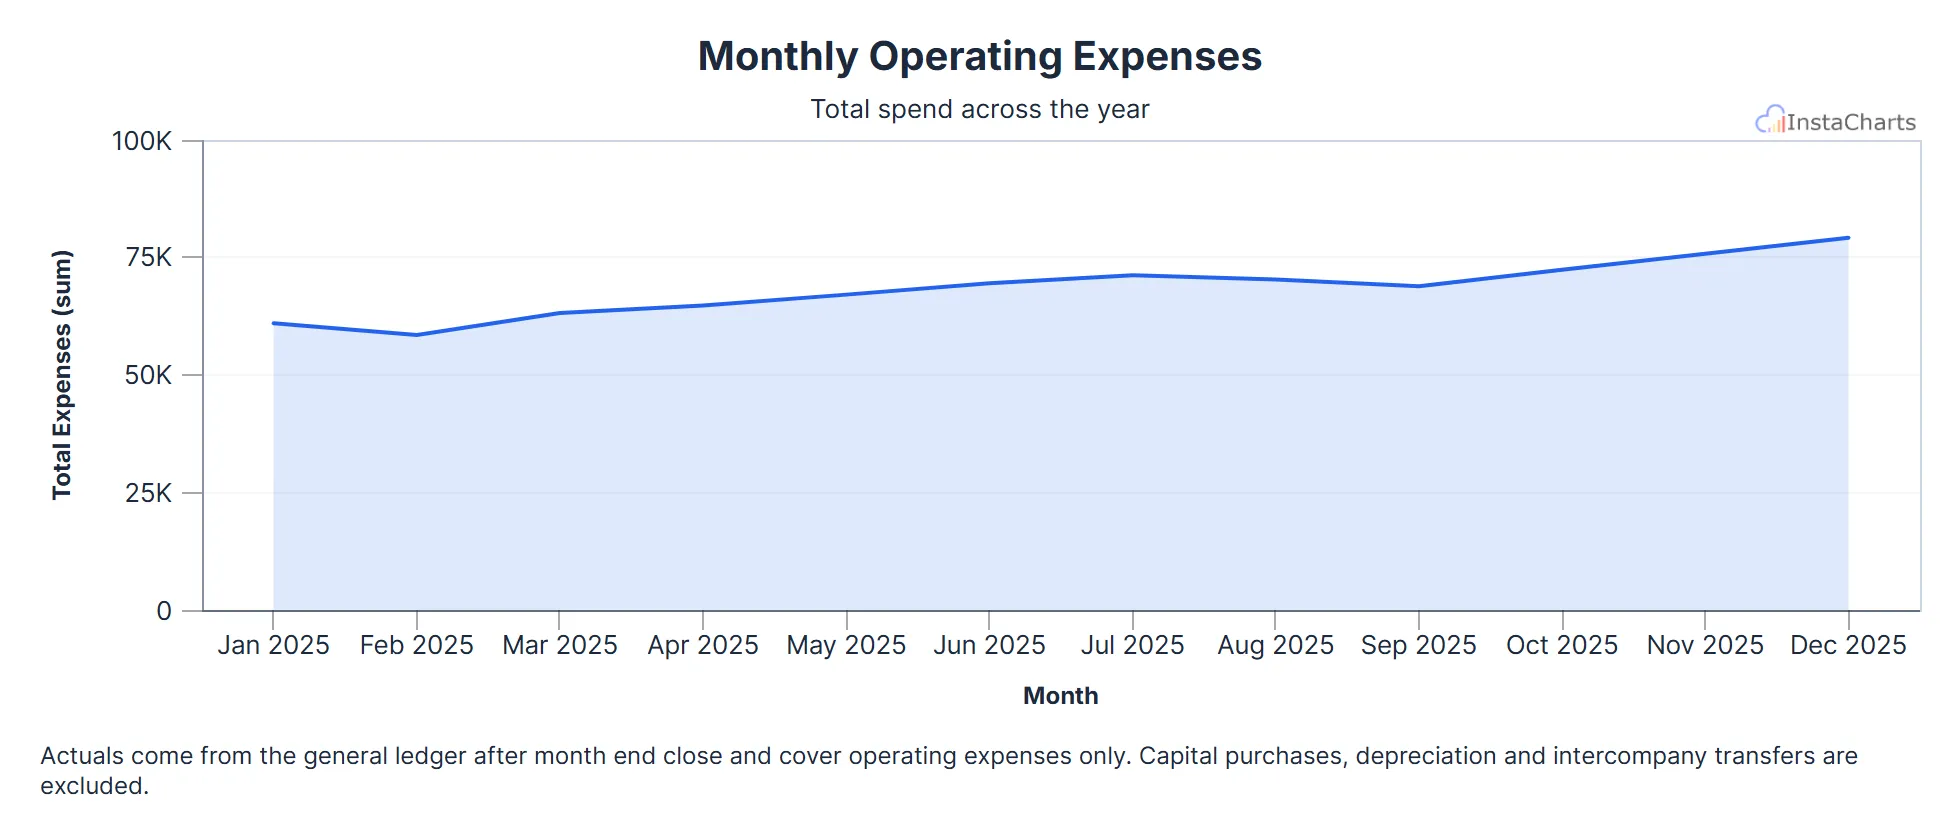 Area Chart
Monthly Operating Expenses
Total operating expenses for each month over a full year.
View template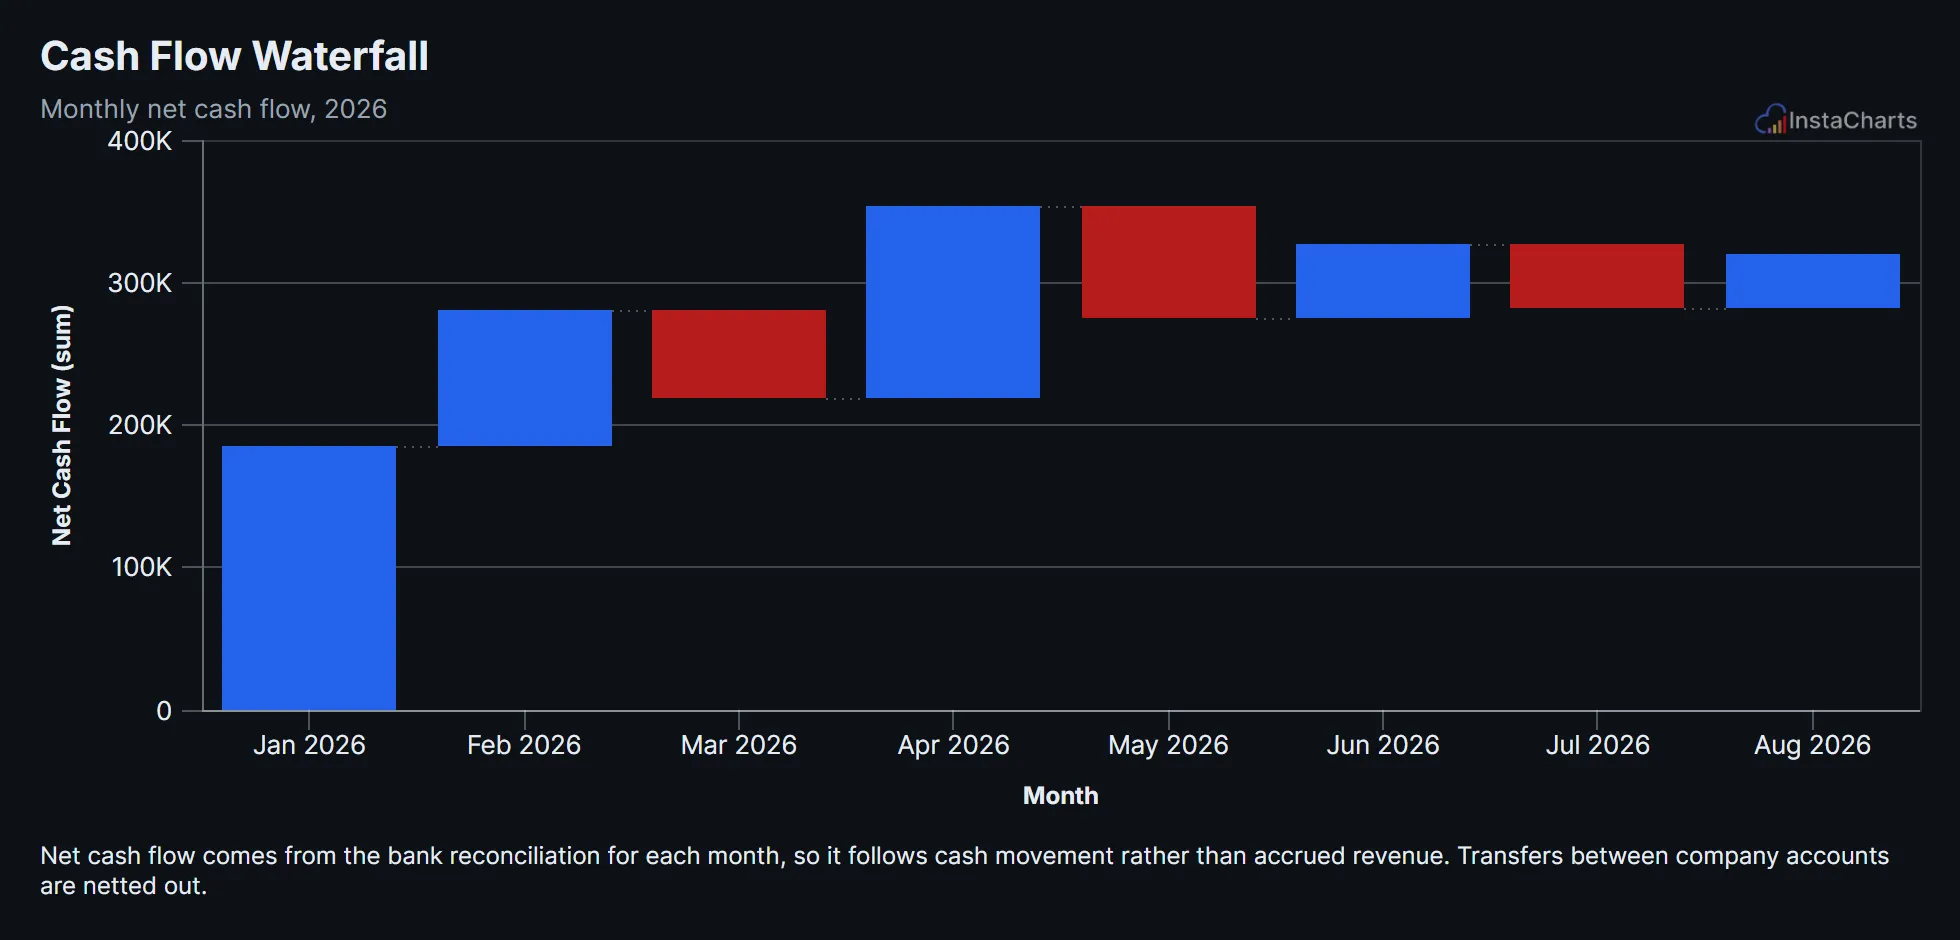 Waterfall Chart
Cash Flow Waterfall
Net cash flow for each month of the year, shown as a waterfall of rises and drops building toward the ending balance.
View template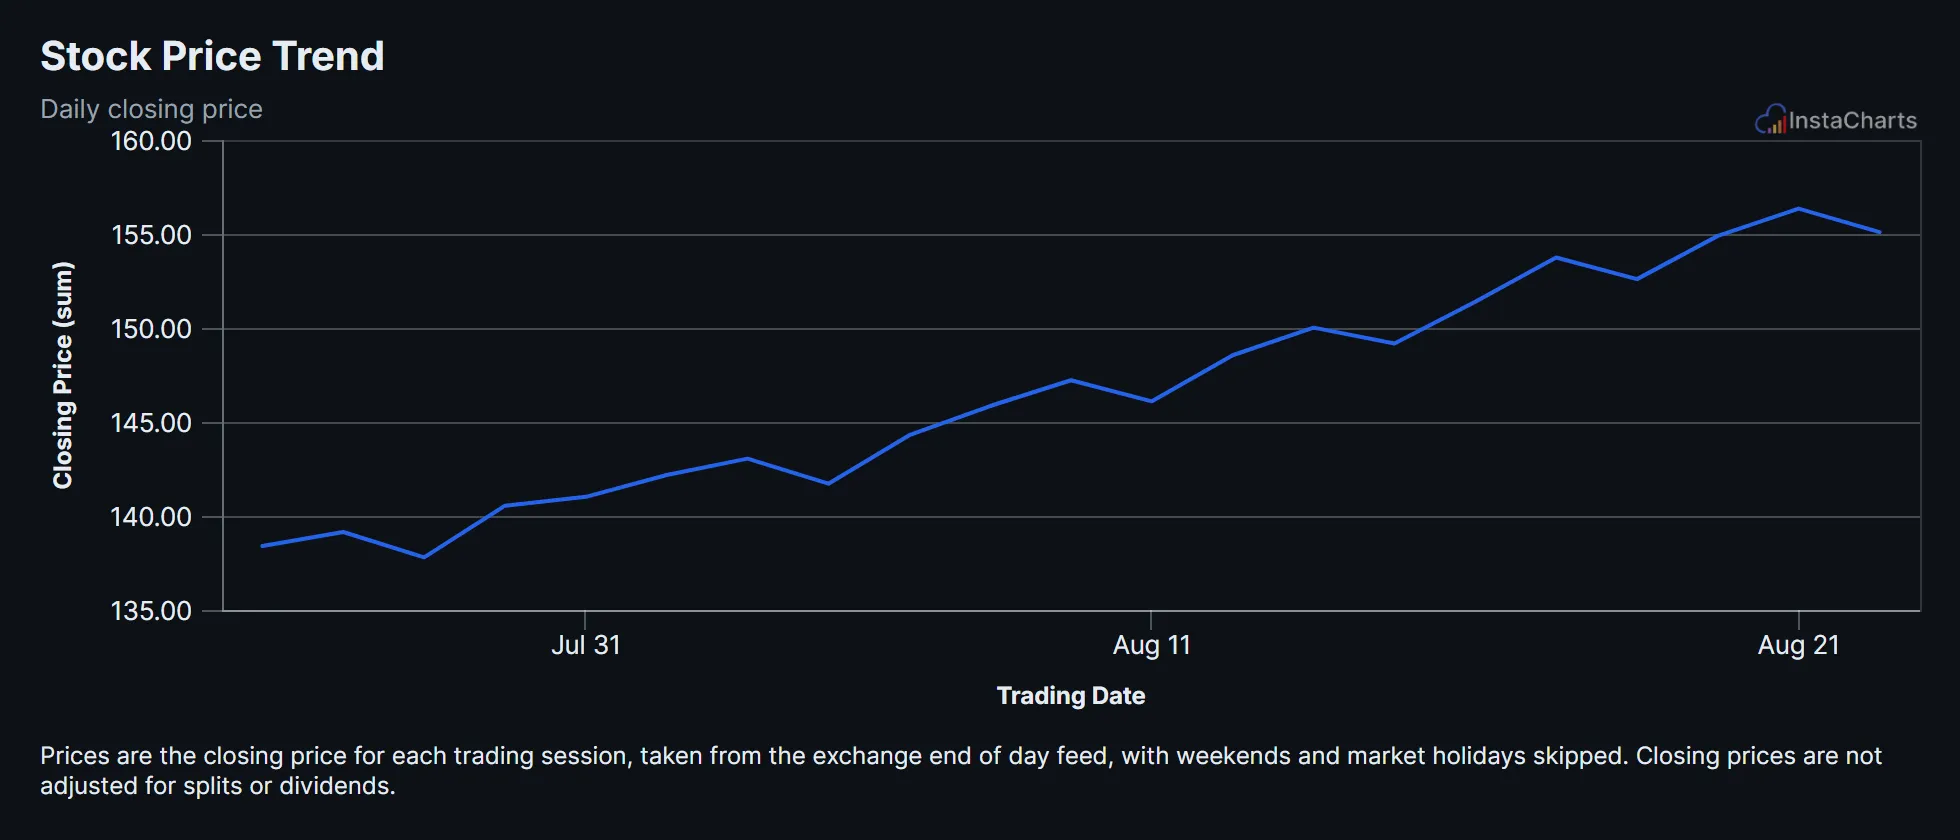 Line Chart
Stock Price Trend
Daily closing price for a sample stock ticker over several weeks of trading.
View templateSee all Science Chart Templates, or browse all chart templates.
Make your own grouped line chart in seconds
InstaCharts makes data visualization easy, so you can build clear reports without design experience.