
Claude and ChatGPT
Make charts in Claude and ChatGPT from any spreadsheet
Connect InstaCharts to your AI assistant and turn CSV, Excel and Google Sheets data into interactive charts you can edit, share with a link and embed on your website.
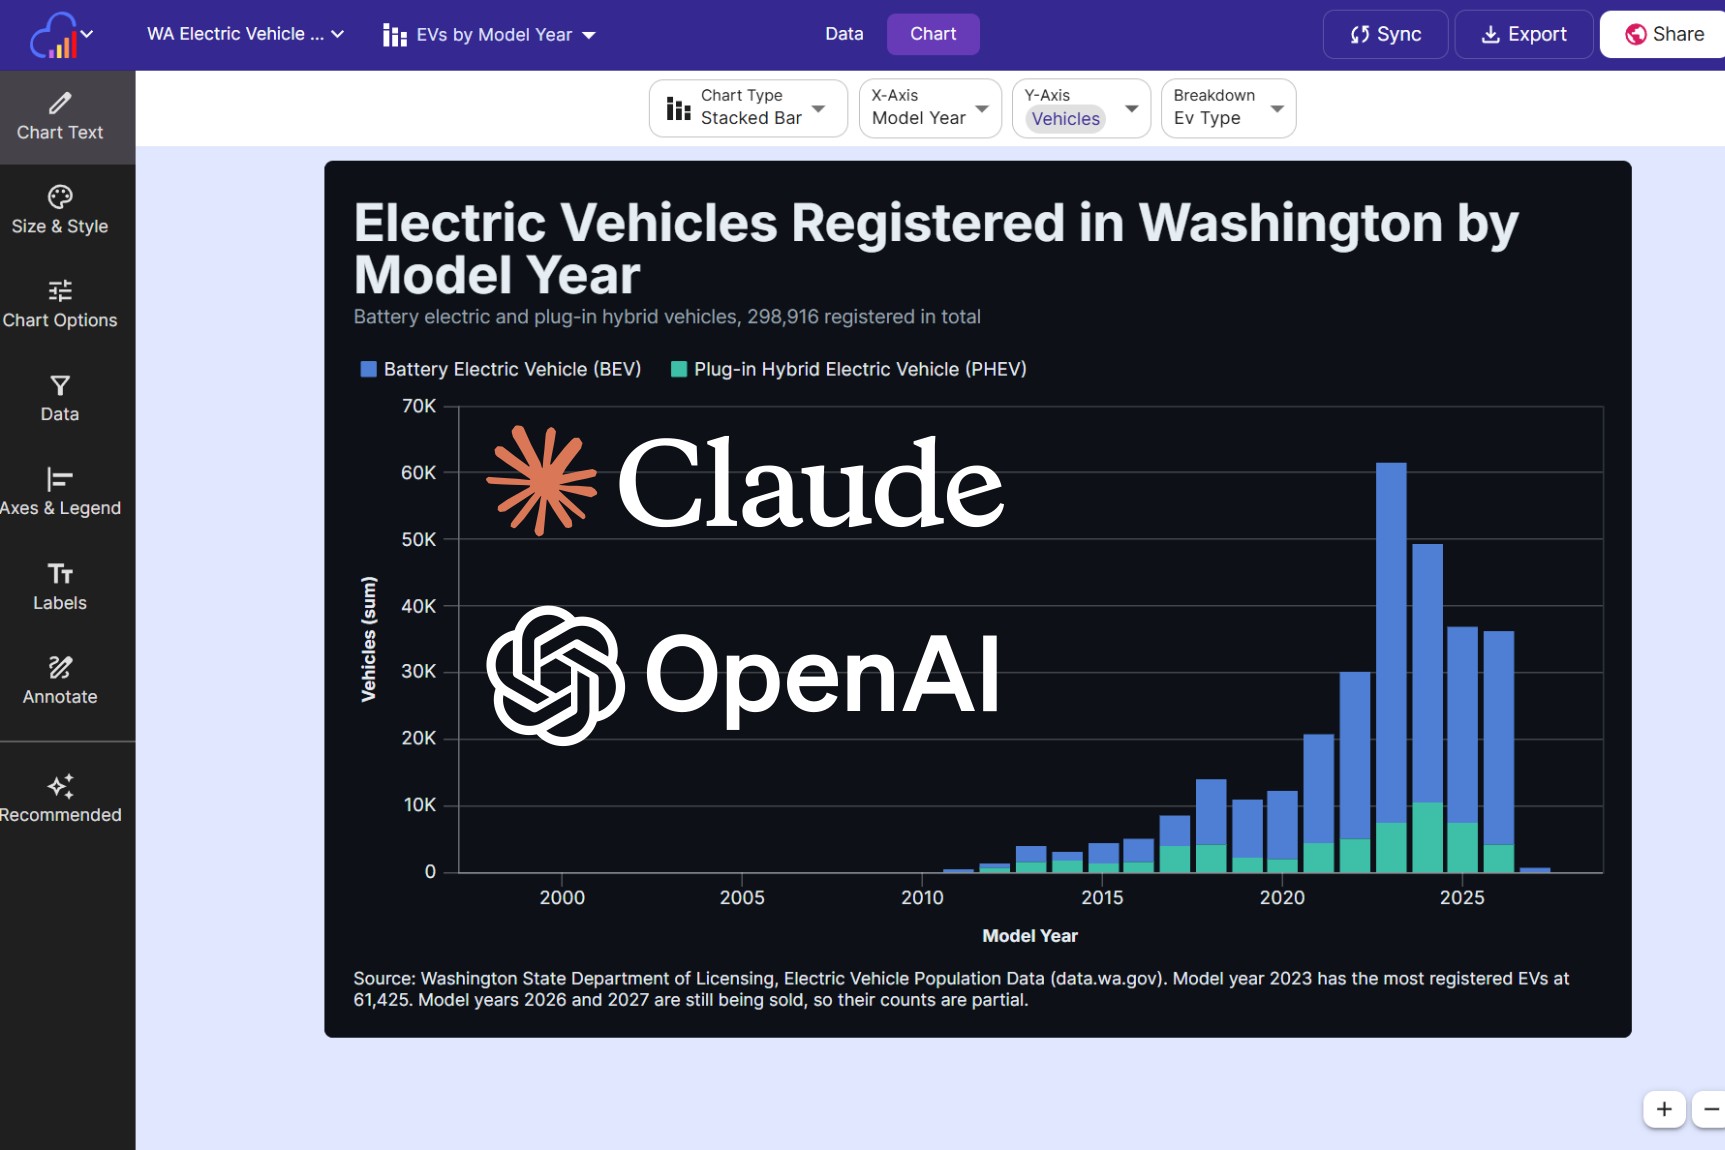
How to make a chart in Claude or ChatGPT
To make a chart in Claude or ChatGPT, connect the InstaCharts MCP server at https://api.instacharts.io/mcp to your AI app, sign in with your InstaCharts account, then send your spreadsheet and describe the chart. Your assistant creates a sheet from the data, builds the chart in InstaCharts, checks it and returns a link you can share or embed.
MCP (Model Context Protocol) is the open standard that Claude, ChatGPT and Claude Code use to connect to outside tools. InstaCharts runs the server for you, so setup takes about a minute.
- 1Connect InstaCharts to your AI app: Add https://api.instacharts.io/mcp as a custom connector in Claude or ChatGPT settings, or run claude mcp add --transport http instacharts https://api.instacharts.io/mcp in Claude Code.
- 2Sign in to InstaCharts: Sign in on the InstaCharts page that opens and choose whether the AI app can edit or only view your sheets and charts.
- 3Send your spreadsheet: Paste the table into the chat, give a link to the CSV or Excel file or a Google Sheet published as CSV, upload a local file from Claude Code, or name a sheet already in InstaCharts.
- 4Ask for the chart: Describe the chart type, the columns to plot and how to total the values, such as a bar chart of sales by region or a line chart of signups by week.
- 5Check, share and embed: The assistant renders the chart to check it, makes the changes you ask for, then returns a share link and iframe embed code.
For screenshots of each setting, read the Connect AI Apps guide, or follow Chart a Spreadsheet with Claude or ChatGPT for every way to send your data.
Four ways to chart a spreadsheet from the chat
Pick the method that fits where your spreadsheet lives. Each one creates an InstaCharts sheet with text, number, date, percent and currency columns detected from the values.
Paste a table into the chat
Copy a range from Excel or Google Sheets and paste it into Claude or ChatGPT. The assistant sends the rows to InstaCharts and names the sheet. This works best for tables of up to a few hundred rows.
Give a link to the file
Share a link to a CSV, Excel or JSON file, such as a Google Sheet published to the web as CSV, a raw file on GitHub or an open data export. InstaCharts downloads the whole file, and the sheet can sync from the link on an hourly, daily, weekly or monthly schedule.
Upload a file with Claude Code
Claude Code sends CSV and Excel files from your computer to a one-time InstaCharts upload link. The file goes straight to InstaCharts, which makes this the best choice for large spreadsheets and workbooks with several tabs.
Chart a sheet already in InstaCharts
Name any sheet in your workspace, including uploaded files and Google Sheets connected to InstaCharts. The assistant reads the columns and builds the chart, and charts on a connected Google Sheet update when the Google file changes.
What Claude and ChatGPT can do in InstaCharts
Your assistant works with the same sheets, charts and dashboards you use in the app
Build 15 chart types
Bar, line, area, scatter, pie, radar, heatmap, mekko and gauge charts, with grouped and stacked versions.
Calculate from every row
Sum, average, median, min, max and count run inside InstaCharts on the full sheet, with date grouping and filters.
Check its own work
The assistant renders the chart as an image, looks at it and adjusts the type, sorting, colors or titles.
Share and embed
Get a public link and iframe embed code that stay the same as the chart and its data change.
Keep data current
Add, change and delete rows from the chat, or sync the sheet from Google Sheets or a web link.
Build dashboards
Turn a spreadsheet into a dashboard of KPI numbers, charts, a data table and slicers in one request.
Built-in AI charts compared with InstaCharts charts
Claude and ChatGPT can draw a quick chart on their own by writing code or generating an image. Connecting them to InstaCharts saves the chart with its data, styling and sharing settings, so you can reuse it.
| Chart drawn inside the chat | Chart made in InstaCharts from the chat | |
|---|---|---|
| Where it is saved | In the conversation, as an image or code | In your InstaCharts workspace, next to the sheet that holds its data |
| How it is drawn | Code the assistant writes for that one chart | Saved chart settings that InstaCharts draws the same way every time |
| Styling | Described in each prompt | Your workspace theme, fonts, brand colors and logo, applied to every new chart |
| New data | Ask again with the updated spreadsheet | Add rows, or sync from Google Sheets or a web link, and the chart redraws |
| Sharing | Download the image or share the conversation | Public link, private sharing with specific people and iframe embed code |
| Editing | Ask for changes in the chat | Ask in the chat or click through the visual chart editor |
| Exports | The image or file the assistant made | PNG, JPG, SVG, WebP, PDF and PowerPoint, at the size you set |
Prompts for charting a spreadsheet
Once InstaCharts is connected, ask in plain language. Name the chart type, the columns and how to total the values when you want a specific result.
- "Here is our monthly sales by region. Make a stacked bar chart in InstaCharts and give me the share link."
- "Import the Google Sheet published at this CSV link and chart signups by week as a line chart."
- "Upload data/q3-orders.xlsx and chart revenue by product category as horizontal bars, largest first."
- "Read my Website Traffic sheet and make a line chart of sessions by month, grouped by channel."
- "Show me the chart, then group the dates by quarter and use our brand blue, #1f4e8c."
- "Show only the top 10 customers by total sales, then give me the embed code for our blog."
- "Build a sales dashboard from my Orders sheet with KPIs, a few charts, a table and a region slicer."
Plans and tasks
Connecting Claude, ChatGPT and other AI apps is included with paid InstaCharts plans, which start at $10 per seat a month. Each change your assistant makes, such as creating a sheet, importing a file, creating or editing a chart, sharing it or rendering a chart image, counts as one task. Listing and reading your sheets and charts is free.
Starter plans include 1,000 tasks a month per seat and Pro plans include 5,000, shared by the whole workspace. A spreadsheet turned into a shared chart usually takes 4 to 6 tasks. See pricing for every plan.
FAQs
Claude and ChatGPT Chart FAQs
Yes. Claude can make charts in InstaCharts once you add the InstaCharts MCP server, https://api.instacharts.io/mcp, as a custom connector in Claude or Claude Code. Claude creates a sheet from your data, builds the chart you describe, renders it to check how it looks and returns a share link and embed code. The chart is saved in your InstaCharts workspace.
Connect InstaCharts to ChatGPT as a custom connector with the URL https://api.instacharts.io/mcp and sign in. Then paste your table into the chat, give ChatGPT a link to the CSV or Excel file, or name a sheet already in InstaCharts, and ask for the chart you want. ChatGPT builds it in InstaCharts and returns the share link.
Yes. ChatGPT can chart a small Excel table you paste into the chat, an Excel file at a public link, or an Excel file you uploaded to InstaCharts. InstaCharts reads .xlsx, .xls, .xlsm and .xlsb files, and a workbook with several tabs becomes one sheet per tab.
Yes. Publish the Google Sheet to the web as CSV and give your assistant the link, or connect the Google Sheet to InstaCharts and ask the assistant to chart that sheet. A Google Sheet connected to InstaCharts can update automatically, and every chart built on it updates with the Google file.
Yes. Claude Code asks InstaCharts for a one-time upload link and sends your local CSV or Excel file to it, so the whole file reaches InstaCharts without passing through the conversation. This suits large spreadsheets up to your plan's row and file size limits.
Your assistant can build all 15 InstaCharts chart types: line, grouped line, bar, stacked bar, grouped bar, area, stacked area, scatter, grouped scatter, pie, radar, heatmap, mekko, gauge and grouped gauge. It can also set the aggregation, date grouping, filters, top items, sorting, titles, theme and colors.
Yes. Ask your assistant to share the chart and it returns a public link and the iframe embed code for WordPress, Webflow, Squarespace or any HTML page. The link and embed code stay the same when you edit the chart or update its data, so your website always shows the latest version.
InstaCharts runs a remote MCP server, so there is nothing to install for Claude or ChatGPT. You add the server URL to your AI app once and sign in with your InstaCharts account. Claude Code adds it with one terminal command.
Connecting AI apps is included with paid InstaCharts plans, which start at $10 per seat a month. Each change your assistant makes, such as creating a sheet, creating a chart or sharing it, counts as one task. Starter plans include 1,000 tasks a month per seat and Pro plans include 5,000. Reading your sheets and charts is free.
Data you paste into the chat goes through your AI app. A file sent with a link import or an upload link goes straight to InstaCharts, and the assistant reads the column names and a page of rows when it needs them to plan the chart.
Yes. Every chart your assistant makes is a regular InstaCharts chart. Open it in the visual chart editor to add annotations, change labels, apply a theme or add it to a dashboard, and its share link and embed code stay the same.
Yes. Ask for a dashboard from one of your sheets and the assistant builds it in one step with KPI numbers, charts, a data table, notes and slicers, then shares it with a link or with your workspace.
Make your first chart from Claude or ChatGPT
InstaCharts makes data visualization easy, so you can build clear reports without design experience.