
HR Dashboard Template
Headcount, hiring, salaries and performance ratings by department, location and job level, built from an employee roster.
Turn an employee roster into a workforce report. The template builds four KPI numbers, five charts, a roster table and two filters from 152 sample employees.
- 4 KPI numbers
- 5 charts
- 2 filters
- 152 sample rows
HR Workforce Dashboard
About this template
What the hr workforce dashboard shows
The sample roster covers six departments and four locations, with each person's job level, employment type, hire date, salary and latest performance rating. Engineering is the largest department with 44 people, and 46 people work remotely.
The average salary is $81,845, ranging from $53,534 for associates to $153,000 for directors. Hiring has picked up since 2022, and 36 people joined in 2026, the most of any year. Marketing has the highest average performance rating at 3.81 out of 5.
Most of the workforce is full time, with 121 full-time employees, 20 part-time and 11 contractors. The Department and Location filters narrow every widget, so a department head can see their own team.
What's included
Every widget on the hr workforce dashboard
The numbers below are what each widget shows for the sample data. Replace the rows with your own and they update to match.
KPI numbers
Headcount
152
Count of Employee ID
Hires This Year
36
Up 33.3% vs last year
Count of Employee ID, compared with last year
Average Salary
$81,845.39
Average of Annual Salary
Average Performance Rating
3.55 / 5
Average of Performance Rating
Charts
Filters
The Department and Location filters sit in the dashboard header. Picking a value narrows every KPI, chart and table on the page.
Data table and notes
The Employee Roster table lists every row of the sample sheet, and a text widget explains what the dashboard shows and how to use the filters.
Sample data
Sample data for the hr workforce dashboard
The template loads 152 rows into a sheet named Employee Roster. Keep the same columns, replace the rows with your own data, and the whole dashboard updates.
Employee ID
IDUsed in Headcount, Hires This Year, Hires by Year
Department
TextUsed in Headcount by Department, Average Performance Rating by Department, Filter: Department
Location
TextUsed in Headcount by Department, Filter: Location
Job Level
TextUsed in Average Salary by Job Level
Employment Type
TextUsed in Employment Type
Hire Date
DateUsed in Hires This Year, Hires by Year
Annual Salary
CurrencyUsed in Average Salary, Headcount by Department, Employment Type, Average Salary by Job Level
Performance Rating
NumberUsed in Average Performance Rating, Average Performance Rating by Department
| Employee ID | Department | Location | Job Level | Employment Type | Hire Date | Annual Salary | Performance Rating |
|---|---|---|---|---|---|---|---|
| E-1001 | Customer Support | Remote | Senior | Full-time | 2018-02-07 | $79,000 | 4 |
| E-1002 | Engineering | New York | Mid-Level | Full-time | 2018-05-30 | $97,500 | 2 |
| E-1003 | Customer Support | Remote | Senior | Full-time | 2018-06-16 | $72,000 | 3 |
| E-1004 | Finance | New York | Senior | Full-time | 2018-08-20 | $104,000 | 1 |
| E-1005 | Sales | Austin | Associate | Full-time | 2018-09-01 | $60,000 | 4 |
| E-1006 | Customer Support | Austin | Manager | Part-time | 2018-09-14 | $41,500 | 3 |
| E-1007 | Engineering | Austin | Associate | Contract | 2018-10-09 | $72,500 | 4 |
| E-1008 | Marketing | London | Senior | Full-time | 2018-11-28 | $102,500 | 4 |
| E-1009 | Engineering | New York | Manager | Full-time | 2018-12-27 | $163,000 | 3 |
| E-1010 | Finance | London | Mid-Level | Full-time | 2019-01-23 | $84,500 | 3 |
Showing the first 10 of 152 rows.
How to use it
How to build the hr workforce dashboard
- 1
Click Use this Template
Log in, or create a free InstaCharts account with your email or Google account.
- 2
Get the finished dashboard
InstaCharts adds the sample sheet to your workspace and builds every KPI, chart, table and filter in the Studio theme.
- 3
Swap in your data
Switch to Sheets to paste in your own rows or update the sheet from a CSV or Excel file with the same columns.
- 4
Make it yours
Pick another theme in Dashboard Settings, move or resize widgets, and add more charts, KPIs or text.
Tips for adapting the hr workforce dashboard
- Export your employee list from your HR system or payroll tool with one row per person.
- Use one ID per employee and leave names out if the dashboard will be shared widely. The headcount KPI counts the ID column.
- Keep hire dates in a date format such as 2024-03-15 so the Hires by Year chart and the Hires This Year KPI group them correctly.
- Add columns such as gender, tenure band or manager to chart other breakdowns, and add a filter for any column with a small number of values.
FAQ
HR Workforce Dashboard template FAQ
What should an HR dashboard show?
An HR dashboard usually shows headcount, hiring, pay and performance, broken down by department, location and job level. This template covers each of these from a single roster sheet.
Can I keep salary data private?
Yes. A new dashboard can only be seen by members of your workspace. Paid plans can also share it with specific people or with a public link, so you decide who sees the salary figures.
Is this dashboard template free?
Yes. Click Use this Template and sign up for a free InstaCharts account, or log in. The hr workforce dashboard is built in your workspace with its sample sheet, widgets and filters. Inside the app, the template is also under New, New Dashboard, Start from a Template.
How do I replace the sample data with my own?
Switch to Sheets in the dashboard toolbar to open the sample sheet. Paste in your own rows or update the sheet from a CSV or Excel file with the same columns, and every chart, KPI and data table on the dashboard updates to match.
Can I change the theme and layout?
Yes. Open Dashboard Settings to pick another theme or customize the header, page and chart colors. Widgets can be moved, resized, duplicated or deleted, and you can add more charts, KPIs, tables and text.
Learn how dashboards work on the dashboard maker page, or read the guide on how to create a dashboard.
More templates
More dashboard templates
Sales Performance Dashboard
Revenue, orders and profit by month, region, sales rep and product category, with region and category filters.
- 4 KPIs
- 6 charts
- 2 filters
Marketing Campaign Dashboard
Weekly spend, clicks, leads and conversions for search, social, email and display campaigns, with channel and campaign filters.
- 4 KPIs
- 6 charts
- 2 filters
Budget vs Actual Dashboard
Monthly budget and actual spending by department and expense category, with the variance that shows who is over or under budget.
- 6 KPIs
- 4 charts
- 2 filters
Nonprofit Fundraising Dashboard
Donations by month, campaign, channel and donor type, with unique donors, average gift and progress toward an annual goal.
- 5 KPIs
- 6 charts
- 2 filters
Customer Satisfaction Dashboard
Support survey responses with satisfaction scores, likelihood to recommend and resolution times by month, region, plan and channel.
- 4 KPIs
- 6 charts
- 2 filters
Browse all dashboard templates.
Chart templates
Single human resources charts
Need one chart in place of a whole dashboard? These chart templates open in the chart maker with no account needed.
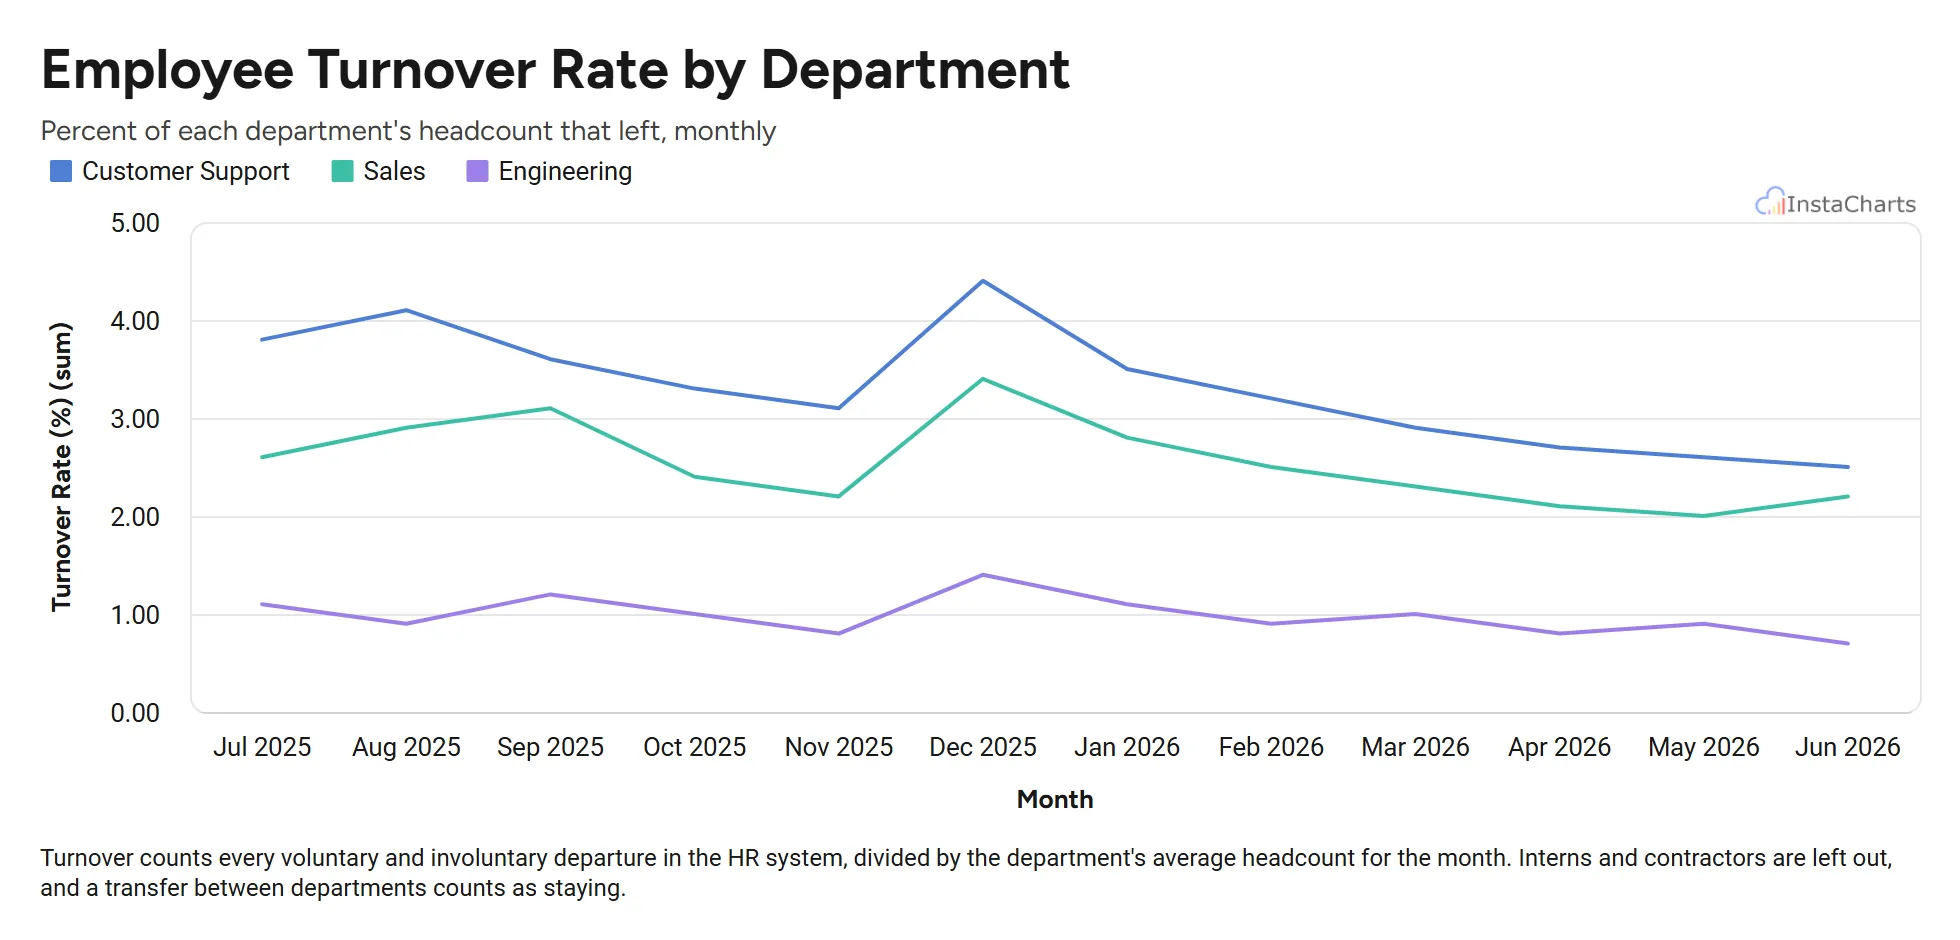 Grouped Line Chart
Employee Turnover by Department
Monthly employee turnover rate for sales, engineering and customer support over twelve months.
View template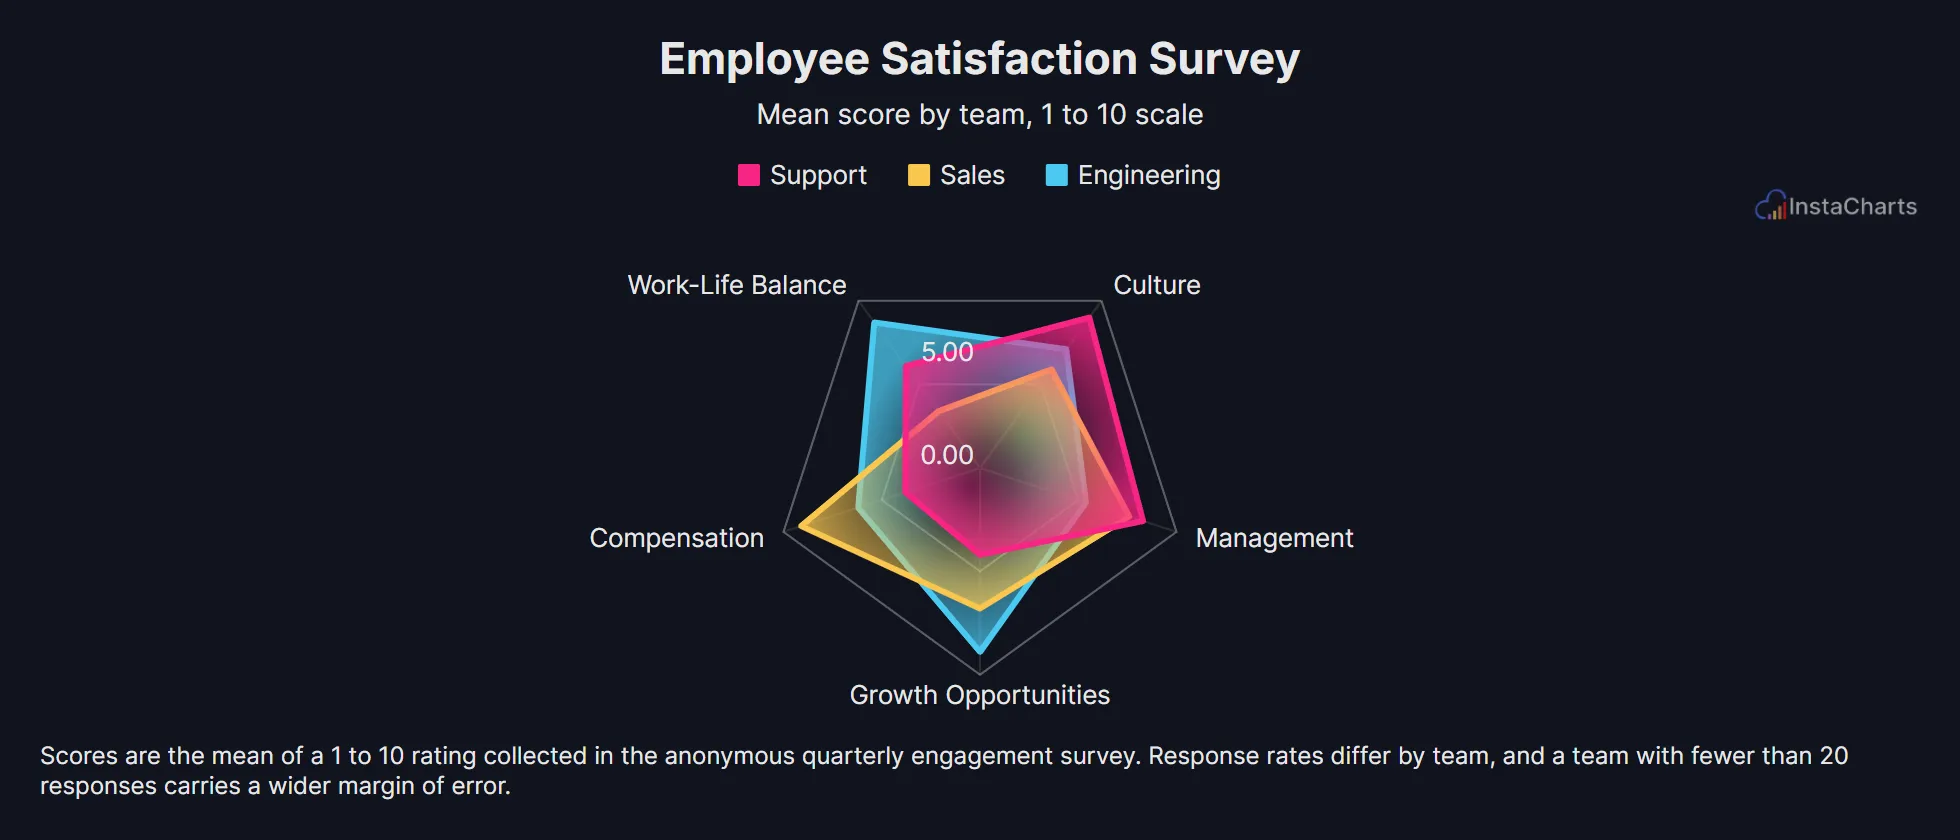 Radar Chart
Employee Satisfaction Survey
Survey scores across compensation, work-life balance, management, growth and culture for three teams.
View template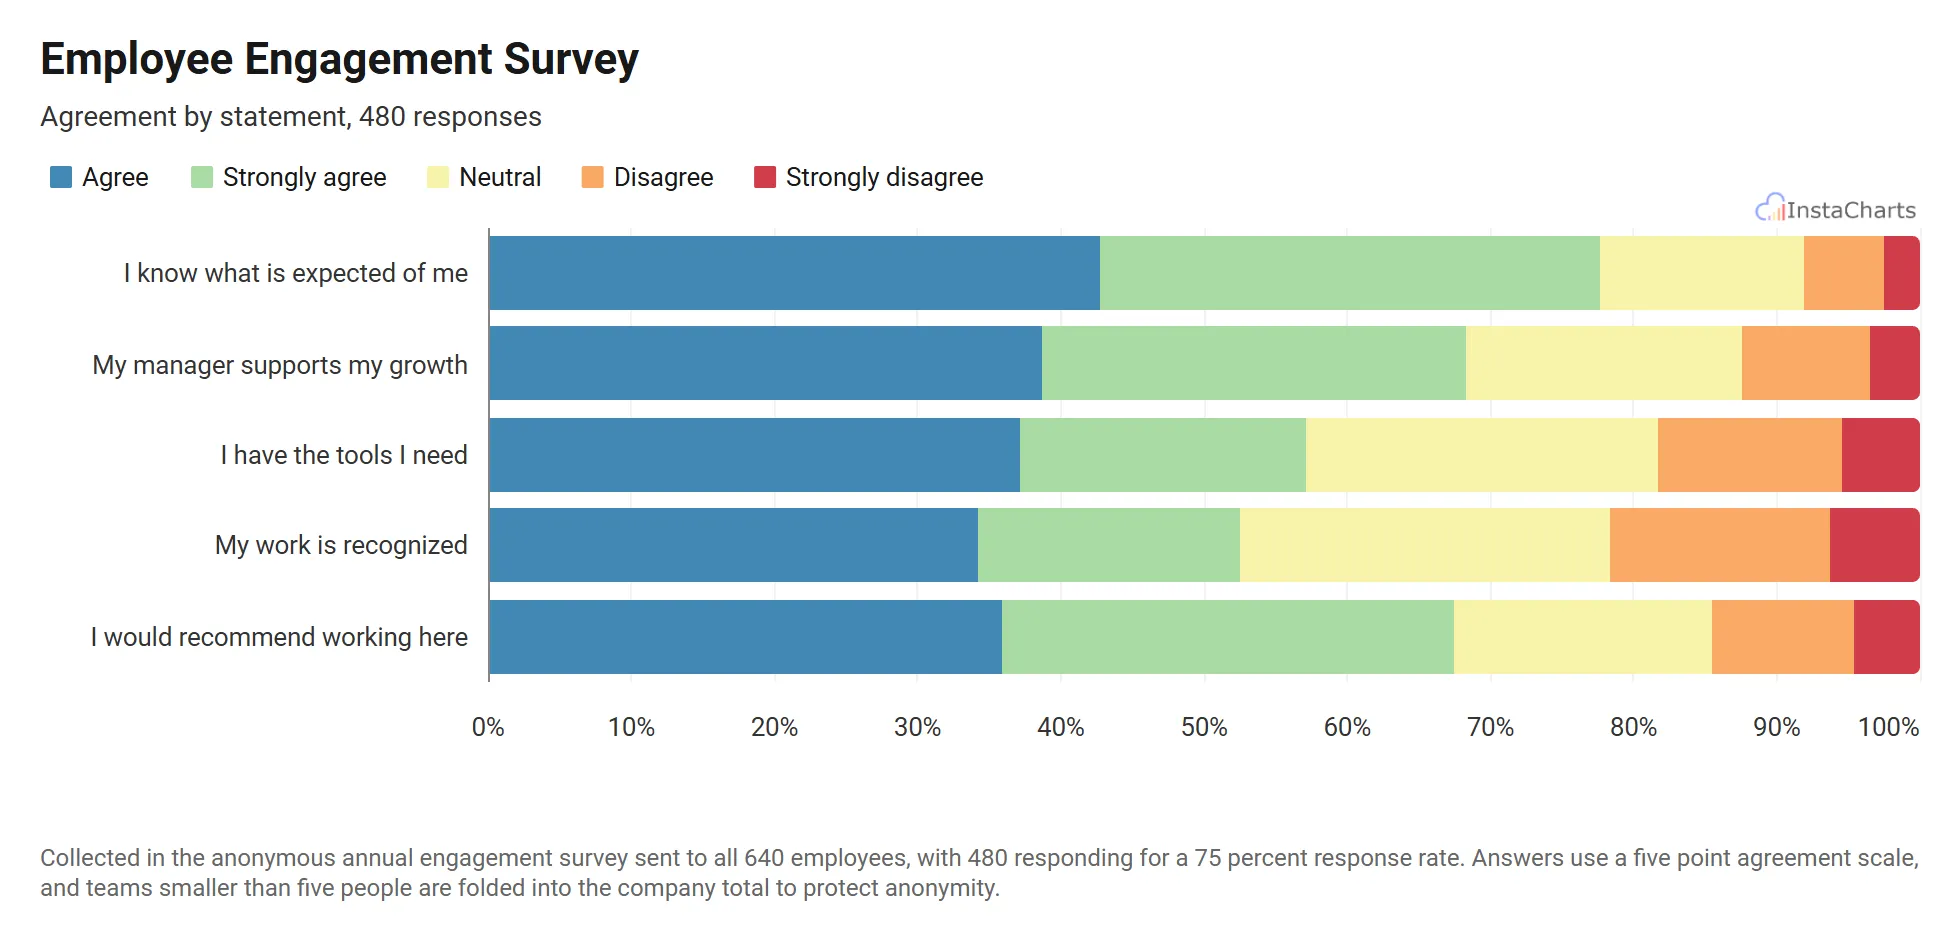 100% Stacked Bar Chart
Employee Engagement Survey
Agreement levels for five engagement statements, stacked into horizontal bars so each question reads as one row.
View templateSee all HR Chart Templates.
Build your hr workforce dashboard today
InstaCharts makes data visualization easy, so you can build clear reports without design experience.