
 InstaCharts + Your Website
How to Embed a Chart in a Website
Step by step guides for Notion, WordPress, Webflow, Wix, Squarespace, Shopify and more
InstaCharts turns a spreadsheet into an interactive chart that you can embed in any website or app. The embedded chart stays connected to its data, so the page shows current numbers every time it loads.
- Live and interactive
- Updates when your data changes
- Free plan available
A live embedded chart example
LiveA live chart embedded with InstaCharts. Hover over the chart to see each value.
Guides
Pick your platform
Each guide shows which embed code to copy, where to paste it and how to size the chart on that platform.
Embed a Chart in Notion
Add a live, interactive chart to any Notion page
Uses the Embed URL
Embed a Chart in WordPress
Add an interactive chart to any WordPress post or page
Uses the Responsive Embed Tag
Embed a Chart in Webflow
Put a live chart on any Webflow page or CMS template
Uses the Responsive Embed Tag
Embed a Chart in Wix
Add a live, interactive chart to your Wix website
Uses the Embed URL
Embed a Chart in Squarespace
Show a live chart on any Squarespace page or blog post
Uses the Responsive Embed Tag
Embed a Chart in Ghost
Add live data charts to Ghost posts and pages
Uses the Responsive Embed Tag
Embed a Chart in Shopify
Show live charts on Shopify pages, product pages and blog posts
Uses the Responsive Embed Tag
Embed a Chart in Bubble
Add charts and dashboards to a no-code Bubble app
Uses the Responsive Embed Tag
Embed a Chart in Google Sites
Add a live chart to a Google Sites page, intranet or class site
Uses the Iframe Only Embed Tag
Embed a Chart in Framer
Add a live chart to a Framer landing page or site
Uses the Embed URL
Embed codes
Which embed code to use
The Share dialog in InstaCharts offers several codes for the same chart. The right one depends on what your platform accepts.
| Code | What it is | Use it in |
|---|---|---|
| Embed URL | A web address for the chart. Paste it into apps that have their own embed block and draw the frame for you. | Notion, Wix (Website Address), Framer |
| Responsive Embed Tag | HTML with an iframe and a small script that sets the frame's height to fit the chart and lets it shrink on narrow screens. | WordPress, Webflow, Squarespace, Ghost, Shopify, Bubble, any HTML page |
| Iframe Only Embed Tag | A single iframe tag with a fixed width and height and no script. Use it where scripts are removed or where the platform draws its own frame. | Google Sites, Shopify text editor, platforms that remove scripts |
| Shared image | A PNG of the chart from the Share Image tab that updates when the chart changes. Use it where iframes are blocked. | Email newsletters, Medium, Substack |
How it works
Make a chart and copy its embed code
Step 1
Add your data
Upload a CSV or Excel file, paste a table, import a file from a web link or connect a Google Sheet. InstaCharts reads your columns and suggests a chart.
To add a new sheet, launch the Add New Sheet dialog. There's a few ways to import your data, the easiest is Blank Sheet. In the empty spreadsheet on the Blank Sheet page, paste in your data straight from Excel. Click Next to see a data preview, then click Import. InstaCharts then draws a chart from the data automatically.
Step 2
Pick and style the chart
Choose the chart type and the columns for each axis, then set the title, colors and labels. Charts made from a synced Google Sheet or web link keep updating.
Easily change the shape of the chart using the Chart Type dropdown. Here, we are changing from a bar chart to a pie chart. Use the right click menu to show data labels on the pie chart, and to hide the legend. Finally we will change the chart theme and color scheme to get our chart to match our website.
Step 3
Share it and copy the embed code
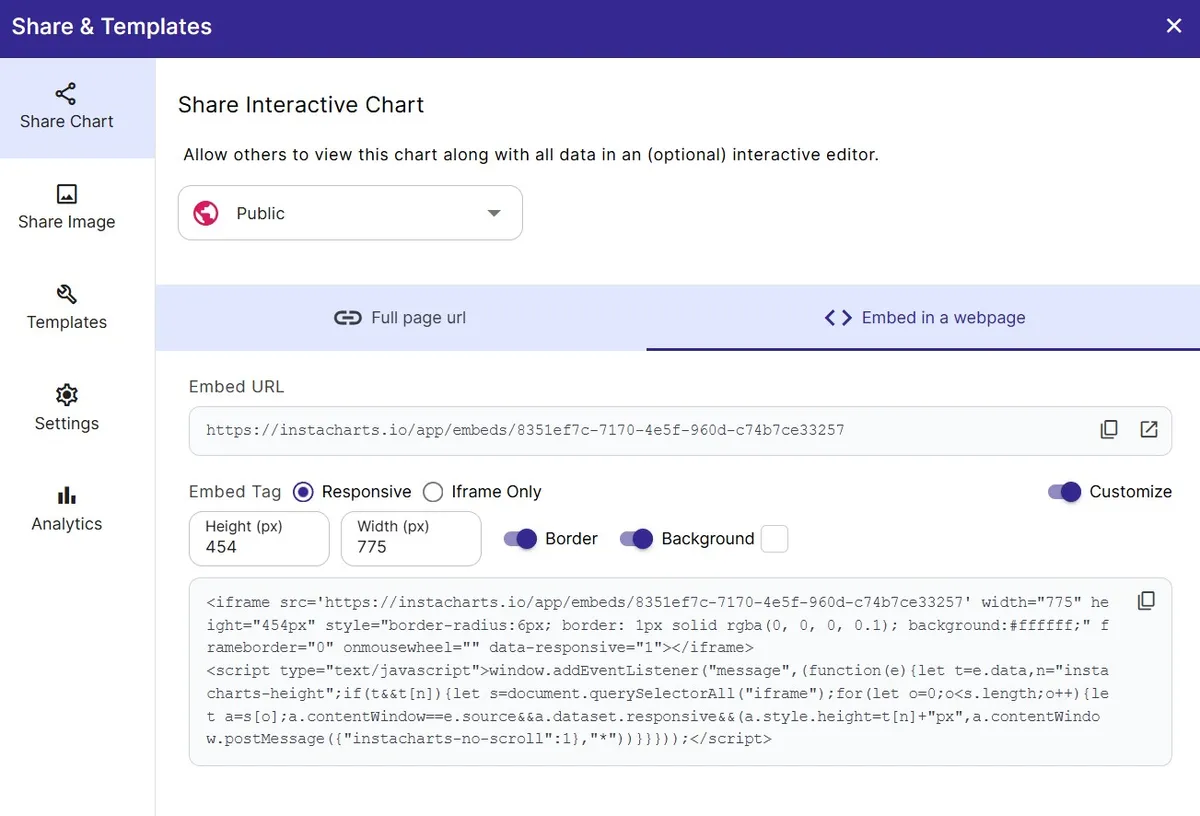
Click Share on the toolbar, choose Share Chart and set the share mode to Public. Under Embed in a webpage, copy the embed code.
Any HTML page
Embed a chart in a hand-coded website
Paste the Responsive Embed Tag into your page's HTML where the chart should appear.
The Responsive Embed Tag holds an iframe that loads the chart and a small script from InstaCharts. The script sets the iframe's height to fit the chart, and the container lets the chart shrink on narrow screens.
Set the width, height, border and background with the Customize toggle in the Share dialog before you copy the code. For a fixed size with no script, choose Iframe Only next to Embed Tag.
Charts on the free plan include a small InstaCharts link at the bottom of the chart. Paid plans remove it.
What the Responsive Embed Tag looks like
Copy your own code from the Share dialog. YOUR_CHART_ID stands for the id InstaCharts gives your chart.
<div class="instacharts-embed" data-src="embeds/YOUR_CHART_ID" style="width:600px; max-width:100%;">
<iframe src='https://instacharts.io/app/embeds/YOUR_CHART_ID' title="Quarterly Revenue" width="100%" height="600px" style="border-radius:6px; border: 1px solid rgba(0, 0, 0, 0.1); background:#ffffff;" frameborder="0" data-responsive="1"></iframe>
<script src="https://instacharts.io/app/scripts/embed.js" ></script>
</div>
SEO
Help search engines read your chart
Search engines index the content of an iframe as part of instacharts.io. Two options next to the Embed Tag put a description of the chart on your own page.
SEO caption
Wraps the chart in a figure with a visible caption that holds the chart's title, its caption and a sentence naming the plotted columns. The text sits on your page, in your site's font, and search engines index it with the rest of your content.
SEO data
Adds a JSON-LD script that describes the chart as a schema.org Dataset, with its name, description, measured columns, source and last updated date, so search engines and AI search tools can tell what the chart shows.
Platforms such as Wix and Google Sites load pasted code inside a frame of their own. On those platforms, add a text block with a short description below the chart.
FAQ
Embedding charts: FAQ
Answers to common questions about embedding InstaCharts charts, data tables and dashboards.
Does an embedded chart update when my data changes?
Yes. The embed loads the chart from InstaCharts each time the page opens, so changes to the chart and new data from a synced Google Sheet, a web link or Zapier show up with no new embed code.
Is it free to embed a chart?
Yes. The free plan includes 200 share and embed views a month, and free charts show an InstaCharts watermark. Paid plans remove the watermark and raise the limit to 1,000 views a month on Starter and 100,000 on Pro.
Can I embed a data table or a dashboard?
Yes. Turn on Full Dataset or Plotted Data in the Settings tab of the Share dialog to add sortable table views to the chart embed. Dashboards have their own Share dialog with an Embed URL and Embed Tag.
Can I see where my chart is embedded?
Yes, on paid plans. The Analytics tab of the Share dialog counts embed views apart from share link views and lists the top pages that load the chart.
Can I stop other sites from embedding my chart?
Yes, on paid plans. Turn on Domain Whitelisting in the Settings tab of the Share dialog and list each domain allowed to load the chart. The chart stays blank on every other site.
Which platforms block chart embeds?
Medium, Substack and email clients block iframes. Export the chart as a PNG or SVG and upload the image, or use a shared chart image, which updates when the chart changes.
Want the full reference?
Read the embed charts documentation for sizing, the embed toolbar, SEO options and domain whitelisting.
Make a chart to embed on your site
InstaCharts makes data visualization easy, so you can build clear reports without design experience.