
 InstaCharts + Shopify
Embed a Chart in Shopify
Show live charts on Shopify pages, product pages and blog posts
Shopify stores use charts for product comparisons, impact and sustainability reports, and sales milestones. InstaCharts charts go into a Custom Liquid section in the theme editor, and they update on the storefront when the data changes.
- Live and interactive
- Updates when your data changes
- Free plan available
Product Category Mix by Store
Live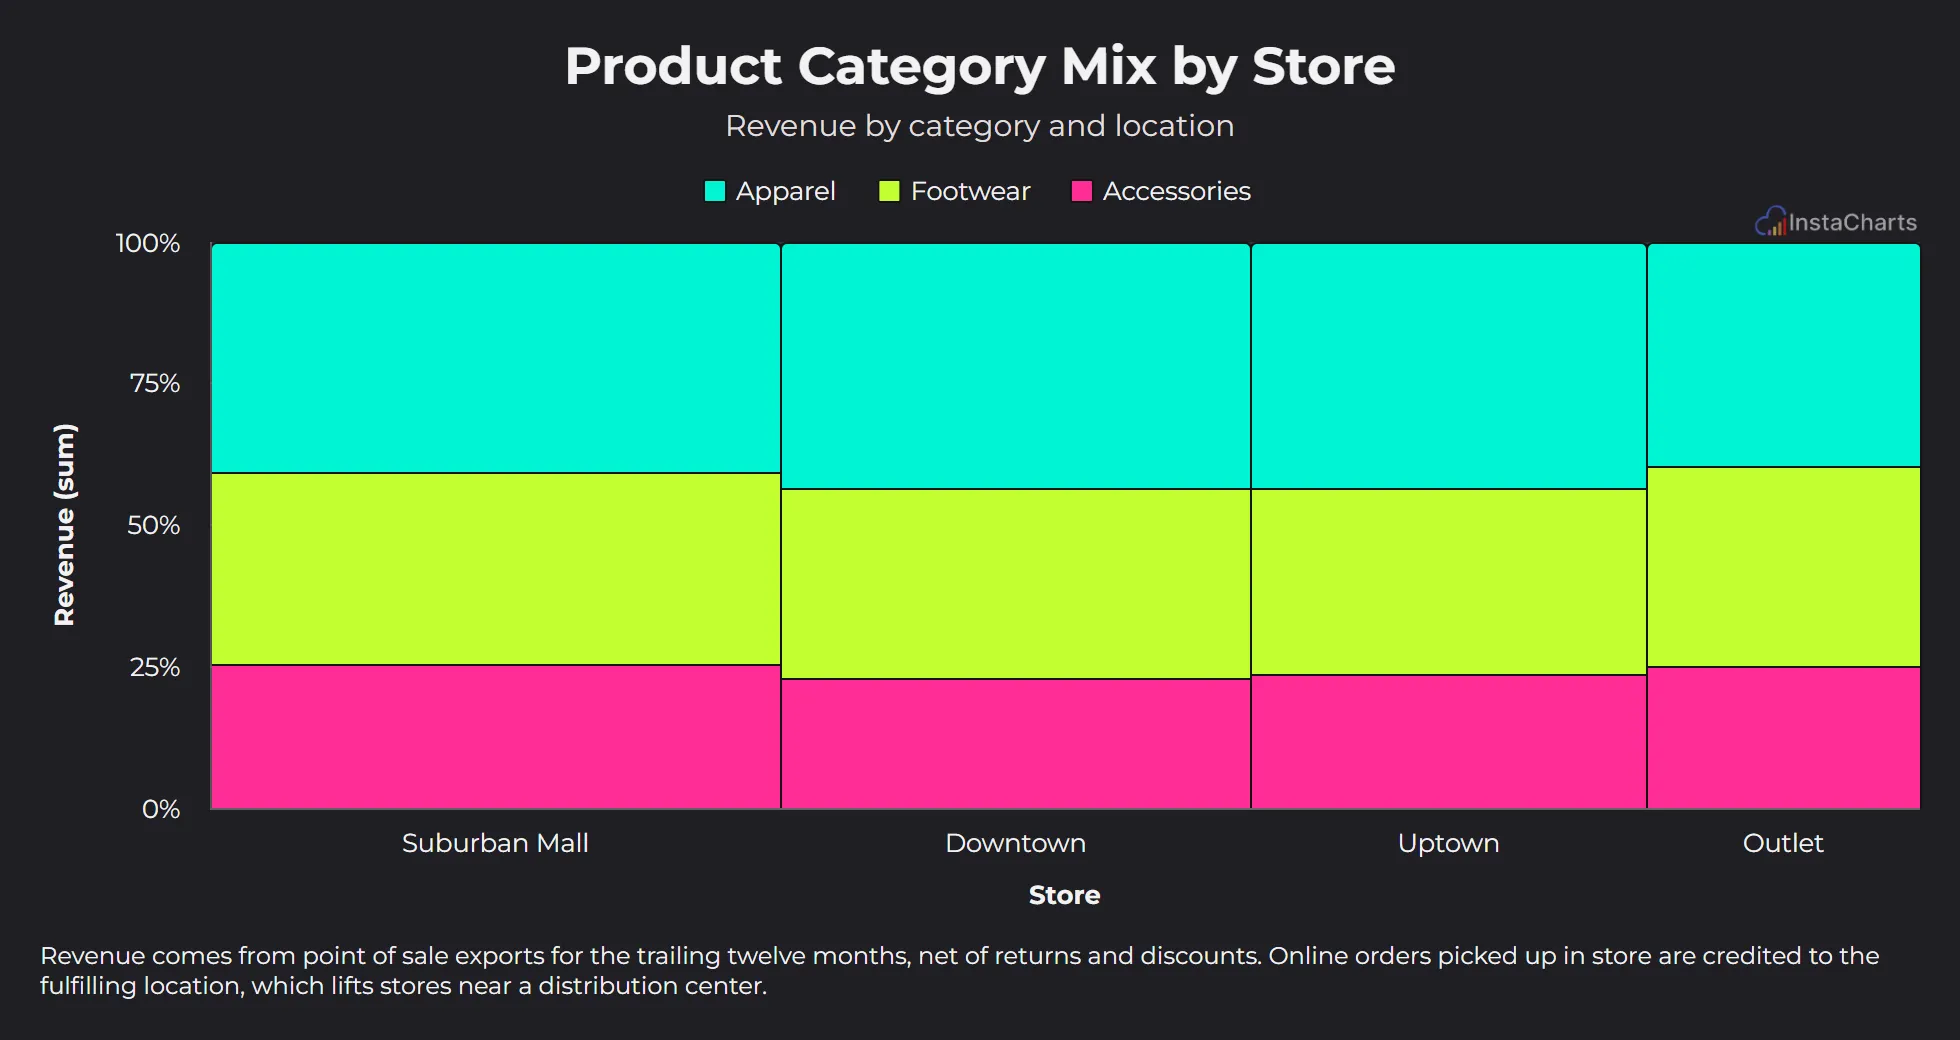
A live mekko chart embedded with InstaCharts, the kind of chart you can add to Shopify. Hover over the chart to see each value.
Open TemplateAt a glance
What you need to embed a chart in Shopify
An InstaCharts chart shared publicly, its Responsive Embed Tag, and a Custom Liquid section on your Shopify page.
Code to copy
Responsive Embed Tag
Where it goes in Shopify
Custom Liquid section
Updates
Automatic when the chart or its data changes
About Shopify
What is Shopify?
Shopify is an ecommerce platform launched in 2006 and founded in Ottawa, Canada. Merchants use it to run online stores and in-person sales, with themes that are edited in the theme editor and extended with apps and Liquid code.
Visit shopify.comChart ideas
Charts that work well in Shopify
Start from a template with sample data, then replace the rows with your own numbers and embed the chart in Shopify.
Product category mix
Show how sales split across product categories and store locations.
See the mekko chart templateCustomer satisfaction
Display a satisfaction score gauge on a reviews or about page.
See the grouped gauge chart templateSubscription feedback
Chart the reasons subscribers give when they cancel, for a product or support page.
See the horizontal bar chart templateIn InstaCharts
Make the chart and copy its embed code
Step 1
Add your data
Upload a CSV or Excel file, paste a table, import a file from a web link or connect a Google Sheet. InstaCharts reads your columns and suggests a chart.
To add a new sheet, launch the Add New Sheet dialog. There's a few ways to import your data, the easiest is Blank Sheet. In the empty spreadsheet on the Blank Sheet page, paste in your data straight from Excel. Click Next to see a data preview, then click Import. InstaCharts then draws a chart from the data automatically.
Step 2
Pick and style the chart
Choose the chart type and the columns for each axis, then set the title, colors and labels. Charts made from a synced Google Sheet or web link keep updating.
Easily change the shape of the chart using the Chart Type dropdown. Here, we are changing from a bar chart to a pie chart. Use the right click menu to show data labels on the pie chart, and to hide the legend. Finally we will change the chart theme and color scheme to get our chart to match our website.
Step 3
Share it and copy the Responsive Embed Tag
Click Share on the toolbar, choose Share Chart and set the share mode to Public. Under Embed in a webpage, choose Responsive next to Embed Tag and copy the code.
Click Share on the toolbar to open the Share & Templates dialog. Change the pie chart's share mode to Public. Under the Embed in a webpage tab, keep Responsive selected and copy the embed code.
In Shopify
Add the chart to Shopify
Paste the Responsive Embed Tag into a Custom Liquid section.
- 4
Step 4
Open the theme editor
In Shopify admin, go to Online Store, Themes and click Customize. Open the page or template where the chart belongs.
- 5
Step 5
Add a Custom Liquid section
Click Add section, choose Custom Liquid and move it to where the chart should appear.
- 6
Step 6
Paste the Embed Tag
Paste the Responsive Embed Tag from InstaCharts into the Liquid code field and click Save.
What the Responsive Embed Tag looks like
Copy your own code from the Share dialog. YOUR_CHART_ID stands for the id InstaCharts gives your chart.
<div class="instacharts-embed" data-src="embeds/YOUR_CHART_ID" style="width:600px; max-width:100%;">
<iframe src='https://instacharts.io/app/embeds/YOUR_CHART_ID' title="Quarterly Revenue" width="100%" height="600px" style="border-radius:6px; border: 1px solid rgba(0, 0, 0, 0.1); background:#ffffff;" frameborder="0" data-responsive="1"></iframe>
<script src="https://instacharts.io/app/scripts/embed.js" ></script>
</div>
Tips
Tips for charts in Shopify
- For a chart inside a blog post or a single page, open it in Shopify admin, click Show HTML in the text editor toolbar and paste the Iframe Only Embed Tag.
- A Custom Liquid section on a product template shows on every product that uses the template. Create a separate product template for products that need their own chart.
- Turn on SEO caption to add the chart's title and a description of its data below the chart, where search engines index it with the store page.
FAQ
Embedding charts in Shopify: FAQ
Answers to common questions about adding InstaCharts charts to Shopify.
Can each Shopify product have its own chart?
Yes. Store each product's Embed URL in a product metafield, then add a Custom Liquid section to the product template with an iframe whose src is the metafield, such as {{ product.metafields.custom.chart_url }}.
Where can I put a chart in a Shopify store?
Any template that supports sections, such as the home page, pages, product pages, collection pages and blog posts. Online Store 2.0 themes support sections on every template.
Does an embedded chart update when my data changes?
Yes. The embed loads the chart from InstaCharts each time the page opens, so changes to the chart and new data from a synced Google Sheet, a web link or Zapier show up with no new embed code.
Is it free to embed a chart?
Yes. The free plan includes 200 share and embed views a month, and free charts show an InstaCharts watermark. Paid plans remove the watermark and raise the limit to 1,000 views a month on Starter and 100,000 on Pro.
Can I embed a data table or a dashboard?
Yes. Turn on Full Dataset or Plotted Data in the Settings tab of the Share dialog to add sortable table views to the chart embed. Dashboards have their own Share dialog with an Embed URL and Embed Tag.
Can I see where my chart is embedded?
Yes, on paid plans. The Analytics tab of the Share dialog counts embed views apart from share link views and lists the top pages that load the chart.
Want the full reference?
Read the embed charts documentation for sizing, the embed toolbar, SEO options and domain whitelisting.
Explore
Embed a chart on another platform
Step by step guides for every website builder and app InstaCharts covers.
- Embed a Chart in Notion
- Embed a Chart in WordPress
- Embed a Chart in Webflow
- Embed a Chart in Wix
- Embed a Chart in Squarespace
- Embed a Chart in Ghost
- Embed a Chart in Bubble
- Embed a Chart in Google Sites
- Embed a Chart in Framer
See which embed code each platform needs on the embed a chart page.
Make a chart for your Shopify page
InstaCharts makes data visualization easy, so you can build clear reports without design experience.