
charts
Quickly visualize your data with beautiful charts
Choose between 15 main chart types, a datatable and variants including donut, waterfall, semi circle and needle gauge charts.
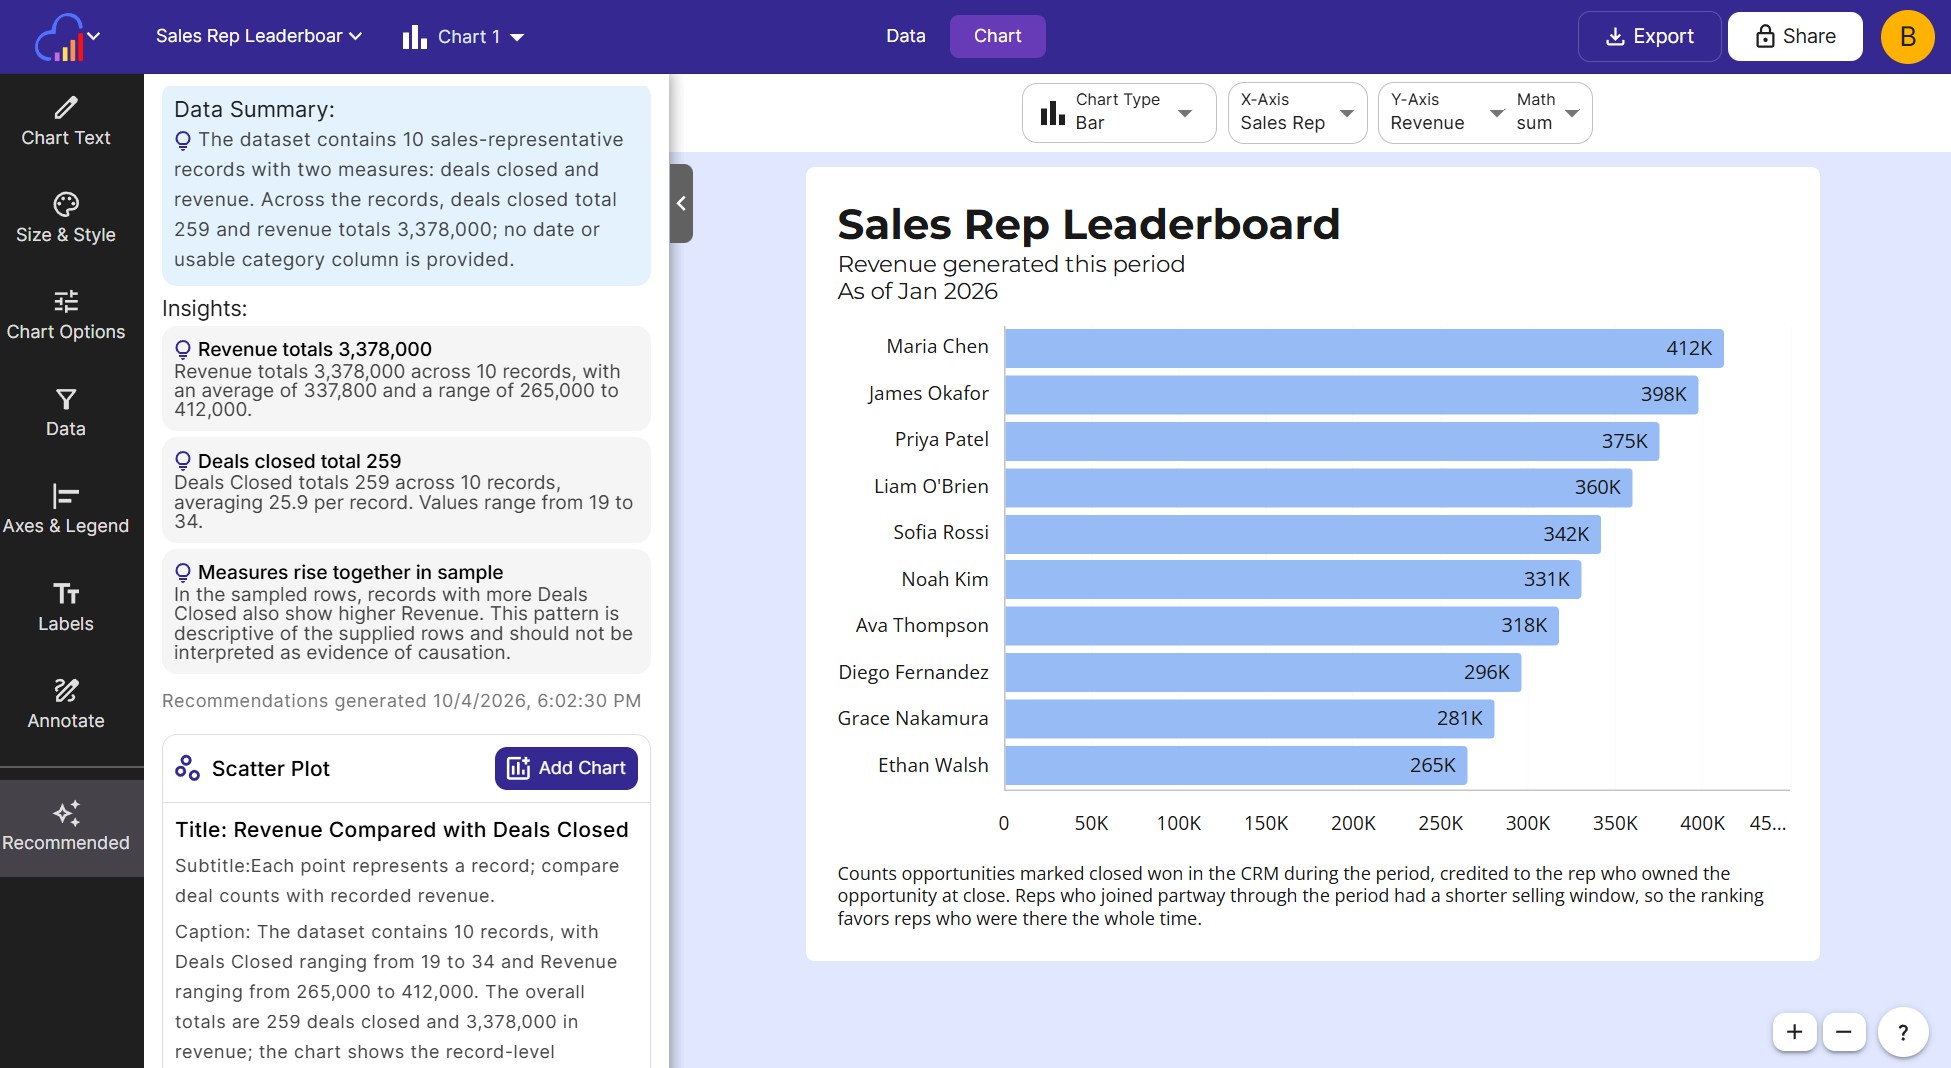
Chart types
See every chart type in action
Each chart below is a live, interactive InstaCharts embed, the same kind you can add to WordPress, Webflow, Squarespace or any HTML page. Select a chart type to load it, then hover over the chart to see its tooltips.
Features
Many charting features to simplify your processes
InstaCharts is a powerful data visualization tool.
Quickly explore your data
A chart recommendation engine sets up each chart based on your data automatically
Annotations & Trend Lines
Add text & highlight important points in your chart via annotations. Add a custom value, average, or best fit trend line.
Limit Items
Make a top 5 chart. Choose to limit how many items are charted from the dataset to the largest or smallest items.
Bin Ranges
Automatically add bins or ranges of numeric values to create a more effective chart
Update Your Data
Have a newer version of your spreadsheet? Update the sheet with a file from your device to overwrite the data, add rows or add columns. Your charts keep their settings and show the new numbers.
Share Analytics
See how many people viewed each shared chart, how many loaded it as an embed, and which pages on the web are showing it. Download any analytics table as a CSV.
Chart editor
Customize every part of your chart
The chart editor groups every setting into clear panels, so you can find the control you need quickly.
Data Labels
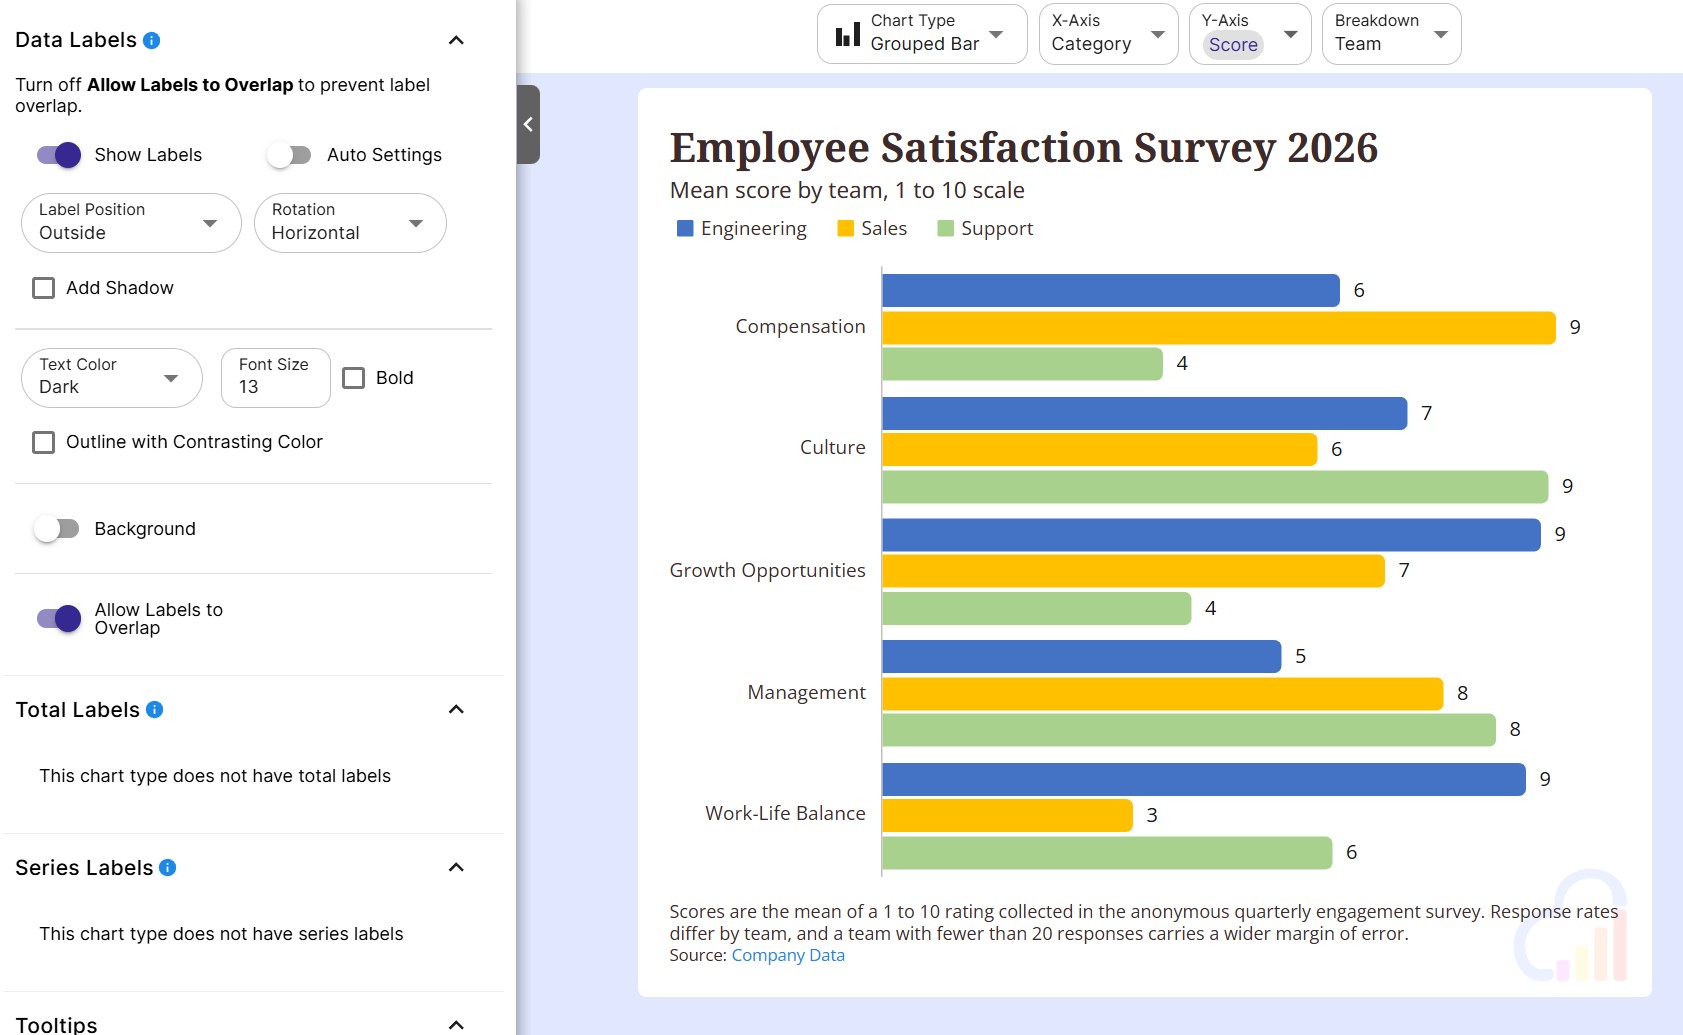
Show each value on the chart, add totals to stacked bars and label each series on grouped line charts.
Number Formatting
Format values as currency, percentages or abbreviated numbers such as 1.2k and 3.4m.
Chart Type Options
Switch to horizontal or 100% stacked bars, smooth your lines, or turn a donut into a semi circle.
Colors
Chart themes, color palettes and branding
Style a chart in one click with a built-in theme, then match it to your data and your brand.
10 Chart Themes
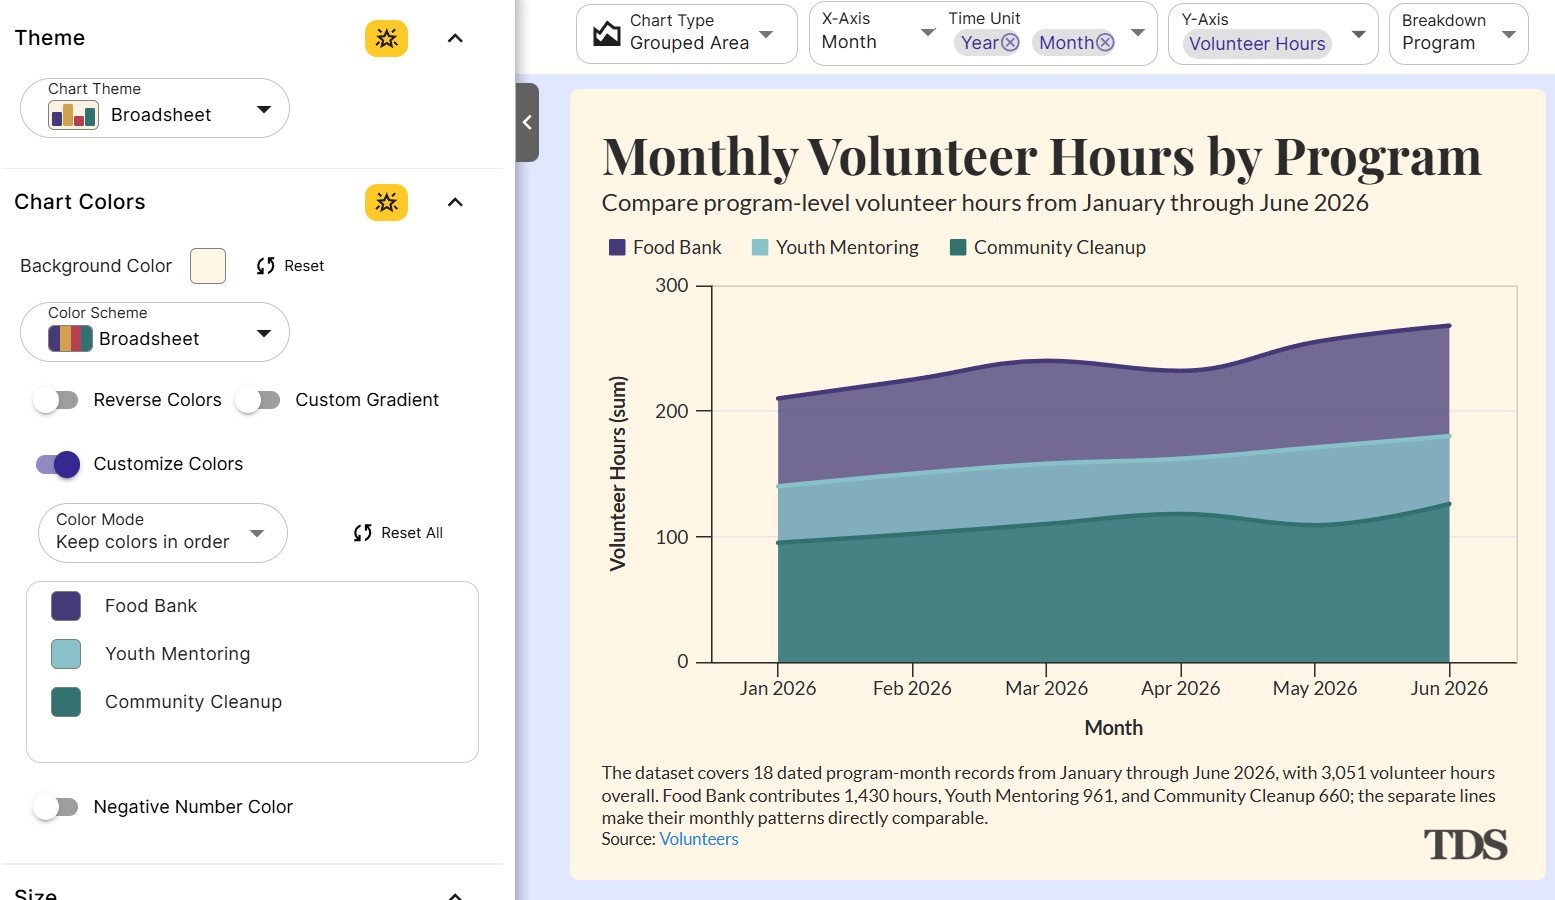
Set the background, colors, fonts and grid style at once with themes such as Midnight, Broadsheet and Financial.
39 Color Palettes
Pick categorical, sequential, diverging or cyclical palettes such as Tableau, Viridis and Spectral.
Branding
Use your brand colors and add logos, images and watermarks with image annotations.
Context
Charts that explain your data to readers
Give every chart a clear headline, a cited source and the statistics behind its trend line.
Auto Titles
InstaCharts writes a title and subtitle from the trends, percent changes and leading categories in your data.
Caption & Source
Add a caption, source text and a source link so readers see where the numbers come from.
Trend Line Statistics
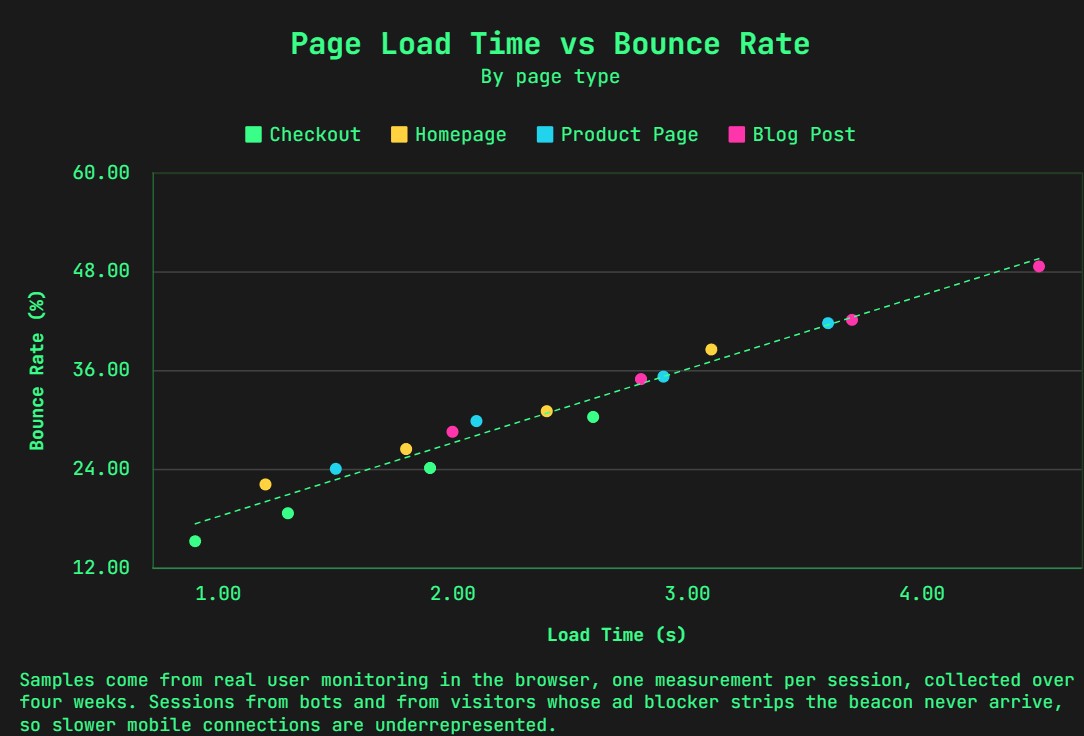
Write the equation, R², r and n of a line of best fit into the chart caption.
FAQs
Chart Maker FAQs
InstaCharts offers 15 main chart types plus a sortable and filterable data table. Create line charts, bar charts, area charts, scatterplots, pie charts, donut charts, semi circle donut charts, radar charts, heatmaps, mekko charts, waterfall charts, gauge charts and grouped gauge charts. Line, bar, area and scatterplot charts also come in grouped versions, and bar and area charts include stacked and 100% stacked versions.
Upload a CSV, Excel, TSV, PSV, JSON or JSON Lines file, connect a Google Sheet, or type your data in by hand. InstaCharts detects numbers, currencies and dates in your columns, and the chart recommendation engine sets up charts for your data automatically. From there you can change the chart type, axes, colors and text at any time.
Use a bar chart to compare categories, a line chart to show a trend over time, a pie or donut chart to show parts of a whole, a scatterplot to show the relationship between two numbers, and a gauge chart to show one number against a goal. When you upload a sheet, InstaCharts looks at your column types and recommends the charts that fit your data best, so you can start from a good match and switch types with one click.
Yes. A gauge chart adds up or averages a column and shows the result on a dial, drawn as a filled arc or a needle with tick marks. Set a Min, Max and Target to match your goal, such as a sales quota or a 1 to 5 rating. A grouped gauge chart draws up to 10 progress rings on one chart to compare teams, regions or campaigns.
Yes. Apply one of 10 built-in chart themes to set the background, colors, fonts and grid style in one click, then fine-tune any part of it. You can pick your own color scheme and choose Google Fonts for the chart title, subtitle and axis titles.
InstaCharts includes 10 chart themes: Classic, Midnight, Studio, Broadsheet, Neon, Ember, Financial Light, Financial Dark, Pastel and Code. Midnight suits dark social feeds, Broadsheet looks like a newspaper data graphic, and the Financial themes are designed for market data.
Use a categorical palette such as Tableau or Excel when each color stands for a different category, a sequential palette such as Viridis or Blues when values run from low to high, and a diverging palette such as Spectral when your data has a midpoint like zero or a target. InstaCharts includes 39 color palettes across these groups, plus a cyclical Rainbow palette for repeating data such as months.
InstaCharts includes 39 color palettes. There are 19 categorical palettes such as Tableau, Tableau 20, Excel, Observable, Paired, Bold, Executive and Pastel, 11 multi-hue sequential palettes such as Viridis, Magma, Plasma, Blue Purple and Gold Red, and single-hue palettes in Blues, Greens, Purples, Reds, Teals and Warm Grays. The Spectral and Red Yellow Green palettes are diverging, Rainbow is cyclical, and palettes such as Midnight, Studio, Broadsheet, Neon, Ember, Financial and Code match the built-in chart themes.
Yes. Add images, logos and watermarks to any chart with image annotations, and set the chart colors to match your brand. Branded charts are ready to drop into reports, presentations, social posts and websites.
Open the chart editor and add a trend line based on a custom value, the average of your data, or a line of best fit. Use text annotations to label and highlight the important points in your chart so readers see the key takeaway right away.
When you add a line of best fit, InstaCharts can write its equation, R², r and n into the chart caption. R² ranges from 0 to 1 and shows how much of the movement in your data the line explains, where 1 is a perfect fit. The r value shows the strength of the relationship and keeps its sign, so a negative r means one value falls as the other rises. The n value is the number of points used to draw the line.
Yes. Turn on Auto Titles and InstaCharts writes a title and subtitle based on your data. It looks for trends, percent changes, high variation and categories that lead the rest, then writes an insight-driven headline such as 'Sales Increases 80% Over Quarter'. Turn Auto Titles off at any time to write your own title and subtitle.
Add a caption under the chart, along with source text and a source link to the original data. A cited source helps readers see where the numbers come from and makes your chart easier to reference in reports, articles and presentations.
Open the Labels panel in the chart editor and turn on data labels to show each value directly on the chart. You can change the label position, rotation, opacity and padding, and outline labels in a contrasting color. Stacked bar charts can also show total labels, and grouped line and area charts can show series labels.
Yes. Choose which extra columns appear when a viewer hovers over a point. Turn on shared tooltips to compare every series at once, make tooltips transparent, or have them follow the pointer.
Rename the axis titles in the chart editor and control the axis labels with rotation, label interval, label width and maximum lines to keep long category names readable. You can also set a custom minimum and maximum for any numeric axis.
Open the Axes & Legend panel and choose a number format for each axis. InstaCharts supports currency, percentages, abbreviated numbers such as 1.2k and 3.4m, accounting style negatives, ordinals and custom formats. Set the number and currency locale in the Chart Text panel to match the separators and currency symbol your audience uses.
Create a bar chart, then open the Chart Options panel and turn on Horizontal Bars. Horizontal bar charts work well for long category names and ranked lists. In the same panel you can also normalize stacked bars to 100%, turn the bars into a waterfall, round the corners and set a custom bar width.
Create a donut chart, then open the Chart Options panel and turn on Semi Circle. Use the donut inner size setting to make the ring thicker or thinner. Semi circle donut charts are a popular choice for progress, budget and election style charts.
Line and area charts let you smooth the lines, show or hide markers, change the line width and adjust the fill opacity of the area. Heatmaps can fill empty cells with zero so every cell shows a value. Every chart type also lets you adjust the opacity of grid lines, axis lines and tick marks, and add a plot border or plot shadow.
Open the Data panel and add a filter or a column filter. Column filters support conditions such as contains, equals, not equal, greater than, less than, between and is blank. You can also remove blank values and zeros from a chart, and limit the chart to the largest or smallest items.
Use the limit items setting to chart only the largest or smallest items in your dataset, for example the top 5 or top 10 products by sales. Sort the chart by value to rank the categories from highest to lowest.
Turn on auto sort, or sort the X-axis, the Y-axis and the legend series yourself to put your categories in the order that best tells the story of your data.
Bin ranges group numeric values into ranges, such as ages 20 to 29 and 30 to 39, so you can see how your data is distributed. InstaCharts can add bins to a numeric column automatically to create a clearer chart from raw numbers.
Update the sheet your chart is built on with a newer file from your device. You can overwrite the data, append new rows or add new columns, and every chart on that sheet keeps its settings and shows the new numbers. Charts made from Google Sheets stay in sync and update automatically when the spreadsheet changes.
Yes. Export charts as PNG, SVG, JPG, WebP, PDF and PowerPoint files, and export the chart data as CSV, Excel, TSV or JSON. Share a chart with a public link, or copy the embed code into WordPress, Webflow, Squarespace or any HTML page to show an interactive chart on your website.
Yes. Paid plans include share analytics for every shared and embedded chart. See total views, views over the last 30 days, a day by day or month by month trend, and the top pages on the web that are loading your embeds. Every analytics table can be exported to CSV, and individual visitors stay anonymous.
Yes. The free plan lets you create and export charts with every chart type, up to 500 rows of data per sheet, and charts include a small watermark. Paid plans starting at $10 per user per month remove the row limit and the watermark.
Craft professional charts in seconds
InstaCharts makes data visualization easy, so you can build clear reports without design experience.