
dashboards
Build Live Dashboards from Your Spreadsheets
Combine charts, data tables, KPI and text widgets into one shareable dashboard. No code required.
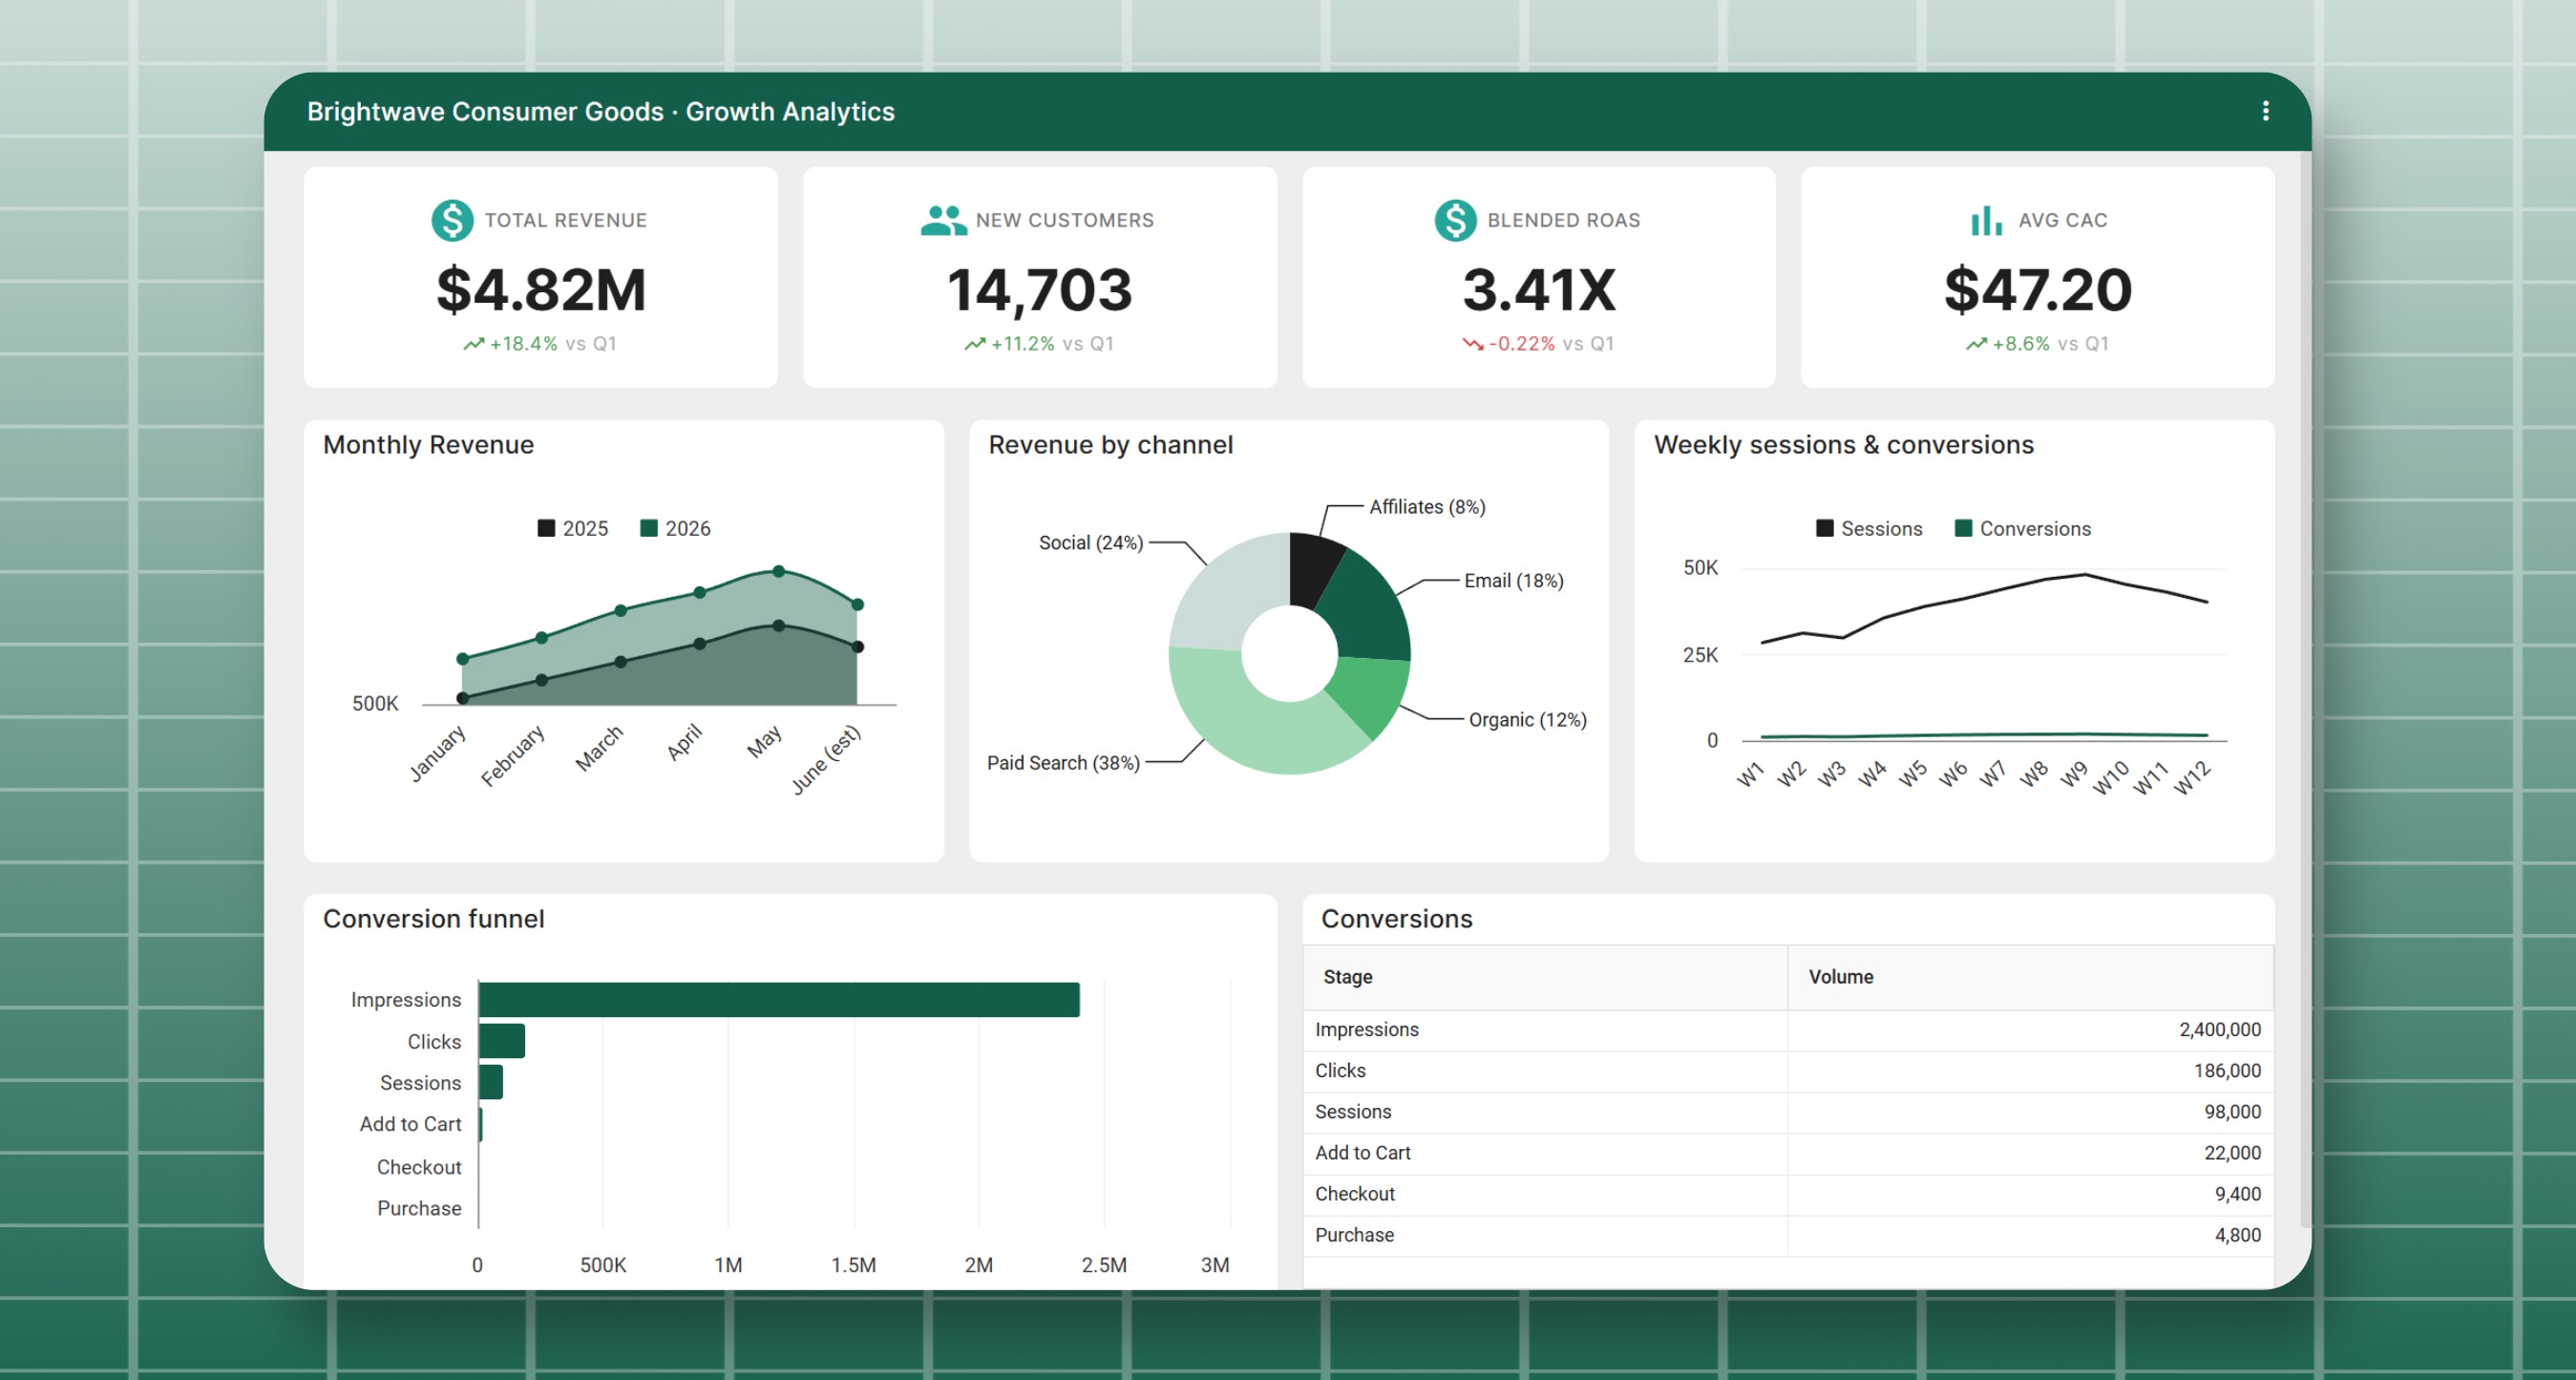
Widgets
All your data in one view
Four widget types bring your charts, tables, metrics and commentary together on one page.
Chart Widgets
Add any chart type and edit it in place with the full chart editor.
Data Table Widgets
Show sortable tables next to your charts with only the columns you pick.
KPI & Text Widgets
Call out headline numbers with a trend, and add notes and takeaways in rich text.
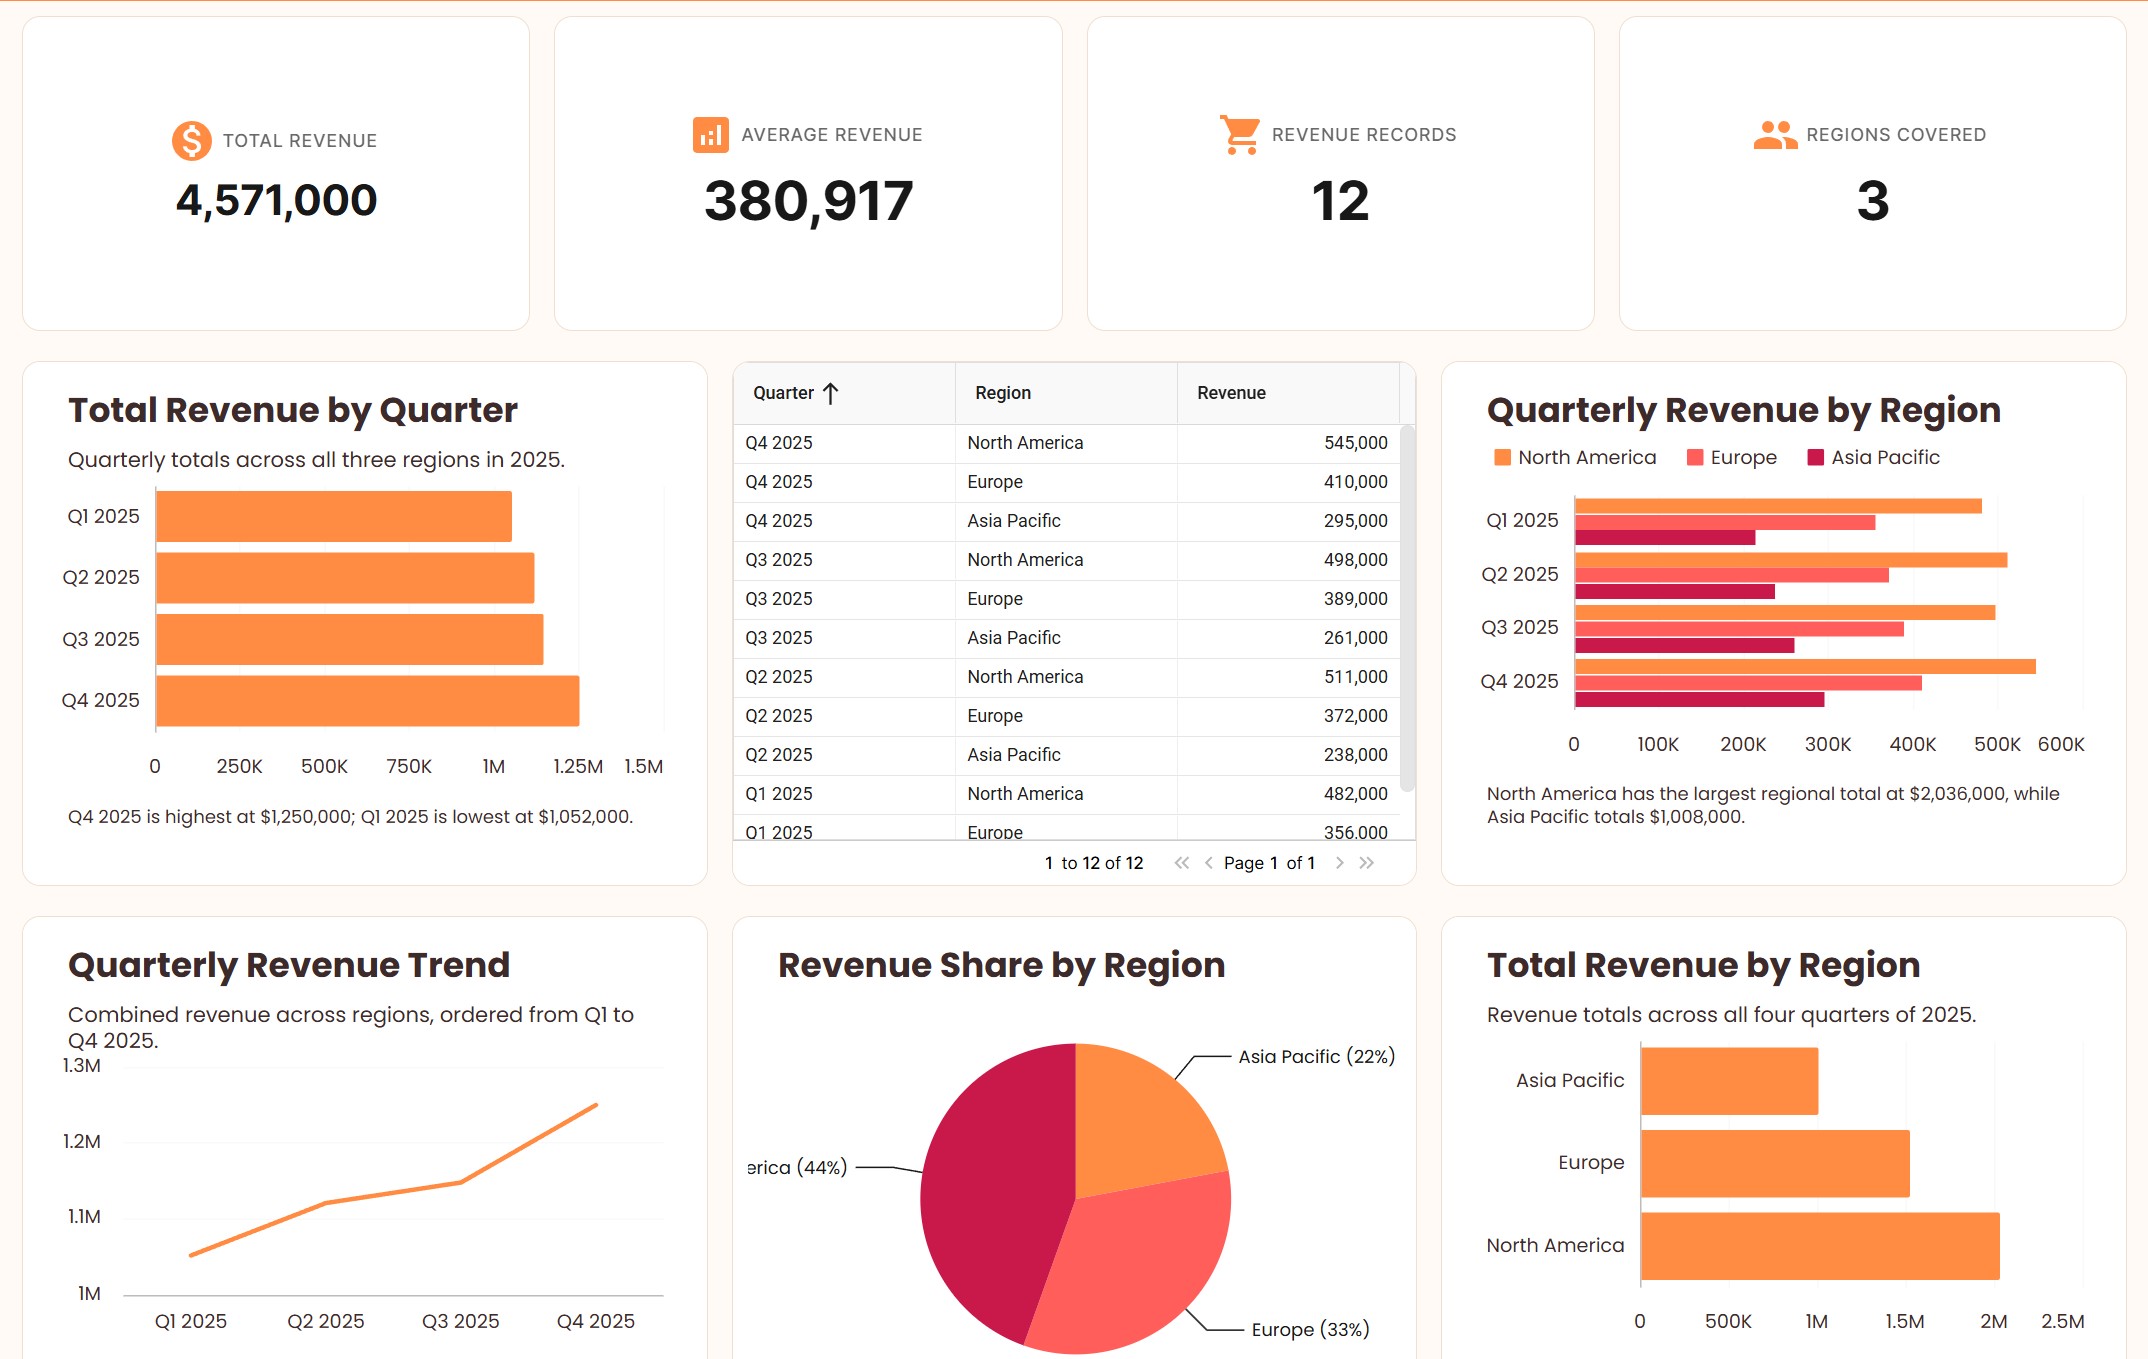
Features
Everything You Need on One Dashboard
Build faster with AI, let viewers filter the data, and share the result wherever your audience is.
Build with AI
Describe the dashboard you want and AI adds the widgets and filters for you. Ask it to edit an existing widget too, all from a single prompt bar.
Slicers
Add slicers to the dashboard header so viewers can filter every chart and data table built from the same sheet by a value, a list or a range.
Dashboard Pages
Split a large dashboard into pages with a sidebar of page buttons. Each page holds its own widgets and slicers, with an optional icon.
Flexible Sharing
Keep dashboards private, share them with your workspace or specific users, or share them publicly with a link.
Embed on Your Website
Copy the embed URL from the share dialog to place a live, interactive dashboard on any webpage.
Dashboard Analytics
See how many people opened your shared dashboard, day by day or month by month, and which pages link to it. Export any table to CSV.
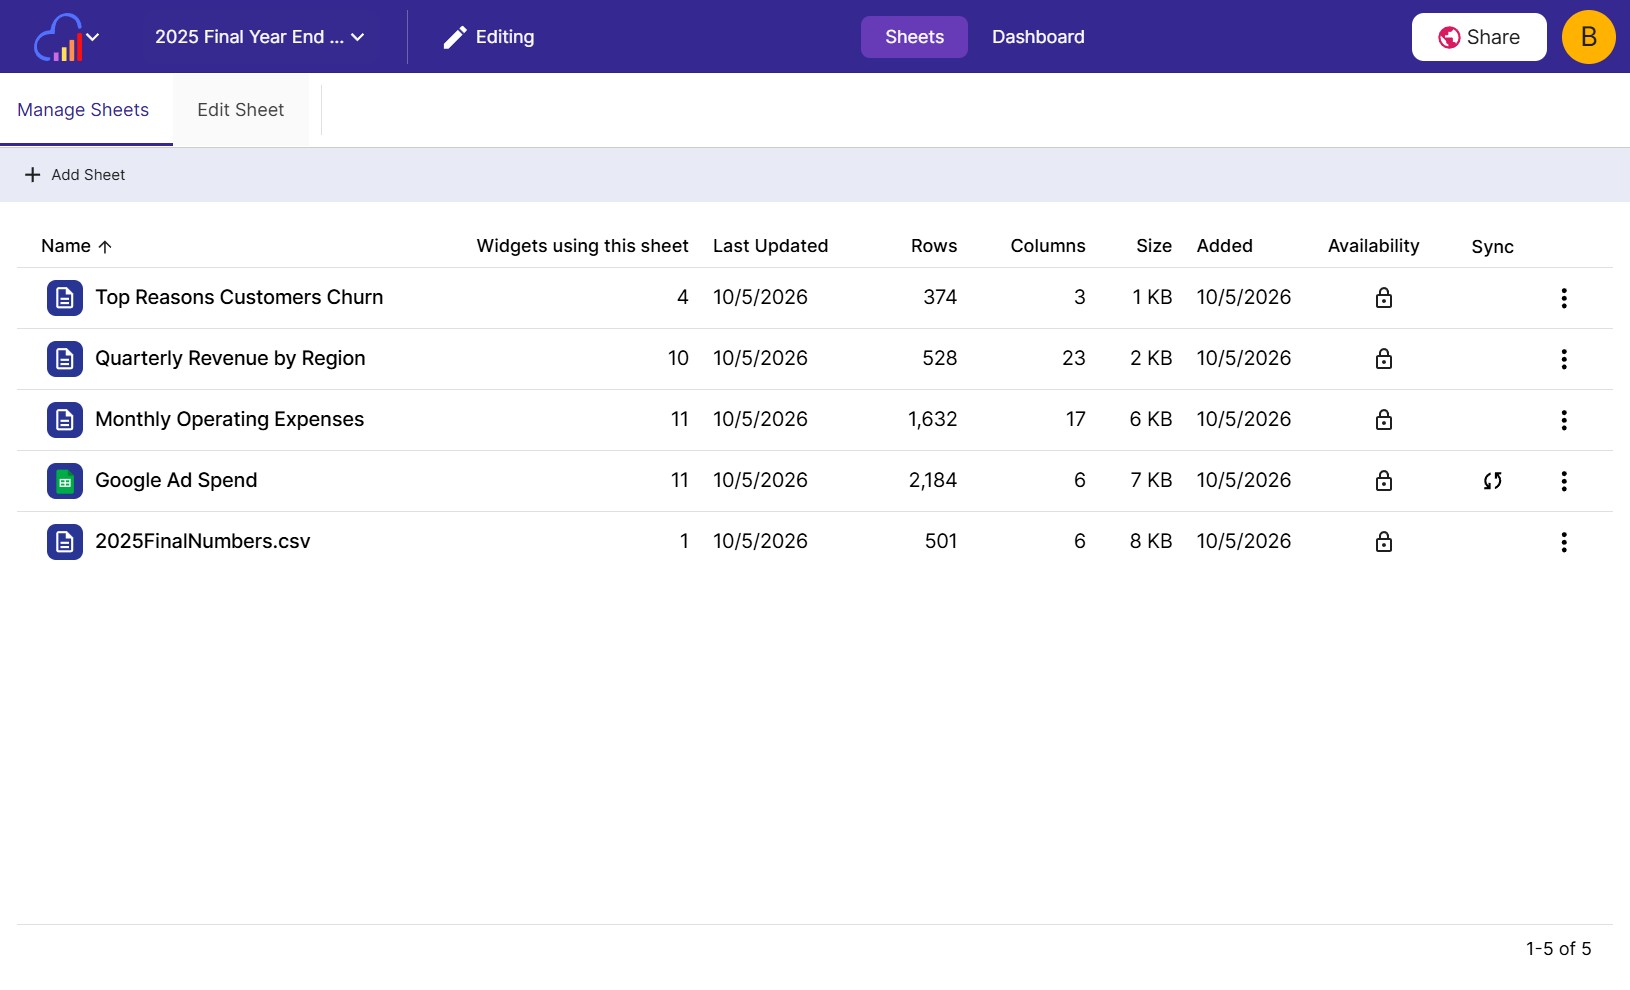
Data
Build from one sheet or many
Each widget can read from its own sheet, so one dashboard can summarize all of your spreadsheets.
Multiple Sheets
Add a new sheet for this dashboard only, or pick an existing sheet from your workspace.
Edit the Data in Place
Switch to the Sheets view to edit cells, add rows and transform the data behind your widgets.
Always Up to Date
Sync from Google Sheets or update a sheet with a newer file, and every chart and table refreshes.
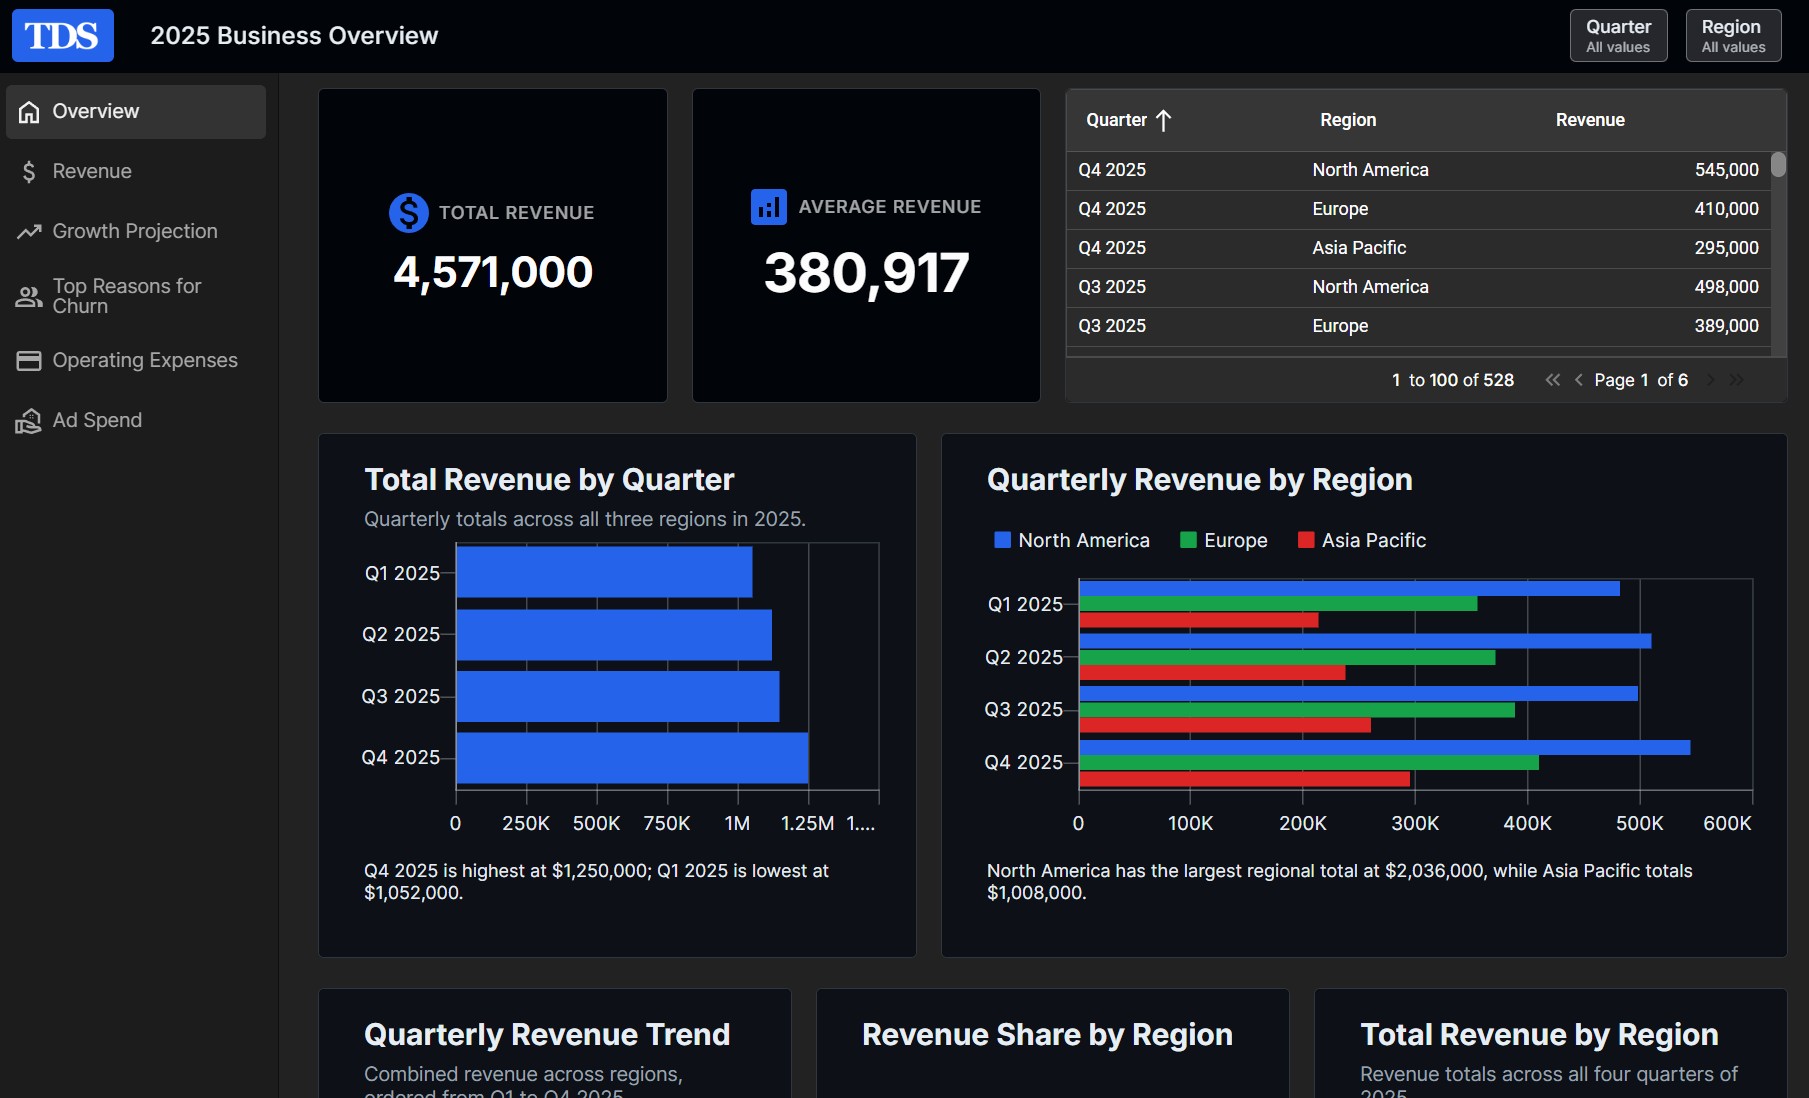
Design
Dashboard themes and branding
Give every dashboard a polished, consistent look that matches your brand in a few clicks.
10 Dashboard Themes
Restyle every widget at once with themes such as Executive, Studio, Midnight and Financial.
Customize Theme
Set your own header, page and chart colors, widget borders and corner radius.
Your Logo
Add your logo to the dashboard header and set its size, padding and side.
Layout
Arrange your dashboard your way
Lay out widgets in rows and size each one to fit the story your data tells.
Drag and Drop
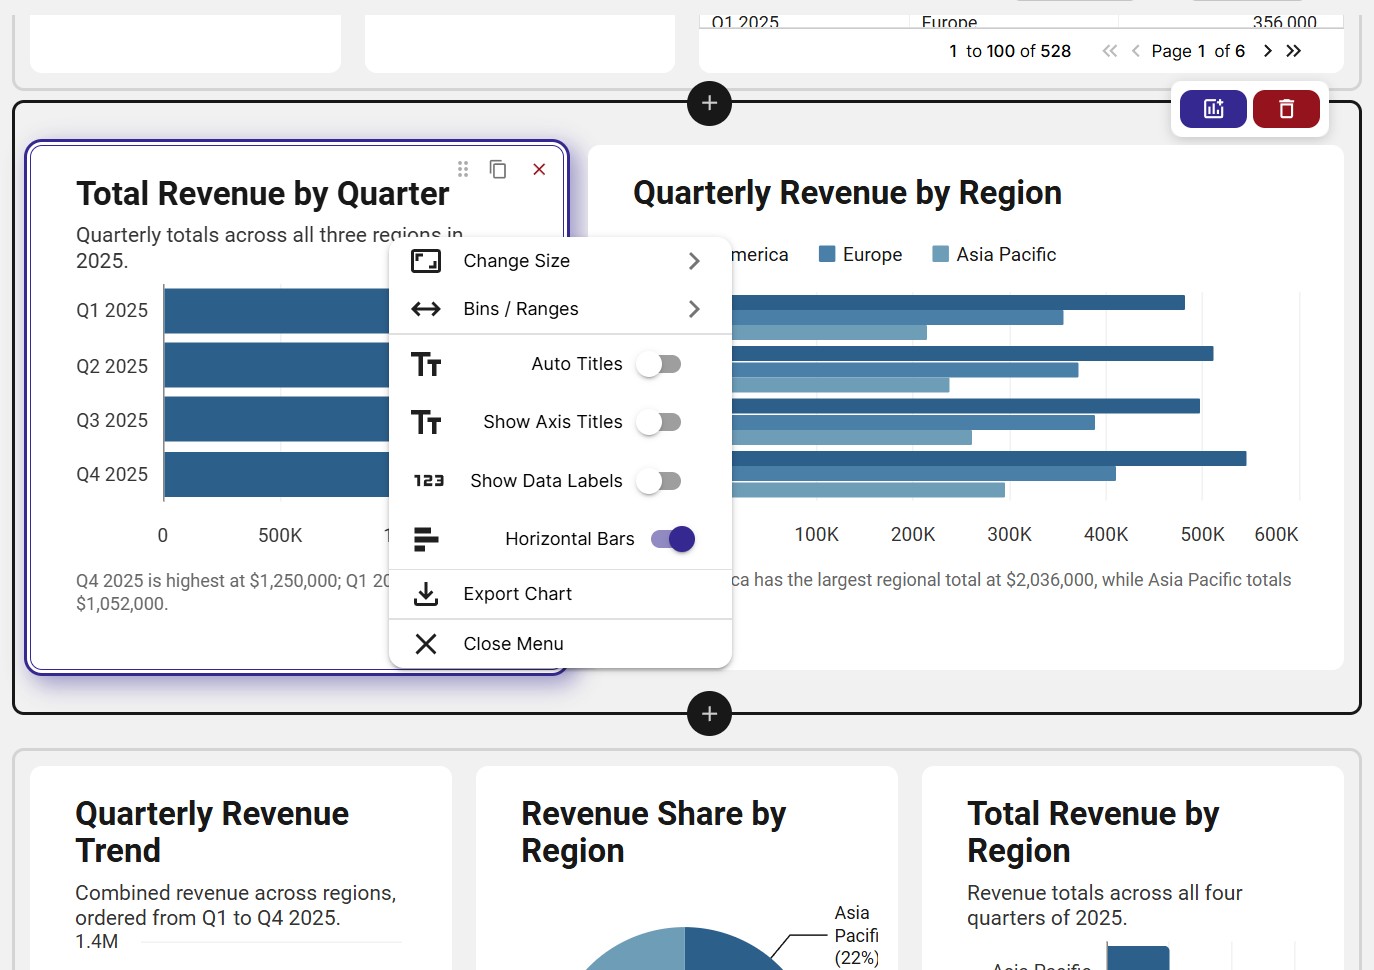
Move widgets between rows, add new rows and duplicate a widget with one click.
Widget Size & Style
Set the width, height and background color of each widget.
Responsive on Every Screen
Dashboards adapt to phones, tablets and desktops, so viewers can check in from anywhere.
FAQs
Dashboard FAQs
An InstaCharts dashboard is a single page that combines charts, data tables, KPI widgets and text widgets built from your spreadsheet data. It gives you and your audience one live view of the numbers that matter, organized in rows you arrange yourself.
Upload your Excel, CSV, TSV, JSON or Google Sheets data to InstaCharts, create the charts and data tables you want, then add them to a new dashboard as widgets. You can also describe the dashboard you want in the AI prompt bar and let AI add the widgets for you.
InstaCharts dashboards support four widget types. Chart widgets show any InstaCharts chart type, including gauge charts that show a KPI against a goal, data table widgets show sortable and filterable tables, KPI widgets highlight headline metrics, and text widgets add titles, commentary and context.
Yes. Select a chart widget and the full chart editor opens beside the dashboard, with the same Chart Text, Style, Chart Options, Labels and Limit Items panels you use for a single chart. Change the chart type, axes or colors and see the result on the dashboard right away.
A KPI widget shows a headline metric as a large, easy to read number. You enter the value and label yourself, and you can add an overline with an icon and color, plus an optional trend percentage and period, such as +12% vs last month, to show the direction of the metric.
Yes. When you add a data table widget, pick the columns to show, or use Select All and Remove All to change them quickly. You can change the shown columns at any time from the widget settings.
Yes. Each widget can be backed by a different sheet, so one dashboard can summarize several spreadsheets at once and you can skip merging files first. Add a new sheet that belongs to the dashboard only, or pick an existing sheet from your workspace.
Yes. Use the Sheets and Dashboard toggle at the top of the dashboard to switch to the sheets it uses. From there you can edit cells, add rows and columns and transform the data, then switch back to see the widgets update.
Yes. Every dashboard has an AI prompt bar. Describe what you want, for example "design a dashboard for me" or "add a table of orders", and AI adds the matching widgets and filters. It can also edit widgets already on the dashboard. Each request uses 1 AI credit.
Slicers are filters that sit in the dashboard header. Add a slicer for a column, and viewers can pick values from a list or set a value or range for numbers and dates. Every chart and data table on the page that is built from that sheet updates to show only the matching rows. A viewer's slicer choices last for their visit and leave the saved dashboard unchanged.
Yes. Turn on Enable pages under Dashboard Settings and Pages to add a sidebar of page buttons. Each page holds its own widgets and slicers, and you can give each page a title and an optional icon. If you turn pages off later, every widget moves back onto a single dashboard.
Widgets sit in rows. Drag a widget to move it, use the plus buttons to add a new row, and duplicate a widget with one click. Set the width and height of each widget and give it its own background color, or keep the theme background.
Yes. Choose from 10 dashboard themes in Dashboard Settings under Appearance: Minimal, Executive, Studio, Midnight, Broadsheet, Neon, Ember, Financial, Pastel and Code. Apply the theme to every widget at once, then turn on Customize Theme to set the header color and size, page color, widget borders, corner radius and chart colors. Dashboards are responsive, so they display well on phones, tablets and desktops.
Yes. Paid plans can add a logo to the dashboard header. Choose which side it sits on, and set the logo size, padding and background.
Paid plans can share a dashboard with everyone in the workspace, with specific users, or publicly through a link. On the free plan, dashboards are private to you.
Yes. Once a dashboard is shared, the share dialog gives you a full page dashboard URL and an embed URL. Place the embed in a webpage to show the live dashboard on your own site.
Yes. Paid plans include share analytics for dashboards. Open the Analytics page in your workspace, or the Analytics tab in the dashboard share dialog, to see total views for all time, views over the last 30 days, the first and most recent view, a day by day or month by month breakdown, and the pages that link to your dashboard. Every table can be exported to CSV, and individual visitors stay anonymous.
Yes. Charts and data tables on a dashboard always show the latest version of their sheet. When a sheet is connected to Google Sheets or Google Drive, a sync schedule keeps the data current, and changes flow through to every chart and data table on the dashboard.
Update the sheet the dashboard reads from. Right click the sheet in your Workspace and choose "Update Data", or open the sheet and choose "Update Sheet Data" from the sheet menu, then pick a file from your device. You can overwrite the sheet, append new rows or add new columns, and the charts and data tables on every dashboard using that sheet show the new numbers. KPI and text widgets hold values you enter yourself, so they stay as you wrote them.
Yes. Copy a dashboard from your workspace to reuse its layout, theme and widgets as the starting point for a new report, such as next quarter's version of the same dashboard.
Yes. The InstaCharts dashboard builder is fully no-code. Add widgets, arrange them with drag and drop, pick a theme and share the result, all with clicks or a single AI prompt.
Build Your First Dashboard Today
InstaCharts makes data visualization easy, so you can build clear reports without design experience.