How to add a watermark to a chart
Learn how to add professional watermarks to your charts using InstaCharts' powerful image annotation feature in just four simple steps.

How to Add a Watermark to Your Charts: A Complete Guide to Image Annotations
Protecting your data visualizations and maintaining brand consistency has never been easier. In this comprehensive guide, you’ll learn how to add professional watermarks to your charts using InstaCharts’ powerful image annotation feature. Whether you’re creating charts for presentations, reports, or social media, watermarking ensures your work stays branded and protected.
Why Add Watermarks to Your Charts?
Before diving into the how-to, let’s explore why watermarking your data visualizations matters:
- Brand Protection: Watermarks help prevent unauthorized use of your charts and infographics
- Brand Recognition: Consistently watermarked charts reinforce your brand identity across all platforms
- Professional Appearance: A subtle watermark adds polish to your data visualization projects
- Content Attribution: Ensures proper credit when your charts are shared online
What You’ll Need
To add a watermark to your chart in InstaCharts, you’ll need:
- A paid InstaCharts account (watermarks are not available on the free plan)
- Your watermark image file (PNG format with transparent background works best)
- A completed chart ready for watermarking
Step-by-Step: Adding a Watermark to Your Chart
Step 1: Open your chart in InstaCharts
First, you’ll need to log in to your paid account and make your chart in InstaCharts.
For more info on making a chart from a spreadsheet, check out our full guide on importing files.
If your data is in Google Sheets, there is a guide on importing from Google Sheets.
Step 2: Upload & Add Your Watermark Image
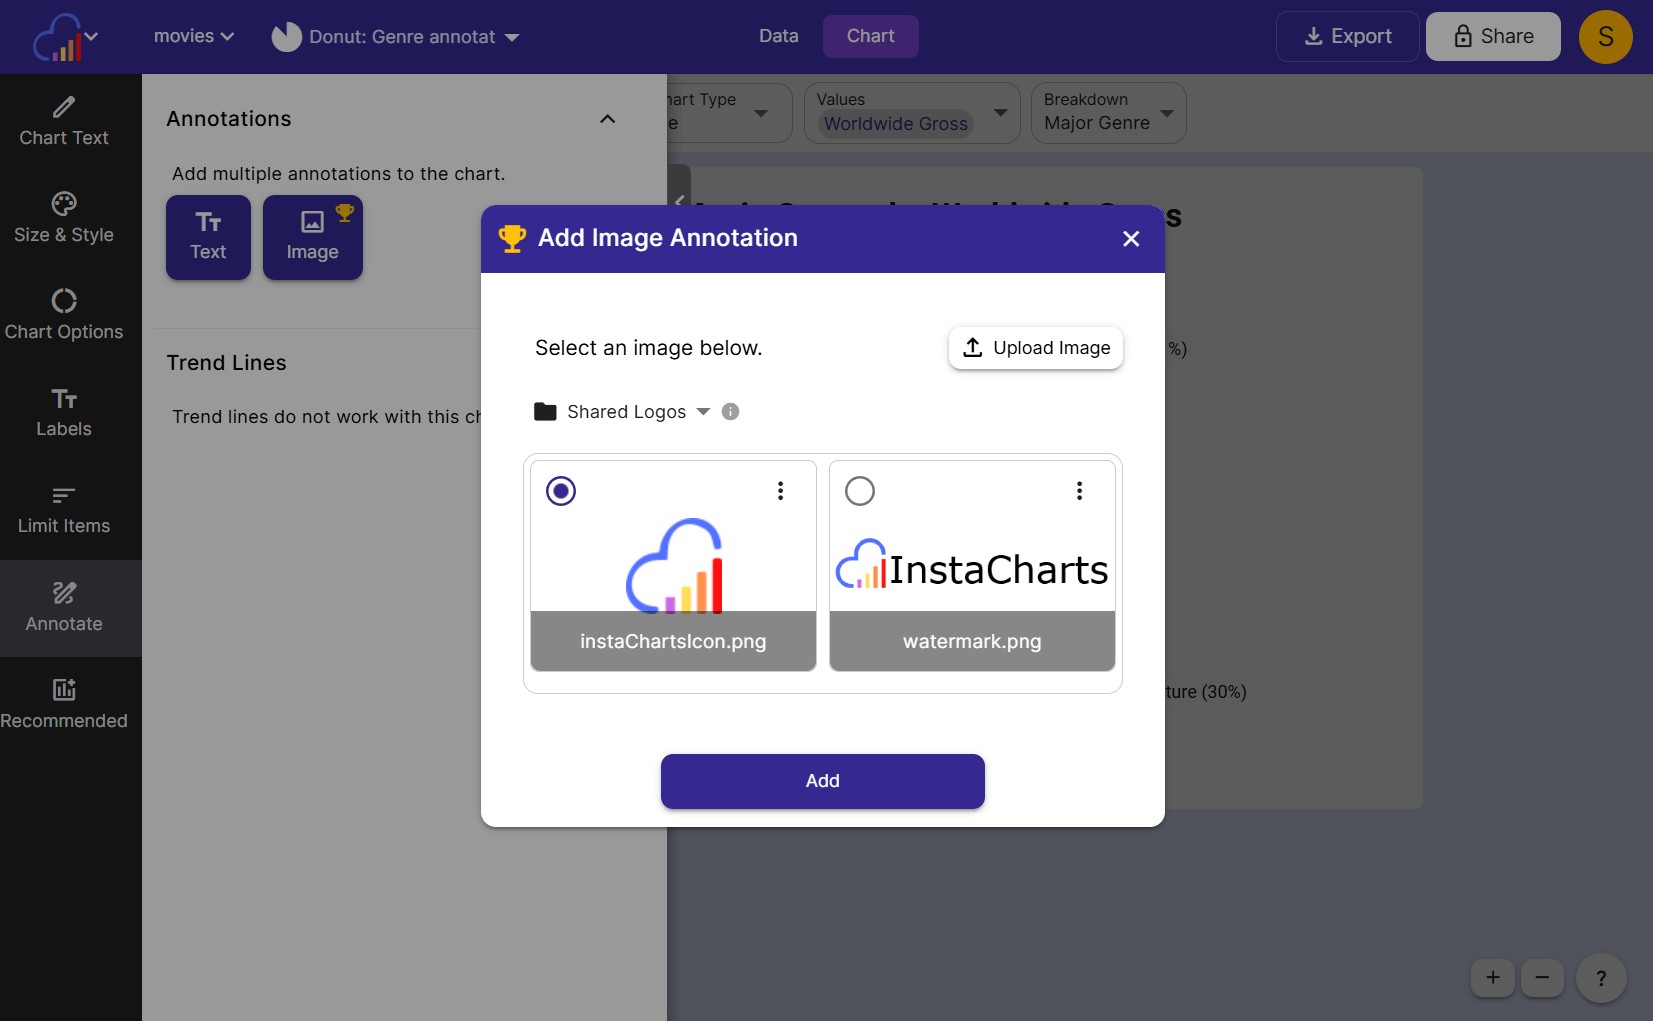
Next, you’ll need to upload your logo or watermark image to InstaCharts:
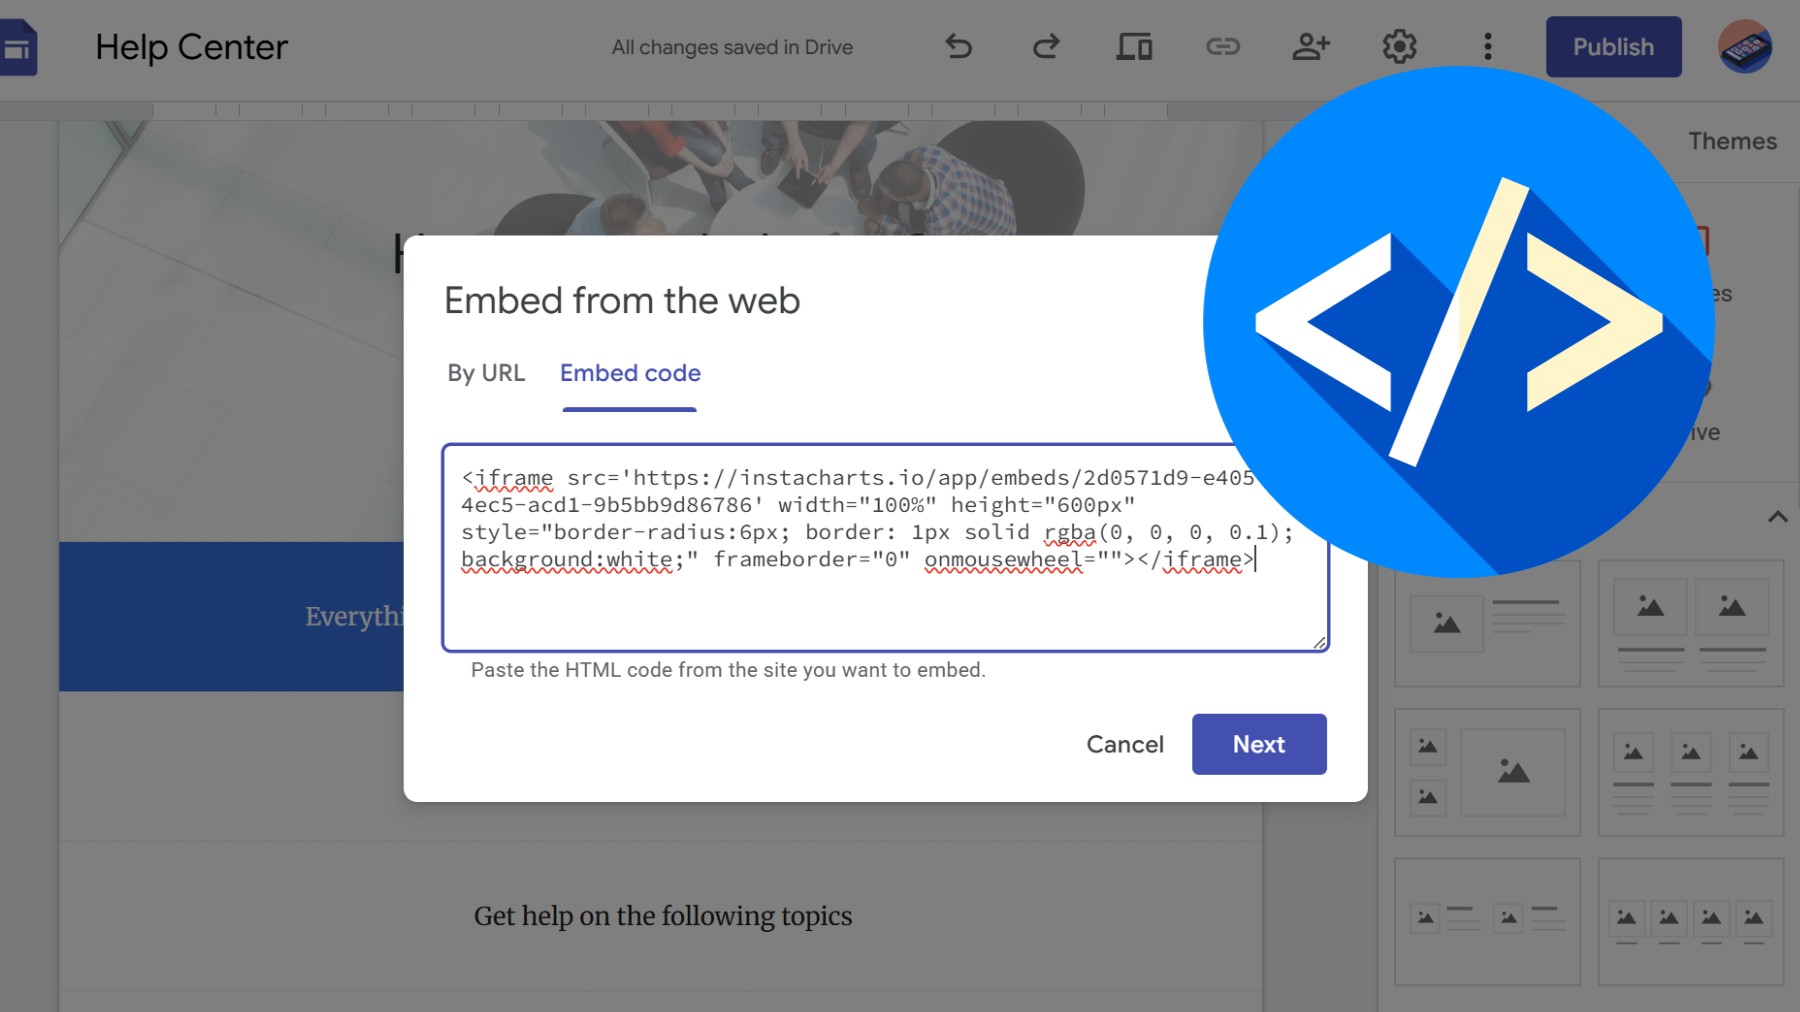
- From your chart, click the left sidemenu, click Annotations, then image annotation.
- Make sure the Shared Logos folder is selected, so we can reuse this image in other charts.
- Click Upload Image, then choose your watermark file from your computer
- Once your file is uploaded, it should appear in the image selector. Select your newly uploaded file, then click Add
Pro Tip: Use a PNG file with a transparent background for the cleanest watermark appearance on your charts.
Shared Logos is a part of your branding kit. InstaCharts allows you to save frequently used assets in your branding kit for quick access. This step ensures you can quickly apply your watermark to any chart without re-uploading each time.
Step 3: Position Your Watermark
Proper placement is crucial for an effective watermark:
- Click and drag your watermark to position it on your chart
- Common watermark positions include:
- Bottom right corner: Traditional and unobtrusive
- Bottom left corner: Alternative standard position
- Center: For maximum protection (use with very low opacity)
- Top corners: Less common but effective for certain chart types
- Resize the watermark by dragging the corner handles
- Keep it visible but not distracting, typically 10-20% of the chart size
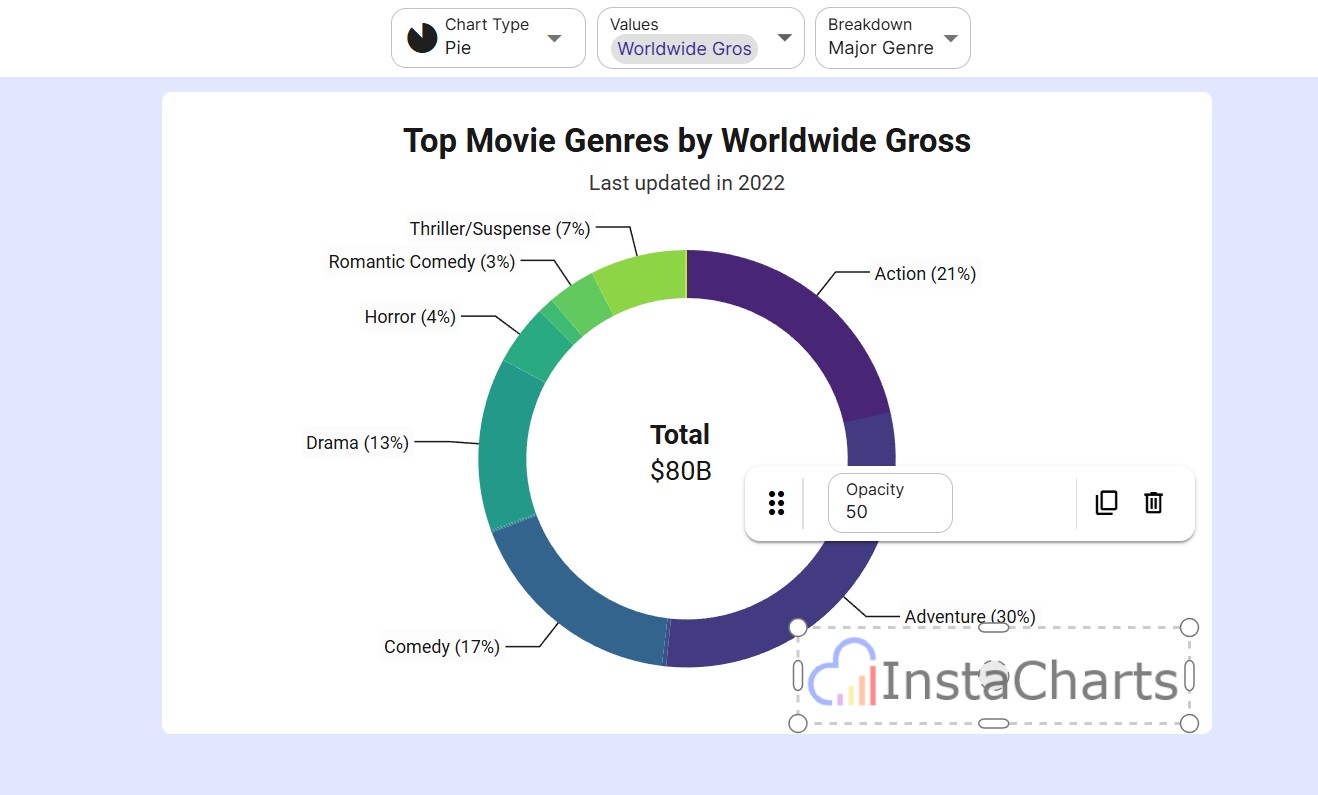
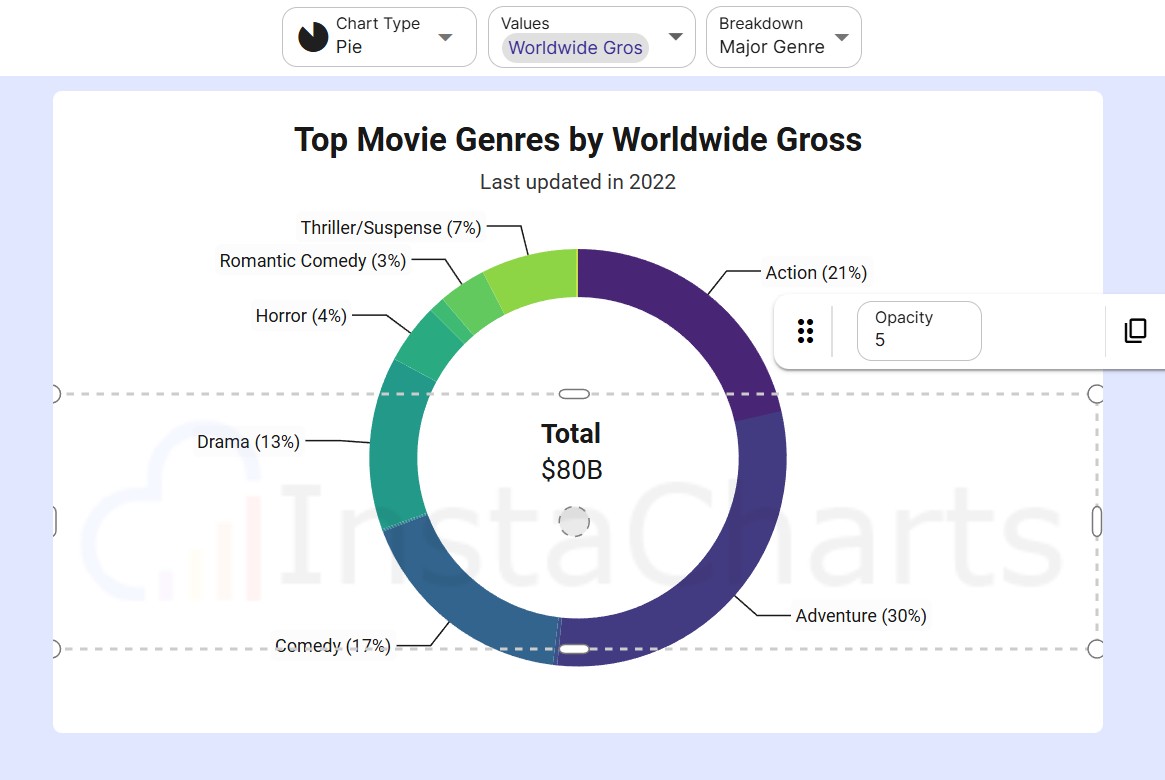
Step 4: Adjust Opacity to 50%
This is the key step that transforms your logo into a professional watermark:
- With your image annotation selected, locate Opacity in the pop up toolbar
- Adjust the opacity to 50% (or anywhere between 30-70% depending on your preference)
- Preview how the watermark looks against different chart elements
- Fine-tune the opacity until your watermark is visible but doesn’t interfere with data readability
Best Practice: A 50% opacity typically provides the perfect balance between visibility and subtlety, allowing chart data to remain the focal point.
Advanced Watermarking Tips for InstaCharts
Creating the Perfect Watermark Image
For best results when creating watermarks for your charts:
- Use vector formats when possible for scalability
- Keep it simple: Complicated designs become unclear at low opacity
- Monochrome works best: Single-color logos are most versatile across different chart backgrounds
- Consider contrast: Test your watermark on both light and dark chart themes
Opacity Settings Guide
Different opacity levels serve different purposes:
- 30-40% opacity: Very subtle, minimal brand presence
- 50-60% opacity: Standard watermark, visible but unobtrusive (recommended)
- 70-80% opacity: Strong brand presence, more protective
- 90-100% opacity: Full visibility, suitable for corner placements only
Common Watermarking Mistakes to Avoid
When adding watermarks to your charts and graphs, watch out for these pitfalls:
- Oversized watermarks: Don’t let your watermark overshadow your data
- Poor placement: Avoid covering critical chart elements like legends or data labels
- Too dark: High opacity watermarks can make charts look cluttered
- Inconsistent positioning: Place watermarks in the same spot across all charts for brand consistency
Use Cases for Watermarked Charts
Watermarks are particularly valuable when:
- Sharing charts on social media platforms
- Including visualizations in downloadable reports
- Publishing data-driven infographics
- Creating charts for client presentations
- Distributing market research findings
- Posting business intelligence dashboards online
SEO Benefits of Watermarked Charts
Beyond brand protection, watermarking your charts offers SEO advantages:
- Image attribution: Search engines can associate your watermarked charts with your brand
- Backlink opportunities: Others sharing your charts may link back to your site
- Brand visibility: Watermarked images that go viral increase brand recognition
- Content authenticity: Signals to search engines that you’re the original content creator
Conclusion
Adding watermarks to your charts using InstaCharts’ image annotation feature is a simple yet powerful way to protect and brand your data visualizations. By following these steps you’ll create professional, branded charts that represent your work wherever they’re shared.
Start watermarking your charts today and ensure your data visualizations always carry your brand identity.
With InstaCharts’ intuitive image annotation tools, protecting and branding your charts has never been easier.