How to make charts in Claude and ChatGPT
Connect your AI assistant to InstaCharts and build shareable, embeddable charts from a chat

Make charts from your AI assistant
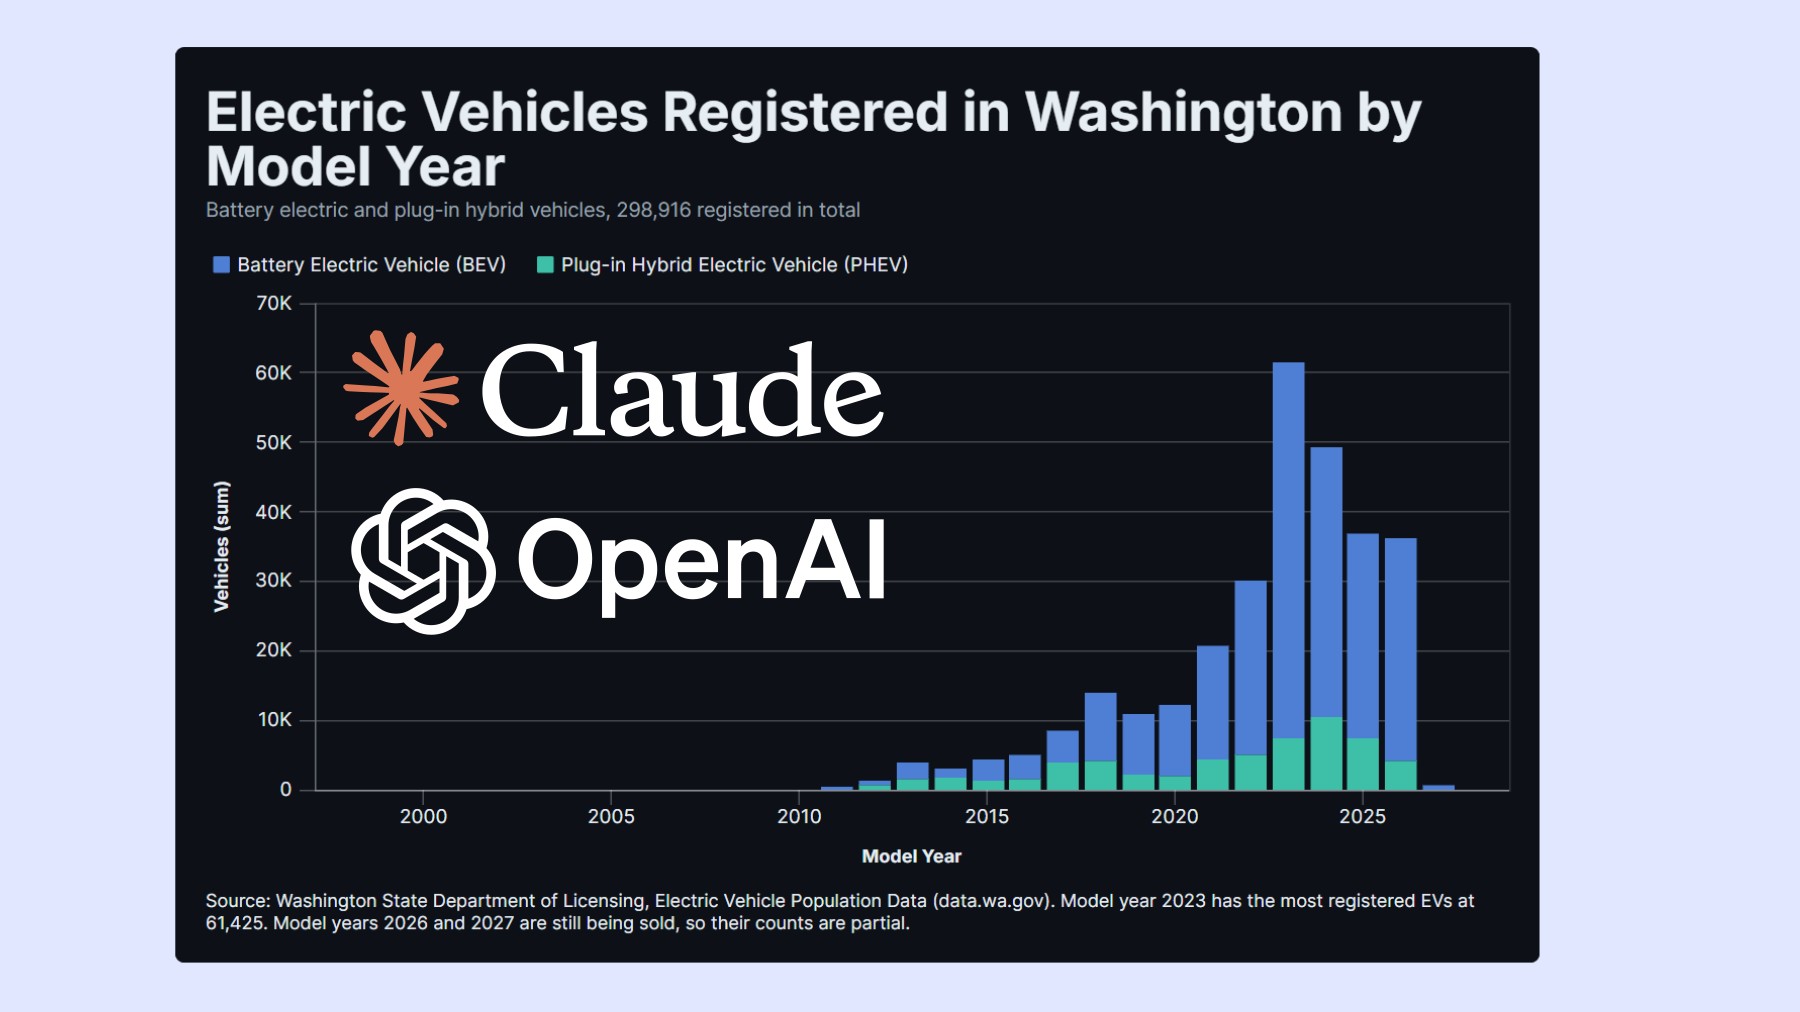
When you connect an AI assistant such as Claude or ChatGPT to InstaCharts, the charts it makes become regular InstaCharts charts that you can edit, share with a public link, embed on a website and add to a dashboard.
The connection runs through the InstaCharts MCP server. MCP (Model Context Protocol) is an open standard that AI apps use to connect to outside tools. You add the InstaCharts server address to your AI app once, sign in with your InstaCharts account, and then ask for charts in plain language.
TLDR: add https://api.instacharts.io/mcp as a connector in your AI app and sign in with a paid InstaCharts account.
This article has been adapted from our Connect AI Apps guide.
Prerequisites
- An InstaCharts account on a paid plan, with a workspace on a paid plan
- An AI app that supports remote MCP servers, such as Claude, ChatGPT or Claude Code
What your AI assistant can do in InstaCharts
Once connected, your assistant can:
- Turn data into a sheet from a table you paste into the chat. InstaCharts detects text, number, date, percent and currency columns from the values.
- Import a file from a link, such as an open data portal’s CSV export, a raw file on GitHub or a Google Sheet published to the web as CSV. InstaCharts downloads the file directly, so the whole dataset reaches the sheet.
- Upload a large file through a one-time upload link, which suits apps that can run commands, such as Claude Code.
- Build any of the 15 InstaCharts chart types, including bar, stacked bar, line, area, scatter, pie, radar, heatmap, mekko and gauge charts.
- Check the chart by rendering it as an image, then change the chart type, columns, aggregation, date grouping, sorting, colors, titles or size.
- Add, change and delete rows in a sheet, and every chart built on that sheet updates.
- Share the chart with a public link and get the iframe embed code for your website or blog.
Charts made by your assistant use your workspace’s saved theme, fonts, colors and locale, so they match the rest of your charts.
Why use InstaCharts with your AI assistant
Claude and ChatGPT can draw a quick chart on their own by writing code or generating an image. Connecting them to InstaCharts gives that chart a permanent home with saved styling, a live data source, sharing settings and a visual editor. Here are the main reasons teams chart through InstaCharts.
Brand and style charts in a predictable way
Styling in InstaCharts is stored as chart settings, so a chart looks the same every time it is drawn. Workspace Chart Defaults set the theme, fonts, plot style and axis style for every new chart, including the charts your assistant creates. A shared Brand Colors palette keeps everyone on the same hex codes, and Shared Assets let you place your logo on a chart as an image annotation. When a chart needs a small change, you can click the option in the editor and see the result right away, which is faster and more dependable than rewording a prompt until the model produces the look you want.
Update the data behind a chart in a repeatable way
Every InstaCharts chart is built on a sheet, and the chart redraws from that sheet whenever the data changes. Your assistant can add, change and delete rows, and you can update a sheet from a new file by overwriting it, adding rows or adding columns. Sheets connected to Google Sheets or to a file at a web link can sync on an hourly, daily, weekly or monthly schedule. The chart type, colors, labels and annotations stay in place through each update, so next month’s chart matches this month’s chart with the new numbers.
Accurate numbers from the full dataset
InstaCharts calculates the chart values from every row in the sheet. Aggregation functions such as sum, average, median, min, max and count, along with date grouping, run inside InstaCharts on the complete data. Files imported from a link or sent through an upload link reach the sheet in full. You can open the sheet at any time to check the rows behind a chart, which makes the numbers easy to verify before you publish them.
A permanent link that stays current
Charts made through InstaCharts are saved in your workspace, where you and your team can find and reuse them long after the chat ends. Each chart can be shared with a public link, shared privately with specific people, or embedded on a website. The link and embed code stay the same as you edit the chart or update its data, so every page that shows the chart displays the latest version. Viewers get an interactive chart with hover tooltips, an optional data table view and an export button.
Exports for reports and presentations
Any chart can be exported as a PNG, JPG, SVG, WebP, PDF or PowerPoint slide, at the size you set in the editor. This gives you clean, consistent files for slide decks, printed reports, emails and social posts.
Teamwork and access control
Workspaces support members with Owner, Admin, Editor and Viewer roles, so teammates can open and refine a chart your assistant built using the same editor and data. When you connect an AI app, you choose its access on the sign in page and can limit it to viewing your sheets and charts.
Dashboards and share analytics
Charts your assistant builds can be added to a dashboard with slicers that filter every chart on a page at once. Share Analytics counts the views of your shared charts, embeds and dashboards and lists the top pages that embed them.
Connect InstaCharts to Claude
- In Claude, open Settings and go to Connectors.
- Choose Add custom connector.
- Name it InstaCharts and enter the URL
https://api.instacharts.io/mcp. - Select Connect and sign in to InstaCharts on the page that opens.
- Review the permissions and continue.
Connect InstaCharts to Claude Code
Run this command in your terminal:
claude mcp add --transport http instacharts https://api.instacharts.io/mcpThen run /mcp inside Claude Code, choose instacharts and sign in. Claude Code can send CSV and Excel files from your computer straight to InstaCharts, which makes it a good fit for charting local files and large datasets.
Connect InstaCharts to ChatGPT
In ChatGPT, add a custom connector from Settings under apps and connectors, enter the URL https://api.instacharts.io/mcp, choose OAuth and sign in to InstaCharts. Depending on your ChatGPT plan, custom connectors may need to be turned on by an admin or through developer mode.
Prompts to try
Here are a few requests that work well once InstaCharts is connected:
- “Make a bar chart in InstaCharts of monthly sales from this table, and give me the embed code.”
- “Import the CSV at this link into my Marketing workspace and chart signups by week.”
- “Read my Revenue sheet and build a grouped line chart of revenue by region over time.”
- “Show me the chart, then switch it to horizontal bars sorted from largest to smallest.”
- “Add these five new orders to my Orders sheet.”
- “Share the chart publicly and give me the link.”
Permissions and privacy
The InstaCharts sign in page lists what your AI app will be able to do. View access is always included, and you can uncheck edit access to let the app read your sheets and charts without changing them. The app works with the same access you have, in workspaces on a paid plan.
You can remove an AI app’s access at any time from the Third Party Apps list in your InstaCharts login settings. Changing your InstaCharts password also disconnects every AI app.
Tasks
Each change your AI assistant makes counts as one task against the workspace’s monthly task limit. That includes creating a sheet, importing or uploading a file, changing rows, creating or editing a chart, sharing a chart and rendering a chart image. Listing and reading your sheets and charts is free. Starter plans include 1,000 tasks a month per seat and Pro plans include 5,000, shared by the whole workspace.
Keep editing in InstaCharts
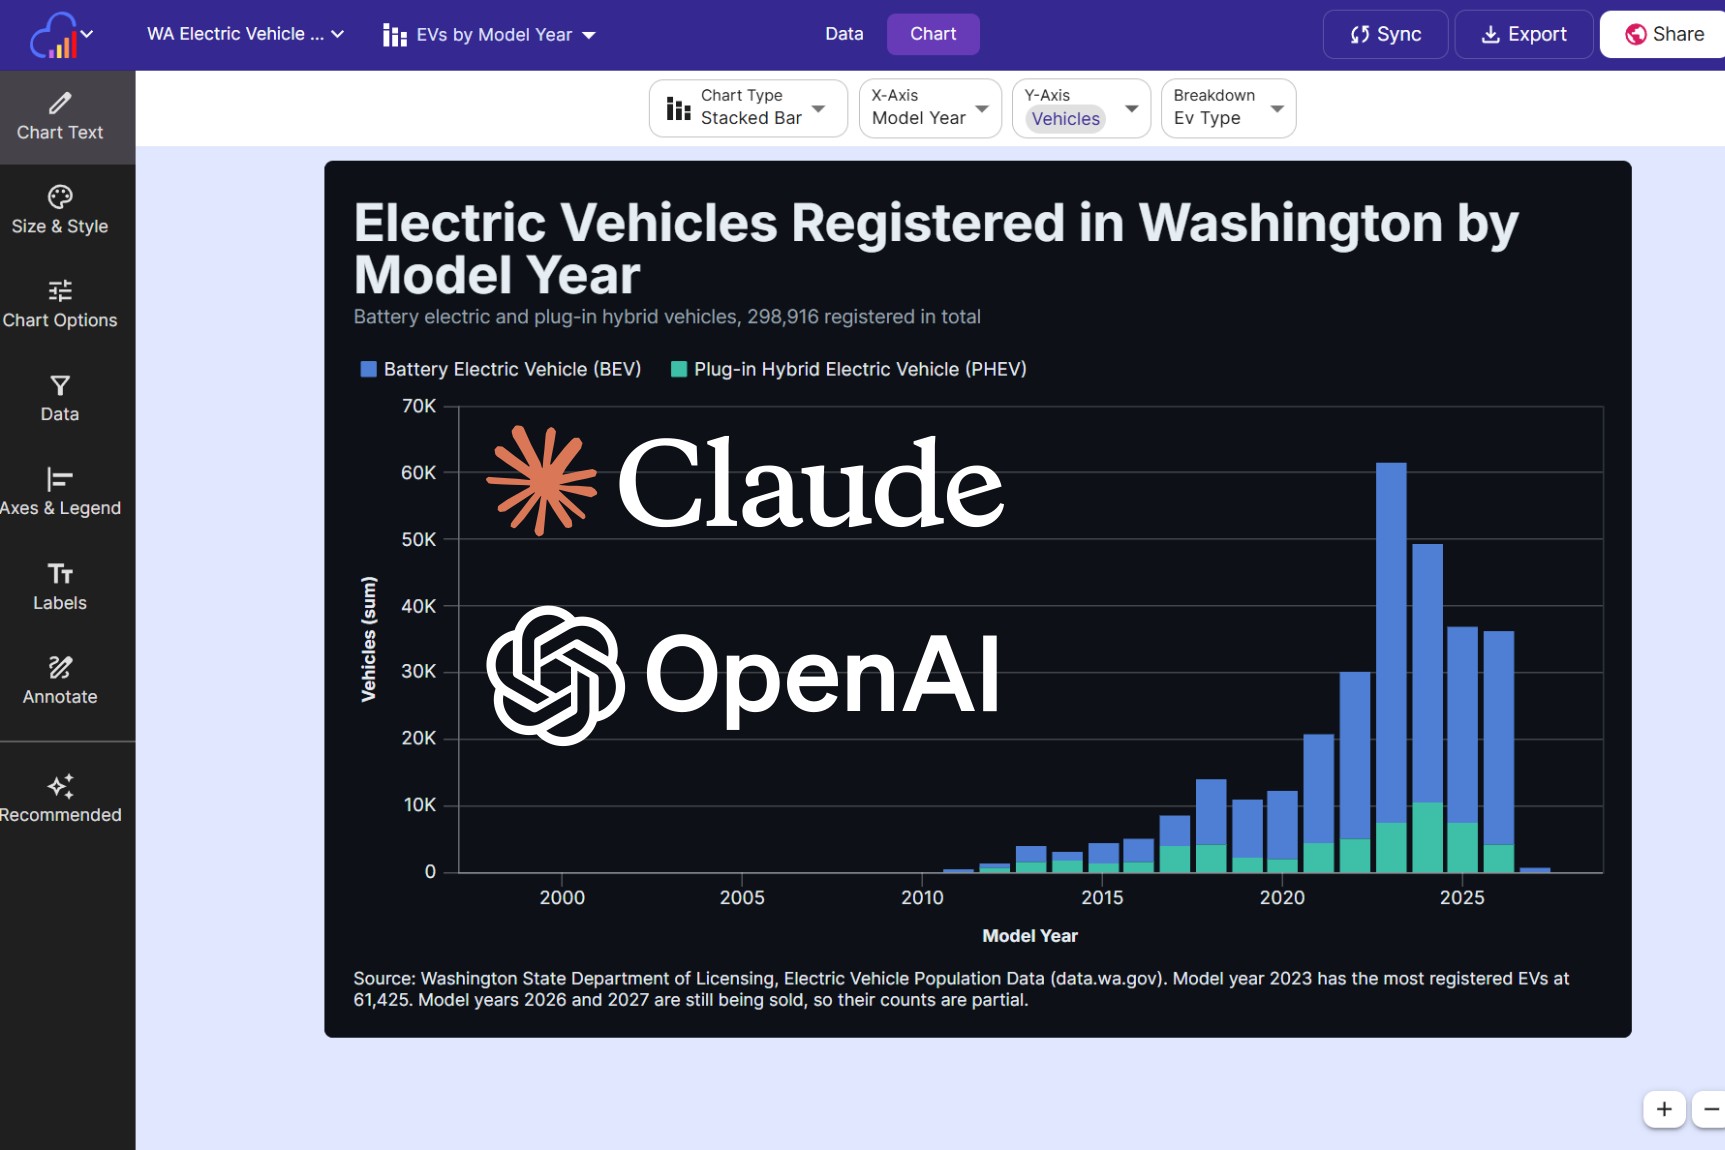
Everything your assistant creates appears in your InstaCharts workspace. Open a chart in the editor to add annotations, adjust labels, apply a theme or add it to a dashboard. Shared links and embed codes stay the same as you edit, so your website always shows the latest version.