How to open a csv file online
Upload the CSV file to InstaCharts for quick viewing

Open and view csv files
This guide shows how to open and view a CSV file online in InstaCharts, filter and edit the data, and share the data table with a coworker.
TLDR: Try the demo or sign up for a free account!
1. Open InstaCharts
Login to your InstaCharts account if you plan on sharing your data with others. Use the demo to try InstaCharts without signing up.
2. Upload your CSV file
From your workspace, click New, then New Sheet, and choose Upload a file. You can also drag and drop one or more files from your computer onto the workspace.
InstaCharts opens an import preview that shows the first 100 rows of the file. Each column header is color coded by the type InstaCharts detected: green for dates, blue for numbers, and pink for text. The import options on the left side of the preview handle the most common problems, and the preview refreshes as you change them:
- Find first data row skips titles, notes, and blank rows that sit above the table.
- Use first row as header treats the first row as column names. Uncheck it when the file has no header row.
- Choose columns to import brings in only the columns you need from a wide file.
- File encoding fixes accented or non-Latin characters that appear garbled.
Click Import when the preview looks right. Free accounts can open files up to 2MB and 500 rows per sheet, Starter processes up to 25k rows per sheet, and Pro processes up to 100k rows per sheet.
3. View your data
 View your data on the Data Tab
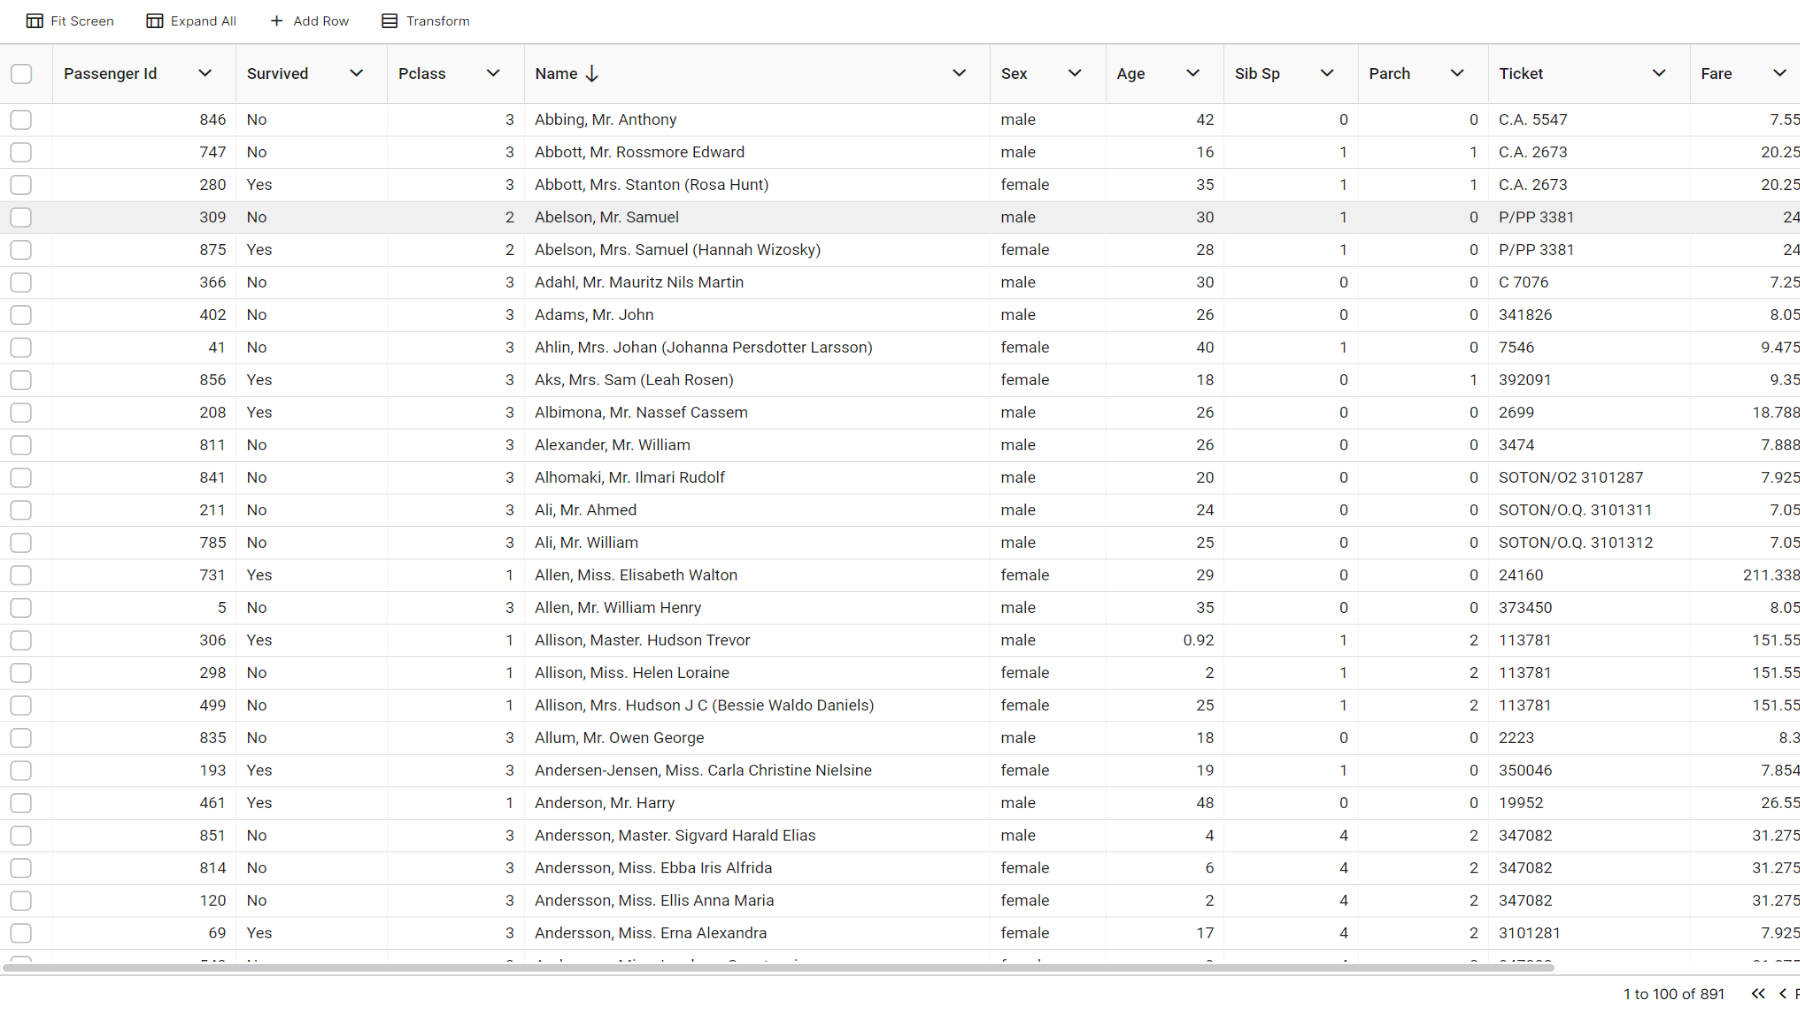
The sheet opens with a chart already built from your data. Click over to the Data tab to see your data as a table. The Full Dataset view shows every row of the file, and the Plotted Data view shows the summarized values drawn in the chart.
Check that the columns were read correctly. To rename a column or change its type, open the column’s menu from its top right corner and choose Edit Column.
4. Filter and edit the data
- Quick filter: Click the magnifying glass in the sheet toolbar and type a word or number. Only the rows that contain it in any column remain.
- Column filters: Open a column’s menu from its top right corner and choose Set Filters. Each column can have up to 5 filter conditions, combined with And or Or. Text, number, and date columns each offer their own filter types, such as Contains, Greater than, or Between.
- Edit cells: Double click a cell to change its value, use the Add Row and Add Column buttons in the toolbar, or paste data with Ctrl+V. Press Ctrl+F to find and replace values across the sheet. Click Save Edits to keep your changes.
5. Optionally check your chart
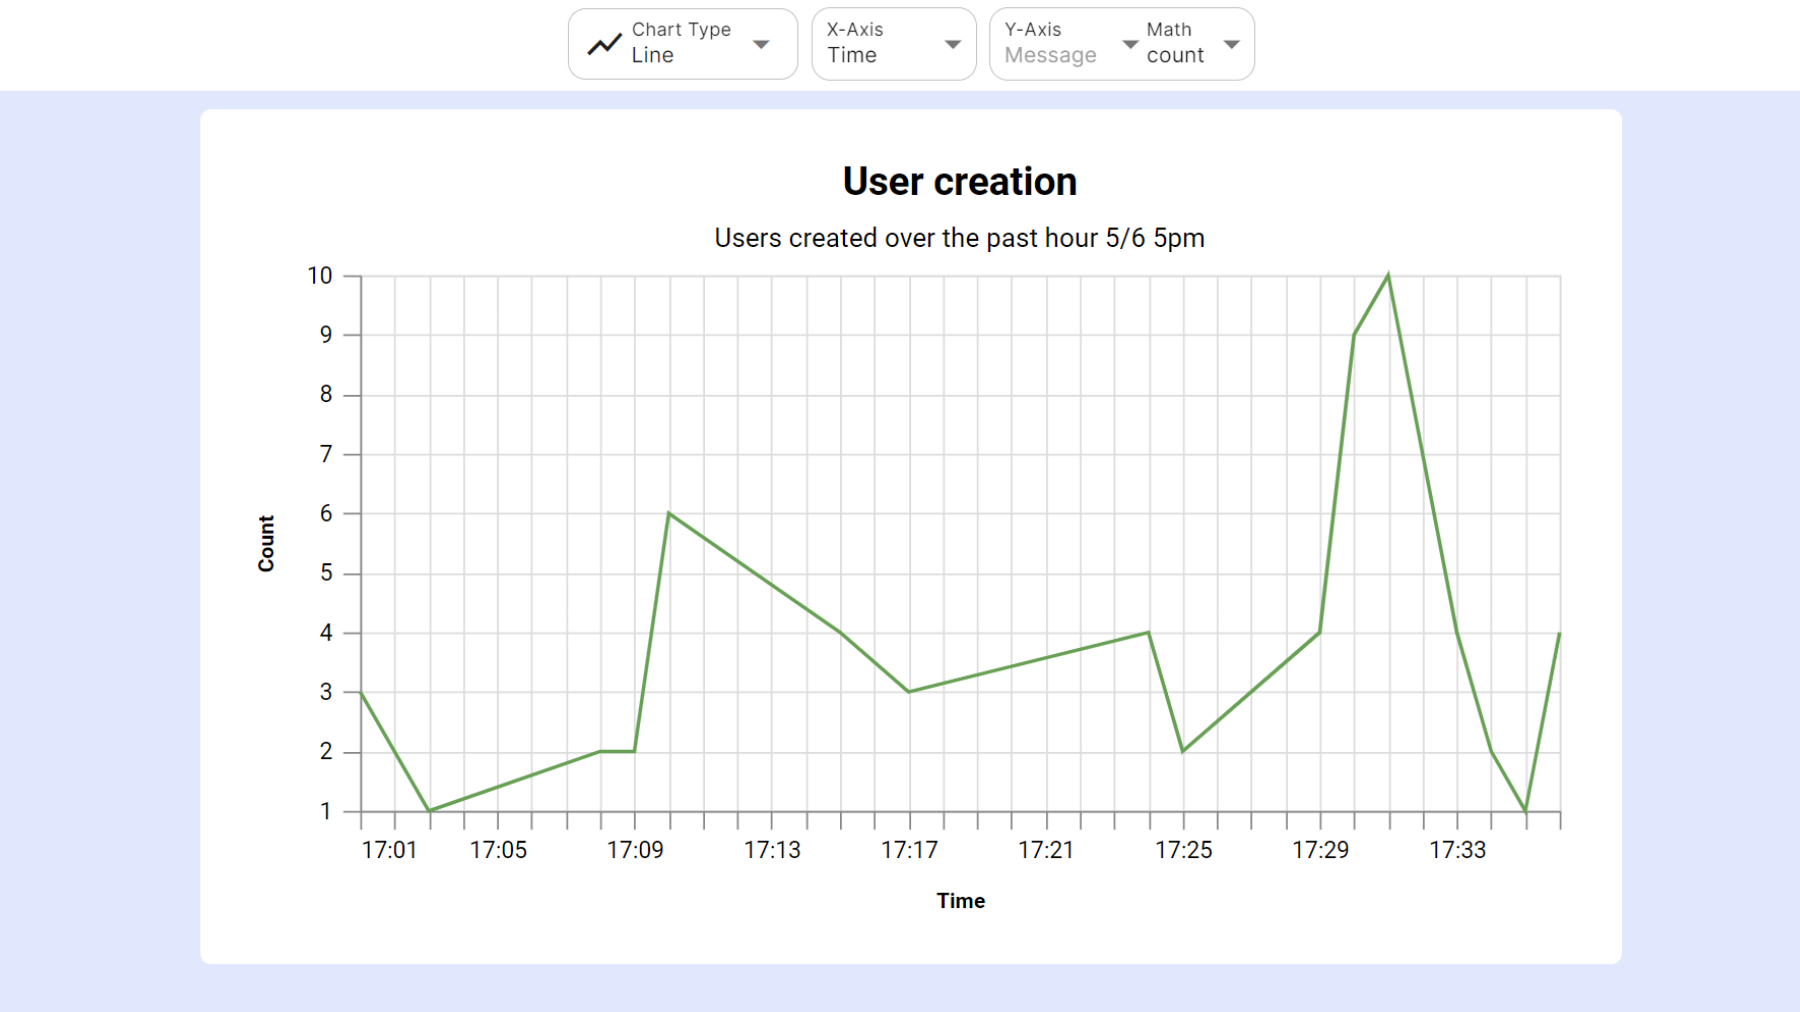
Click on the Chart tab to switch to the Chart view. A chart has automatically been created based on your data. For more information on creating charts, check out this article How to create a chart from a csv file.
The import window also has a Generate AI charts checkbox. When it is checked, InstaCharts builds three recommended charts from your data as soon as the upload finishes, which uses 1 AI credit.
6. Export & Share
Open the Export dialog from the main toolbar and select the Data tab. Choose Full Dataset to download the rows on the Data tab, with any filters you have set applied, or Plotted Data to download the summarized values shown in the chart. The file types are csv, xlsx, tsv, and json, so a filtered view of your CSV can become a smaller CSV in one step.
To share your data table, click Share on the main toolbar (sharing is an accounts only feature). Under Included Views, select Full Dataset, Plotted Data, or both, then pick a share mode:
- Public gives anyone with the link access to the interactive view.
- Share with specific users limits access to the email addresses you add (paid plans).
- Private keeps the data visible to you only.
You can send the link to a teammate or embed the data table in a webpage with the embed URL or embed tag. Anyone who opens a publicly shared sheet can see all of the data in it, so keep sensitive files on Private or specific users.
To show a table next to charts and KPIs, add a Data Table widget to a dashboard and choose which columns to display.
Other file types you can open
InstaCharts opens more than CSV files. Upload any of these the same way:
- Delimited text:
.csv,.tsv,.psv,.dsv,.txt,.log - Microsoft Excel:
.xls,.xlsx,.xlsm,.xlsb - OpenDocument and Apple Numbers:
.ods,.fods,.numbers - JSON:
.json,.jsonl - Tables in web and rich text files:
.html,.rtf - Legacy formats:
.dif,.dbf,.eth
An Excel or OpenDocument workbook with several pages creates one sheet for each page you choose to import. The Import File guide lists every import option.
Keep the data up to date
When you receive a newer version of the CSV, right click the sheet in your workspace and choose Update Data, or select Update Sheet Data from the sheet menu. Your charts keep working, so there is no need to import the file again. See Update Sheet Data for details. Edits made in InstaCharts are replaced when a sheet is refreshed from a file, so make lasting changes in the original file.
For data that changes often, choose Connect a data source in the New Sheet dialog to sync a Google Sheet or a file in Google Drive.
Give it a try
InstaCharts helps you create and share professional-looking charts from your data in a few clicks. Sign up for a free account today.