
Automated Reports
Build Your Report Once and Let It Update Itself
Connect your charts and dashboards to live data, then deliver fresh reports to your team, clients and stakeholders on a schedule.
Save time
Stop Rebuilding the Same Report Every Month
Design your charts once. InstaCharts keeps them connected to your data, so each new week or month brings fresh numbers with the same design, the same link and the same embed code.
Report types
Automate Any Recurring Report
Set it up once: Connect your data, design your charts and choose how the report reaches your audience.
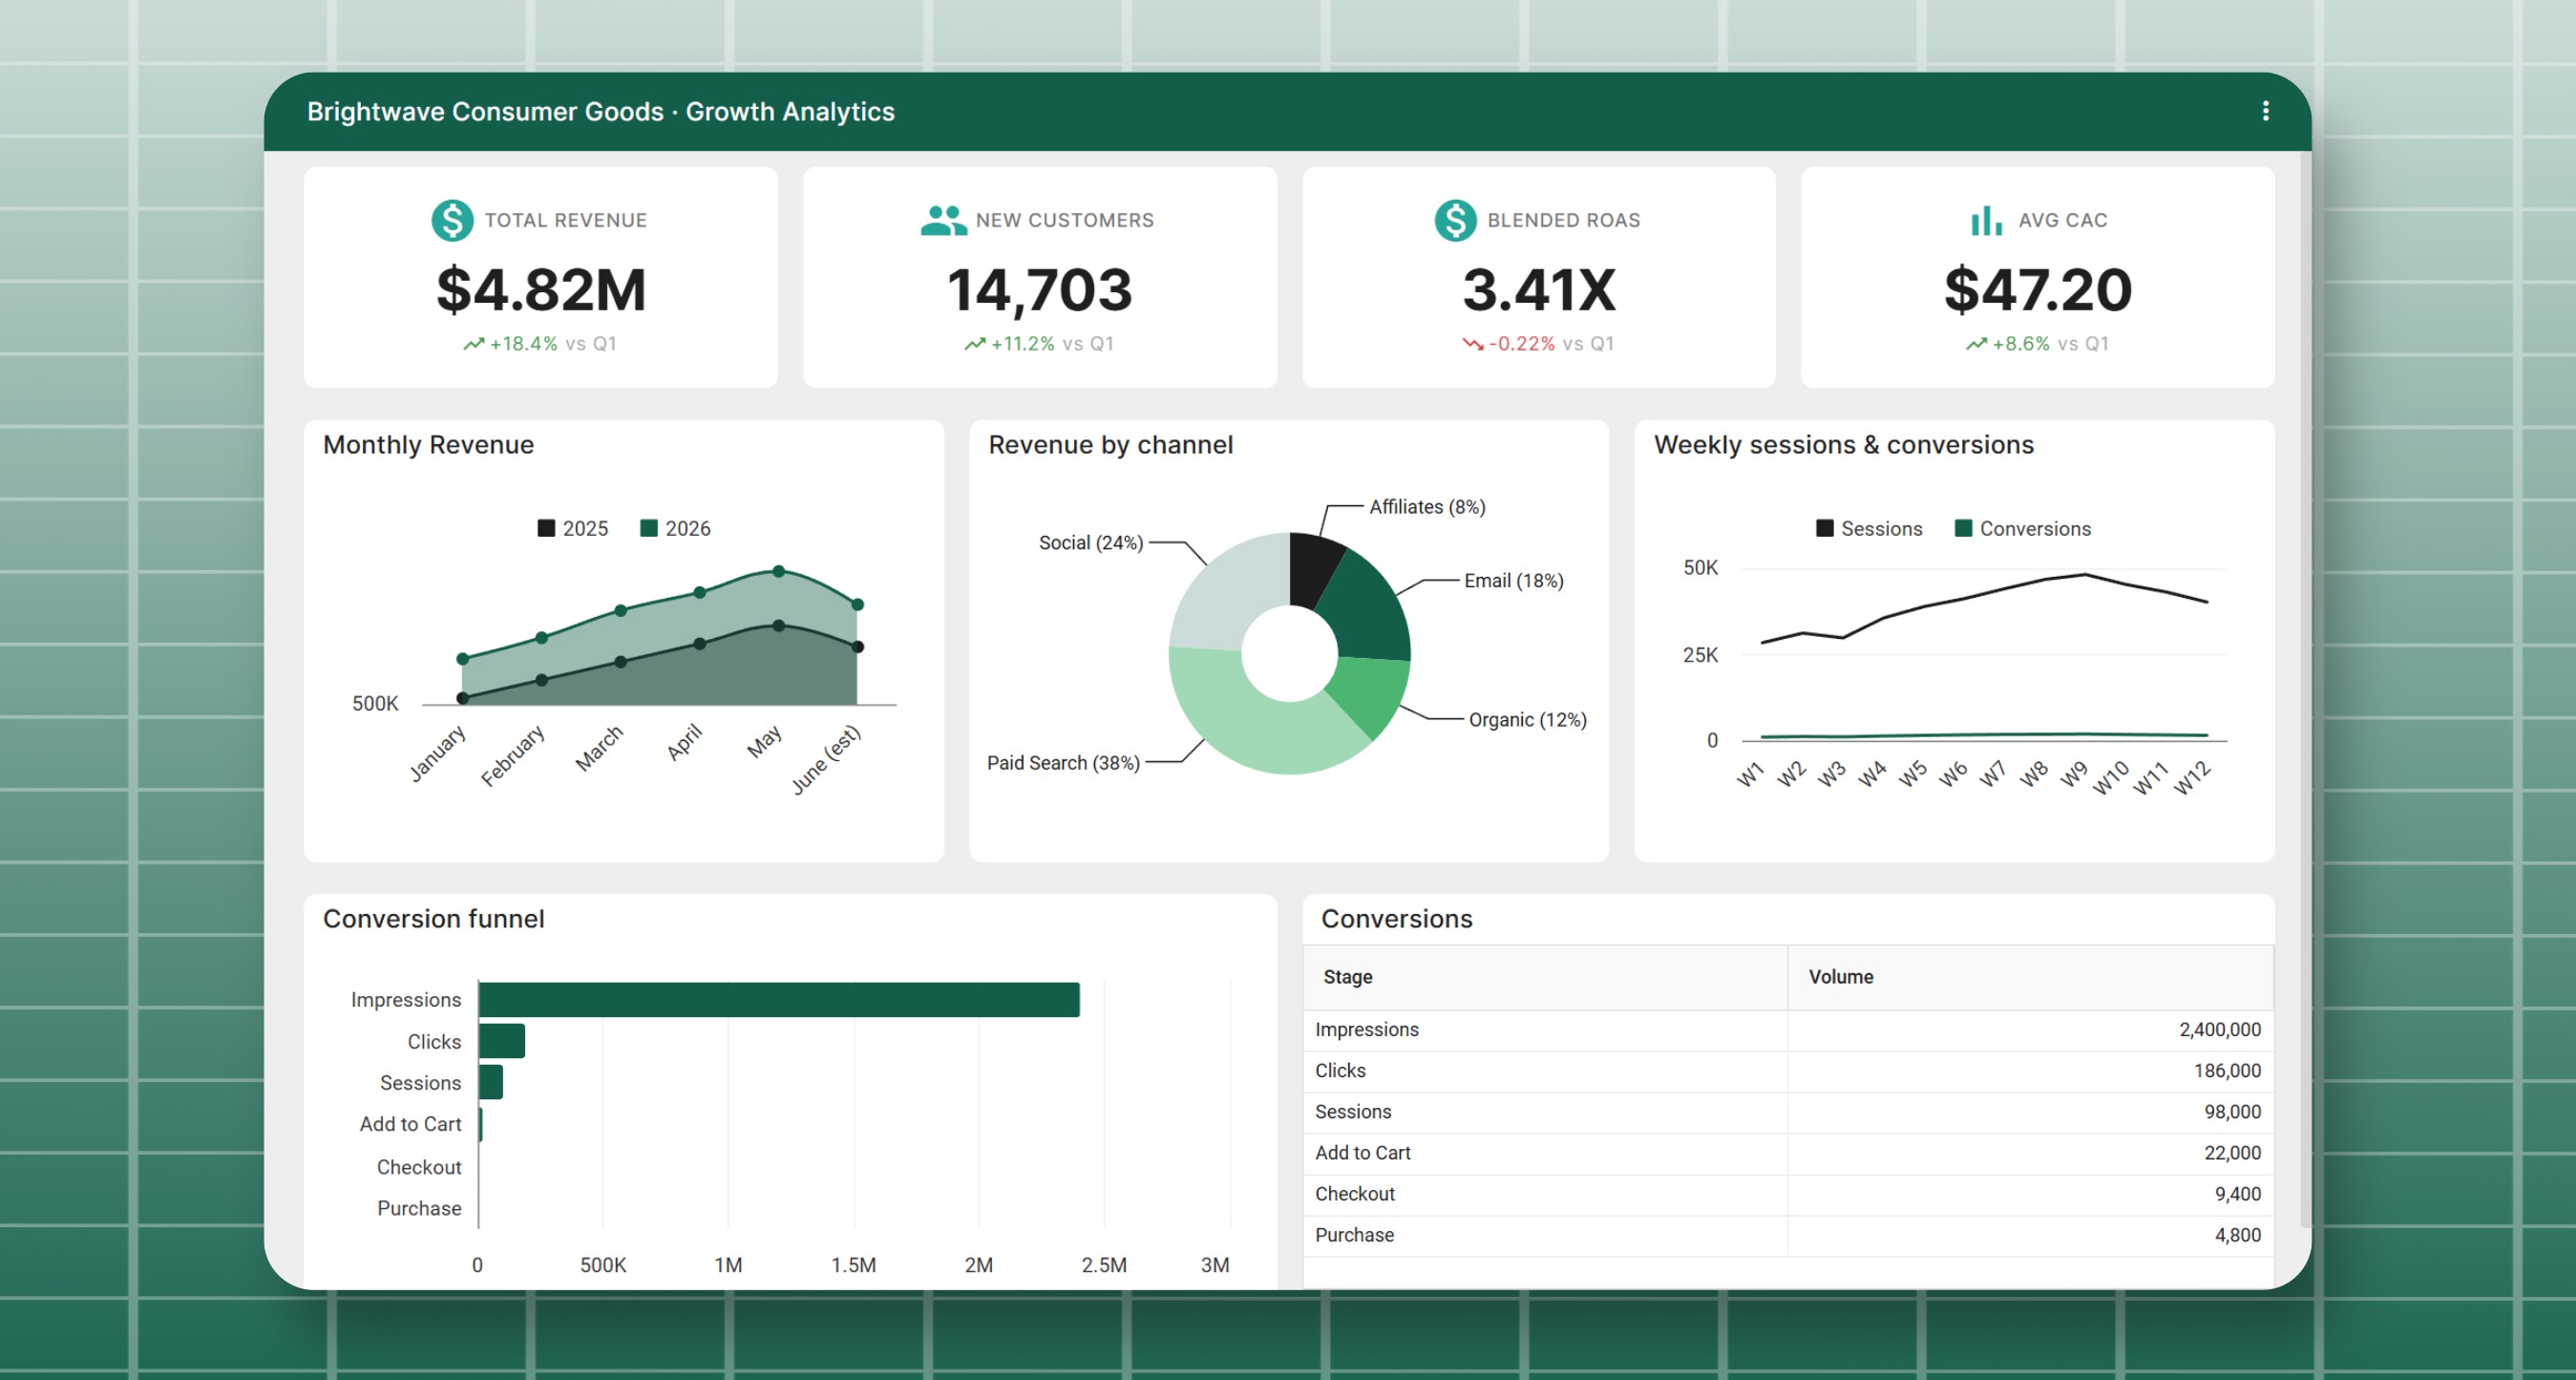
Popular automated reports:
- Weekly sales reports
- Monthly marketing reports
- Client reports
- Quarterly board updates
- Website KPI reports
- Survey results
- Fundraising trackers
- Operations reports
Data in
Keep your report data current
Connect the spreadsheets and apps your numbers live in, and new data flows into your charts on its own.
Google Sheets Sync Schedules
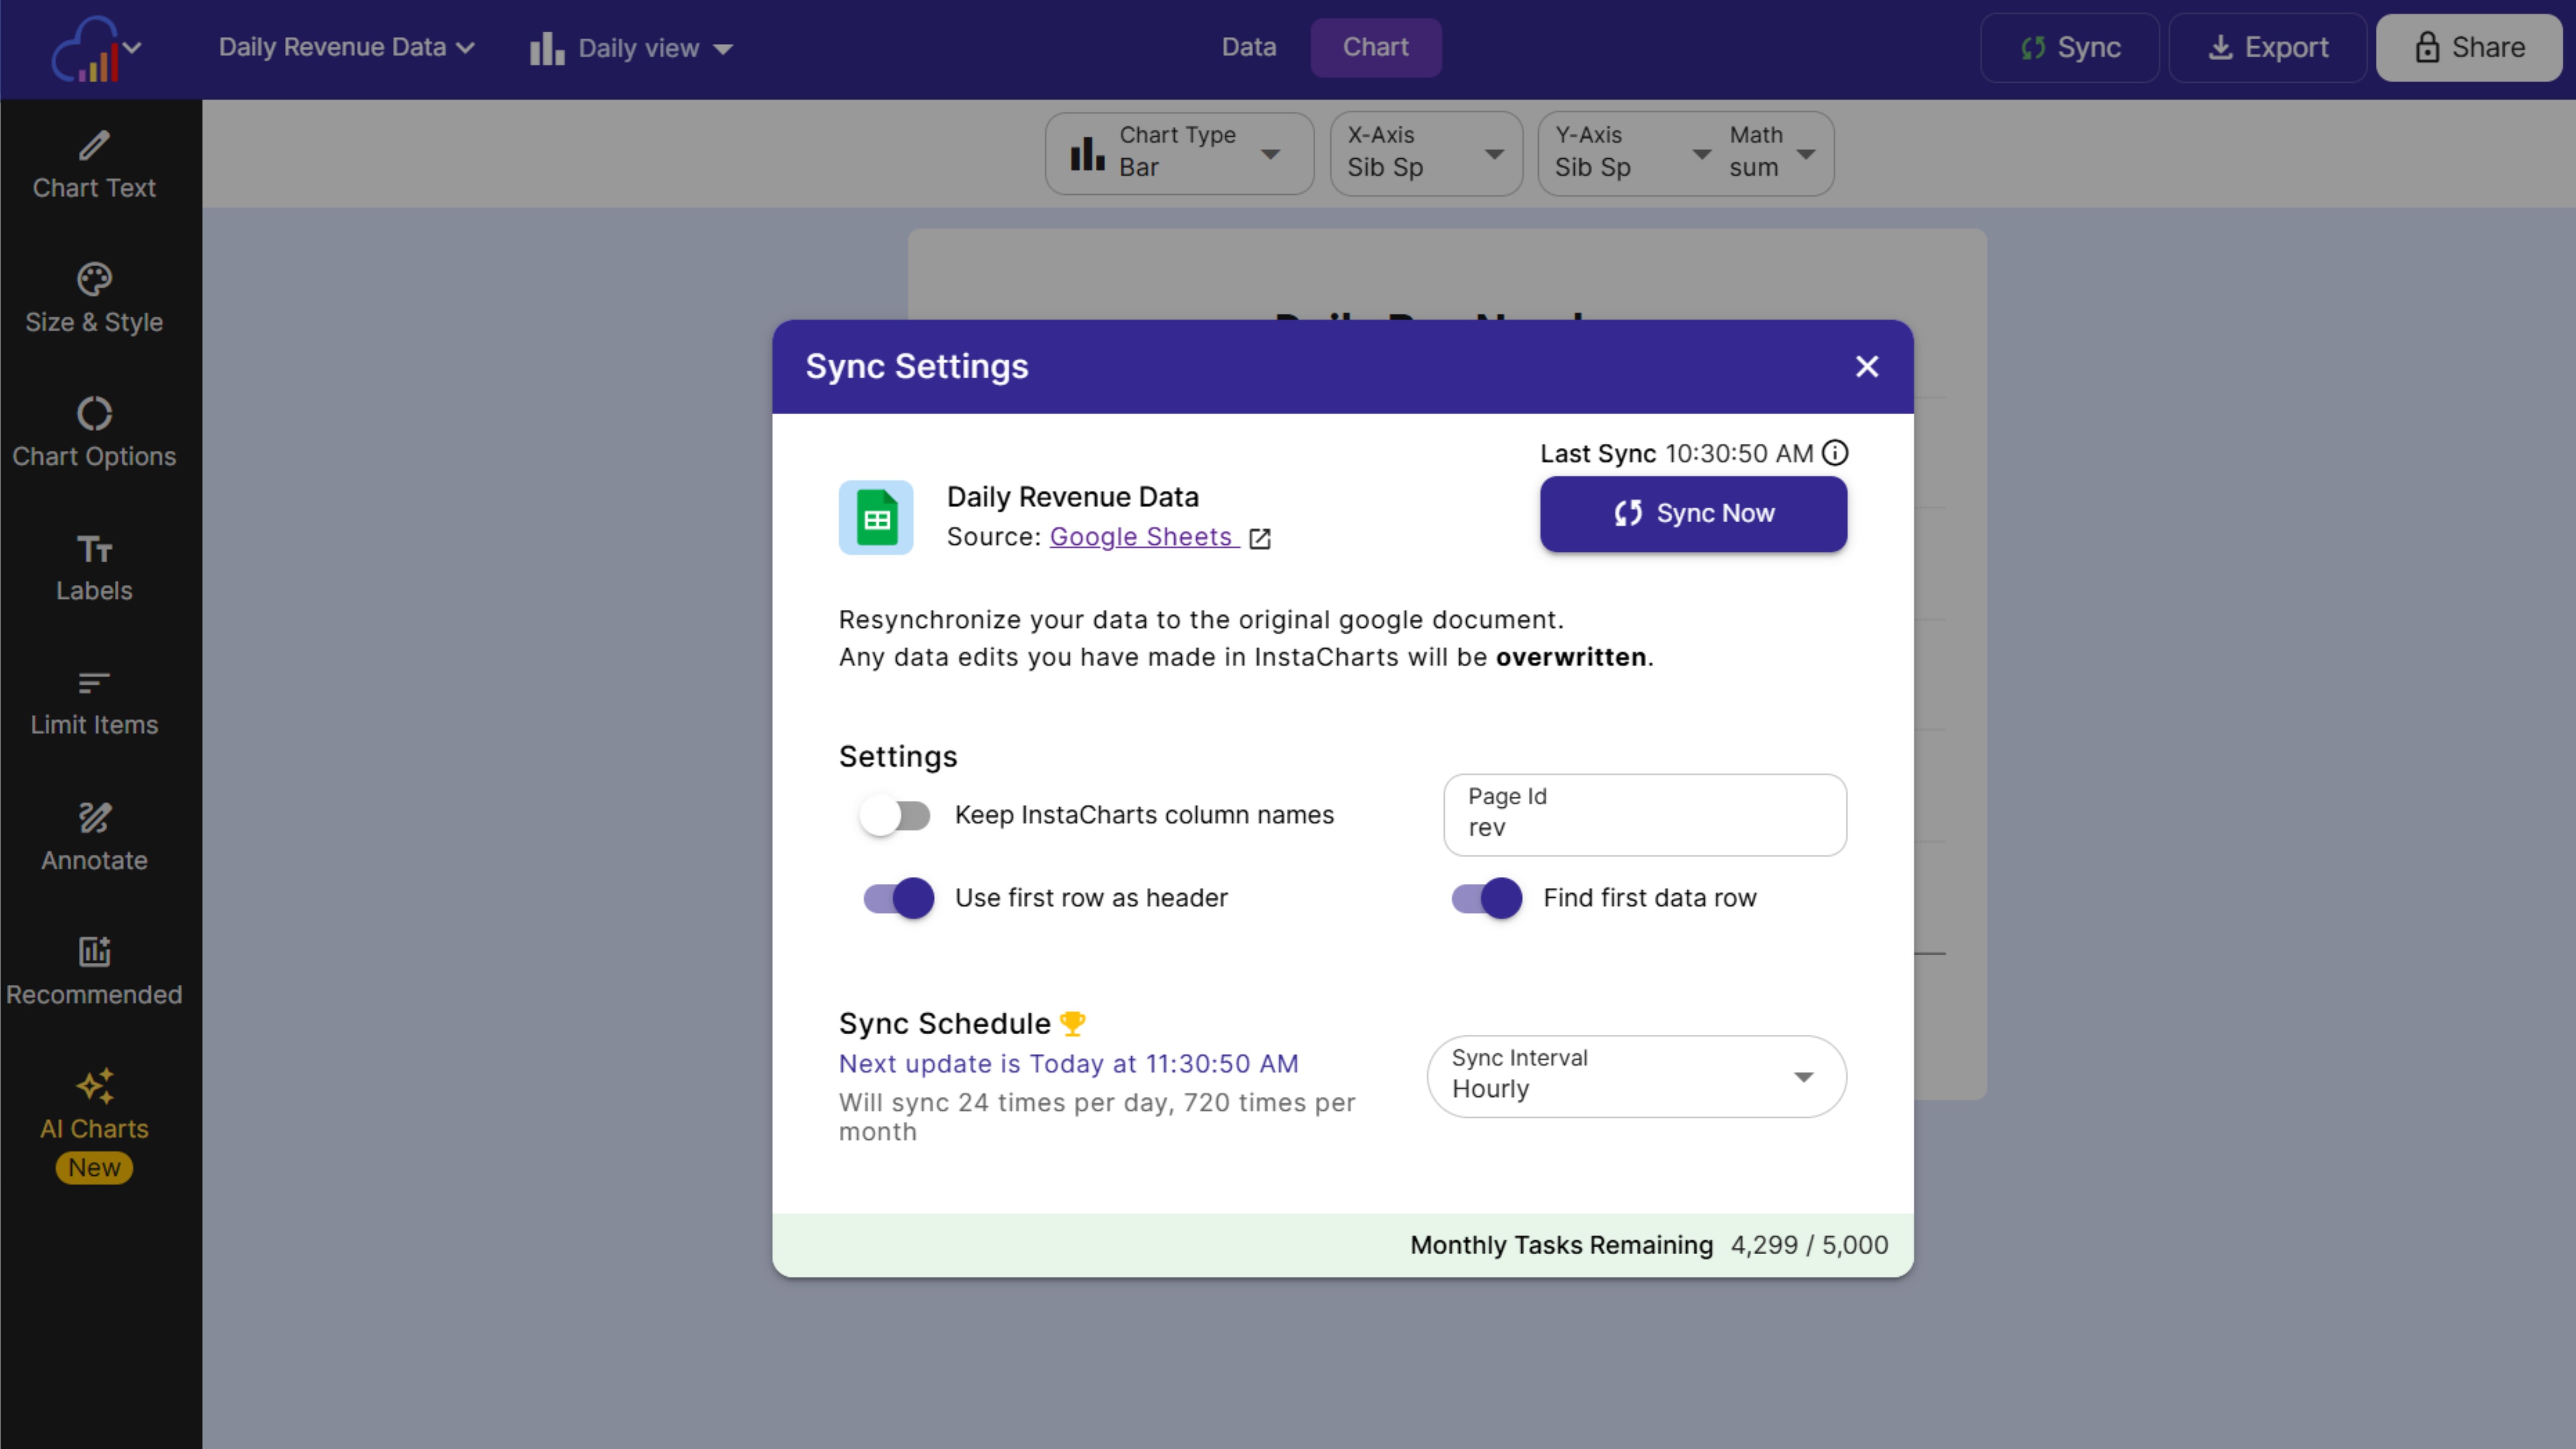
Sync whenever the original file changes, or hourly, daily, weekly or monthly.
Data From 8,000+ Apps
Add rows from Stripe, HubSpot, Salesforce, Typeform and more with the Zapier "Add Data Row" action.
Update From a File
Load each period's Excel or CSV export to overwrite the data, add rows or add columns.
Always current
Reports that refresh with your data
Every chart, data table and dashboard built on a sheet shows its latest data, with nothing to rebuild.
Designs Stay Put
Charts keep their type, theme, colors, labels, annotations and filters when new data arrives.
Same Links & Embeds
Share links and embed codes stay the same, so readers always open the latest version.
Live Dashboards
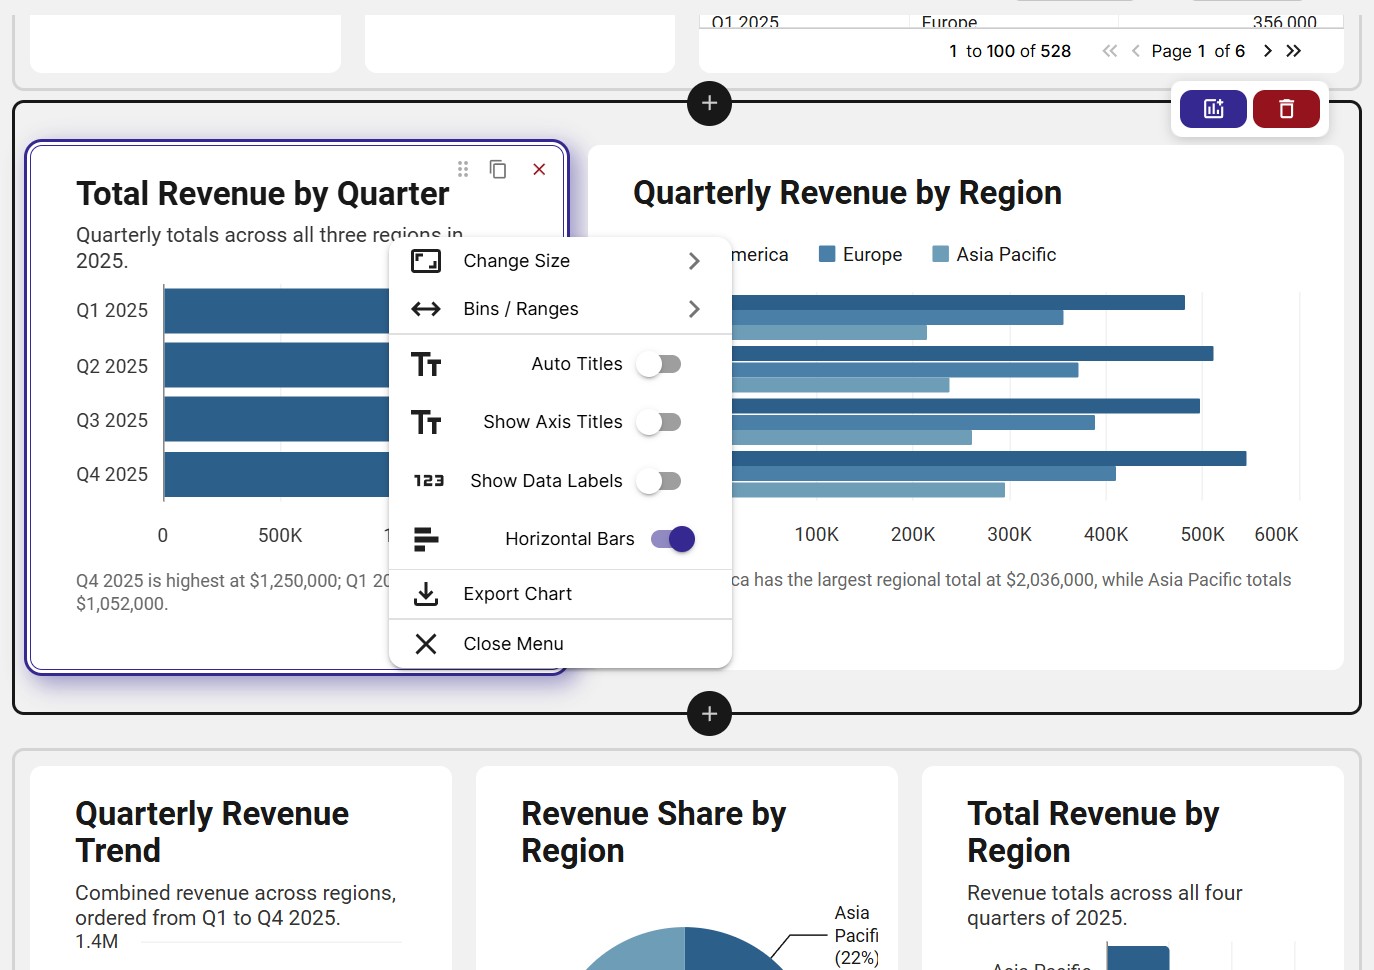
Dashboards built on synced sheets refresh their charts and tables, and open dashboards show new data as it arrives.
Features
Automation You Can Rely On
Minimum Sync Interval
Limit how often a sheet that syncs on every change can update, so busy spreadsheets refresh at a steady pace.
Pause & Resume
Pause a sync schedule while you restructure a spreadsheet, then turn it back on with one click.
Sync Alerts
If a scheduled sync keeps failing, InstaCharts pauses it and notifies you, with a link straight to Sync Settings.
Safe File Updates
Columns are matched by name, a preview shows the result, and updates that would drop a charted column ask you to map it first.
Reuse Last Period's Dashboard
Copy a dashboard to start next quarter's report with the same layout, theme and widgets.
See Who Reads Your Reports
Share analytics counts the views of each shared chart and dashboard, day by day or month by month.
Deliver
Send reports where your team already works
Deliver chart images on a schedule, generate new charts from templates, and keep live links and embeds up to date.
Scheduled Chart Images
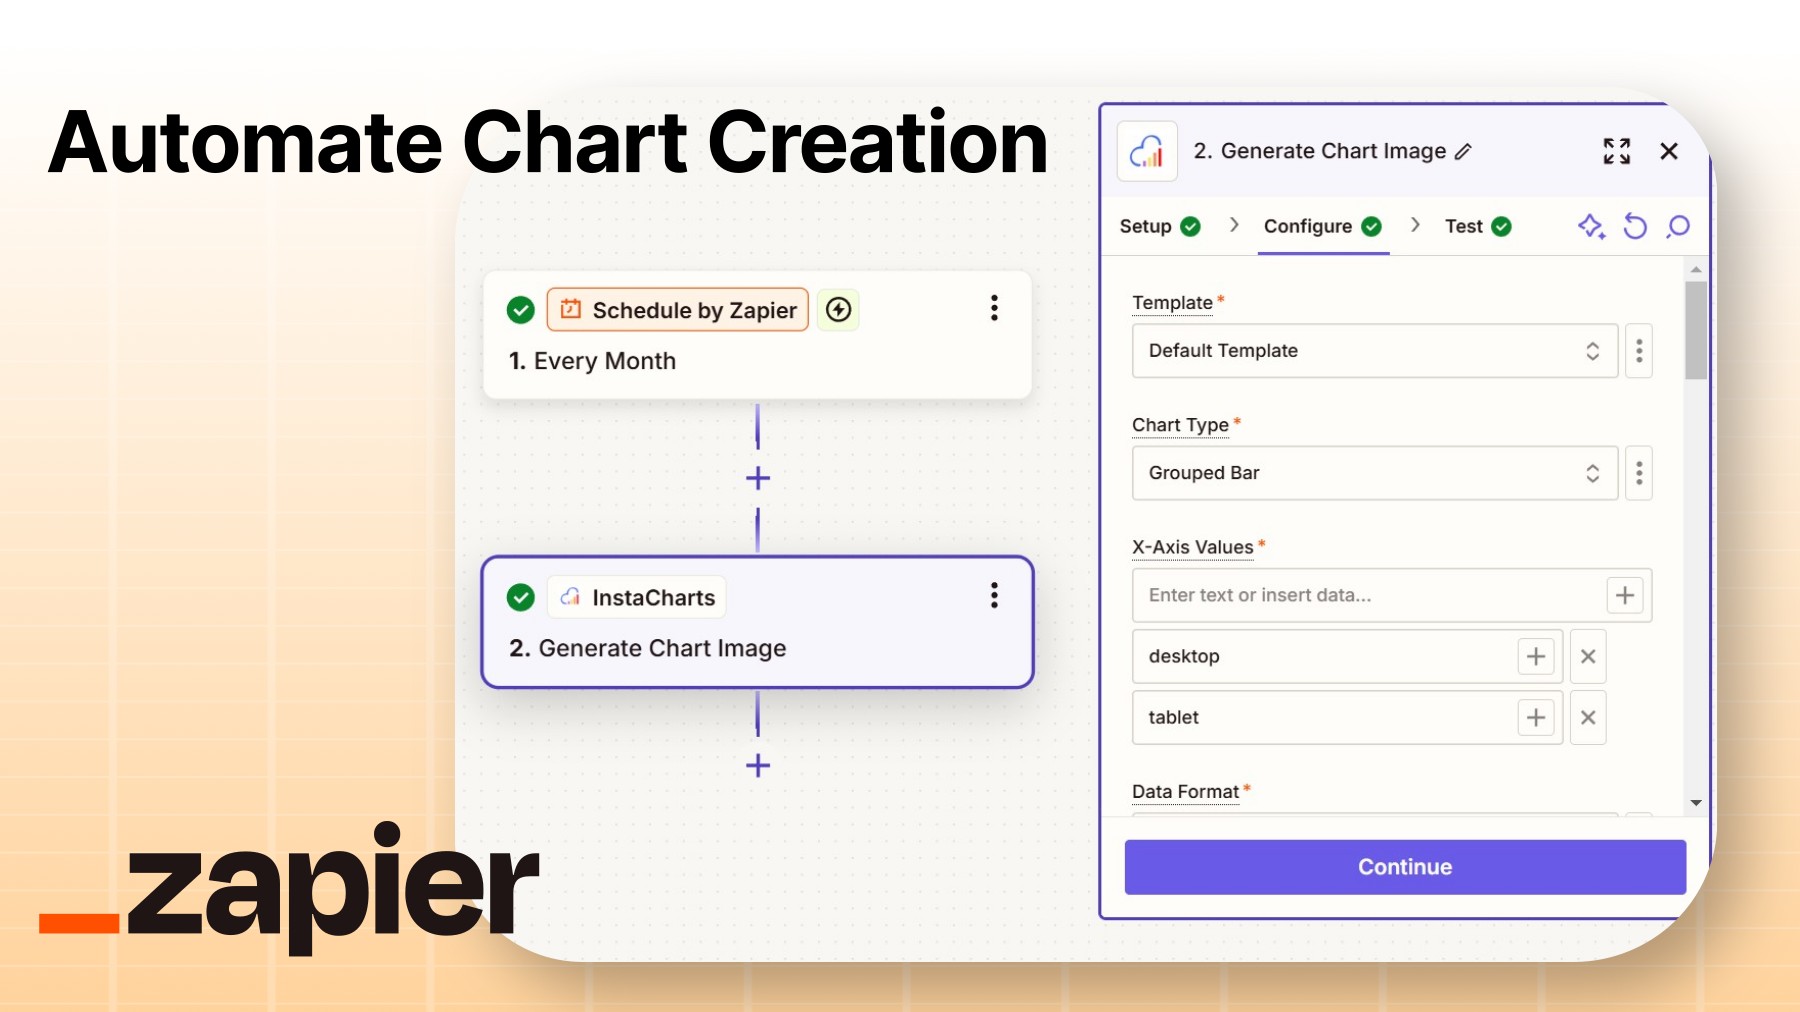
Post a chart to Slack, Microsoft Teams or email every week with the Zapier "Get Chart Image" action.
Generate Charts From Templates
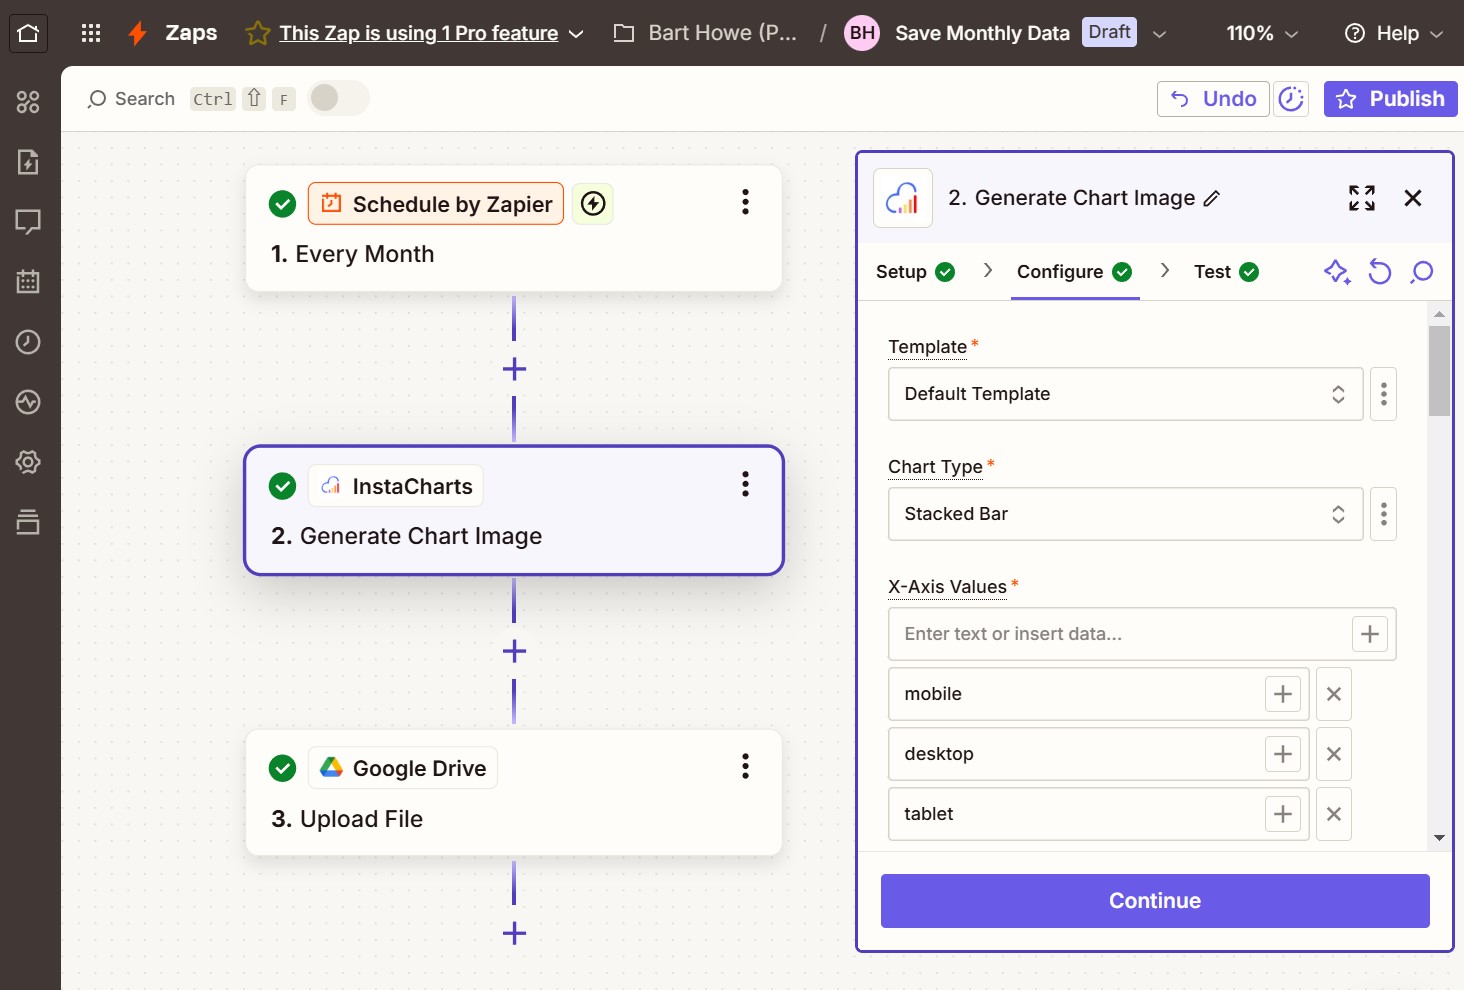
Turn data from any app into a styled chart image with the Zapier "Generate Chart Image" action.
Live Links & Embeds
Share a report link or embed it on a webpage once, and it shows the latest data from then on.
FAQs
Automated Reports FAQs
An automated report is a report you build once that refreshes itself with new data on a schedule. In InstaCharts, the charts, data tables and dashboards in a report stay connected to their data source, so each week or month they show the latest numbers with the same design, the same share link and the same embed code.
Build your charts and dashboard from a sheet that is connected to your data, such as a Google Sheet with a sync schedule or a sheet that receives new rows from Zapier. When the data changes, every chart on that sheet updates. To deliver the report, share a link or embed it, or use Zapier to post chart images to Slack, Microsoft Teams or email on a schedule.
Paid plans can set a sync schedule that runs whenever the original file changes, or hourly, daily, weekly or monthly. Google can take up to 5 minutes to send changes through. Free accounts can run 5 manual syncs a day with Sync Now, and manual syncs are unlimited on paid plans.
Yes. Open Sync Settings to pick the sync interval, see when the next update runs and how many times the sheet will sync each month. Turn on Minimum interval to limit how often a sheet that syncs on every change can update, and turn on Pause syncs to stop the schedule until you are ready.
If a scheduled sync keeps failing, for example because the original file was moved or access was removed, InstaCharts pauses the sync and sends you a notification. Click the notification to open Sync Settings for that sheet, fix the connection and turn the schedule back on.
Yes. Each chart keeps its chart type, theme, colors, labels, annotations and filters when its sheet gets new data. Charts follow the columns they plot, so a weekly or monthly refresh changes the numbers and leaves the design as you built it.
The share link and embed code stay the same. Readers who open the link or visit a page that embeds the chart see the latest data, so you can send a report link once and keep it current for months.
Yes. Each period, update the existing sheet with the new file and choose to overwrite the data, add rows or add columns. InstaCharts matches the columns, shows a preview before the update runs, and every chart, data table and dashboard on that sheet refreshes in one step.
Yes. The InstaCharts "Add Data Row" action in Zapier adds new rows to a sheet from more than 8,000 apps, such as new payments in Stripe, deals in HubSpot or Salesforce, form responses in Typeform or Google Forms, and records in Airtable. Every chart built on the sheet updates as rows arrive.
Yes. In Zapier, start a Zap with a schedule trigger such as every Monday or the first day of the month, then add the InstaCharts "Get Chart Image" action and pick a chart. Zapier renders the chart as an image with its theme, colors and fonts, and the next step posts it to Slack or Microsoft Teams, attaches it to an email, or saves it to Google Drive.
"Get Chart Image" renders a chart you already built in InstaCharts, using its current data. "Generate Chart Image" creates a new chart image from one of your templates using data passed in from the Zap, such as the X axis values, Y axis values, chart type, title and subtitle. Use the first for recurring reports and the second to chart data that lives in another app.
A chart template turns one of your charts into a reusable design. Turn the template on in the Templates tab of the share dialog, then pass new data in the URL to create an interactive chart page, an embed or a chart image with the same styling. Templates suit reports that show the same chart for many clients, teams or locations.
Yes. Chart and data table widgets on a dashboard always show the latest version of their sheets, so a dashboard built on synced sheets refreshes on its own, and teammates with the dashboard open see new data arrive. KPI and text widgets hold the values you type, so update those when a headline number changes.
Tasks measure automation. Each Google sync, Zapier data row, generated chart image and template chart counts as one task. The free plan includes 100 tasks a month, Starter includes 1,000 tasks a month per seat and Pro includes 5,000 tasks a month per seat, shared by everyone in the workspace. Sync Settings shows how many tasks you have left.
Yes. The free plan includes 100 tasks a month, 5 manual Google syncs a day, Zapier actions and updates from a file. Paid plans starting at $10 per user per month add sync schedules, more tasks, more rows per sheet, dashboard sharing and share analytics.
Automate Your Next Report Today
InstaCharts makes data visualization easy, so you can build clear reports without design experience.