
For Websites
Make Your Content Stand Out with InstaCharts
Perfect for website owners, bloggers, newsletter writers, and indie publishers. Add professional, interactive charts and data tables to your site in minutes, with no coding required.
Publishers
Built for Online Publishers Like You
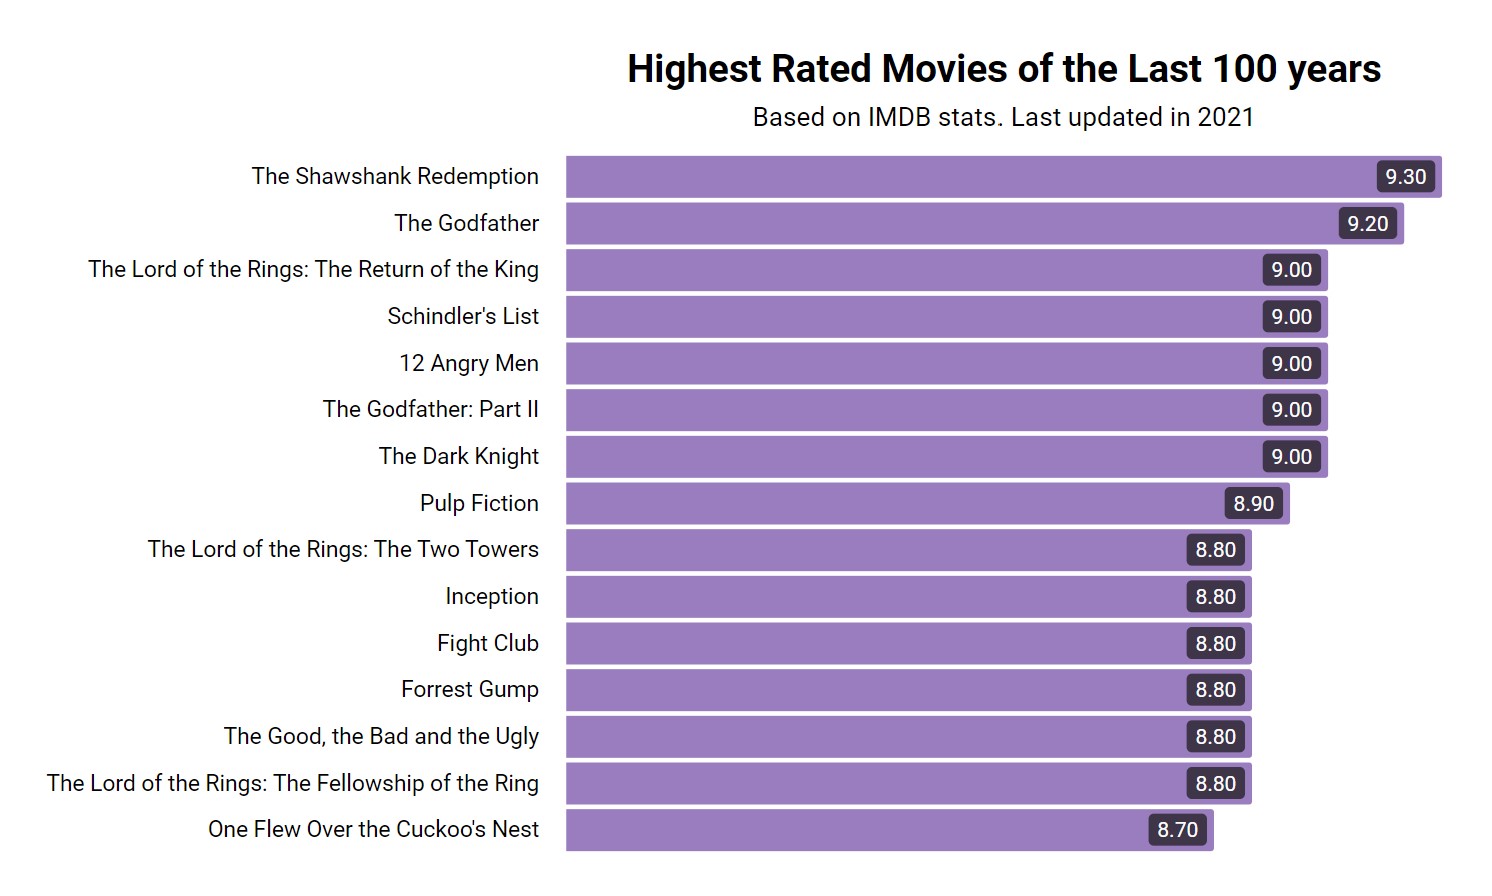
InstaCharts turns your data into charts readers can understand at a glance, instead of a table of numbers.
Platforms
Embed Charts & Tables Without the Hassle
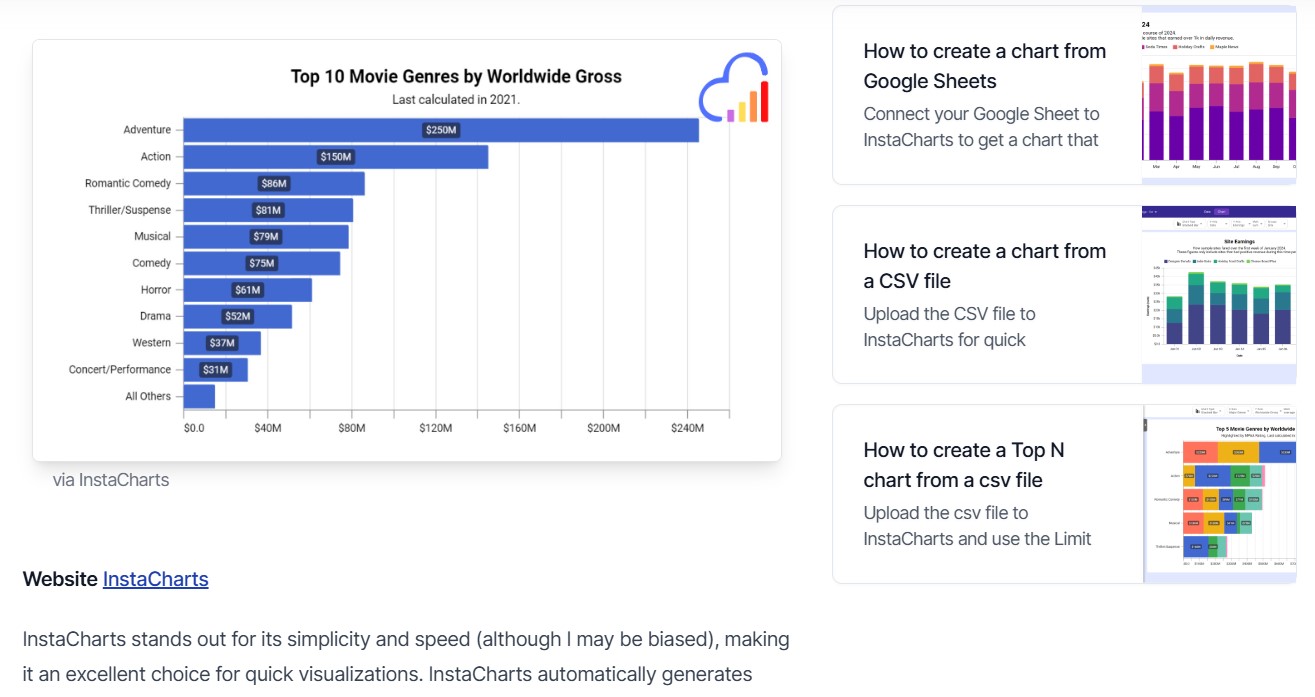
Simple Copy & Paste: Just copy your embed code and paste it into your site.
Works with:
- WordPress
- Webflow
- Ghost
- Wix
- Notion
- Squarespace
- Bubble
- Custom websites
Embed options
Embeds that fit every page
Pick the embed code that suits your platform, then size and style it to sit cleanly inside your layout.
Responsive or Iframe Embeds
Copy a responsive embed tag that resizes to fit the chart, or a plain iframe for platforms that strip scripts.
Size, Border & Background
Set the embed width and height, turn the border on or off, and choose a background color that matches your page.
Mobile Friendly Sizing
Charts redraw to fit phones, tablets and desktops with full size text, or scale to fit the screen.
Reader tools
Give readers the data behind the chart
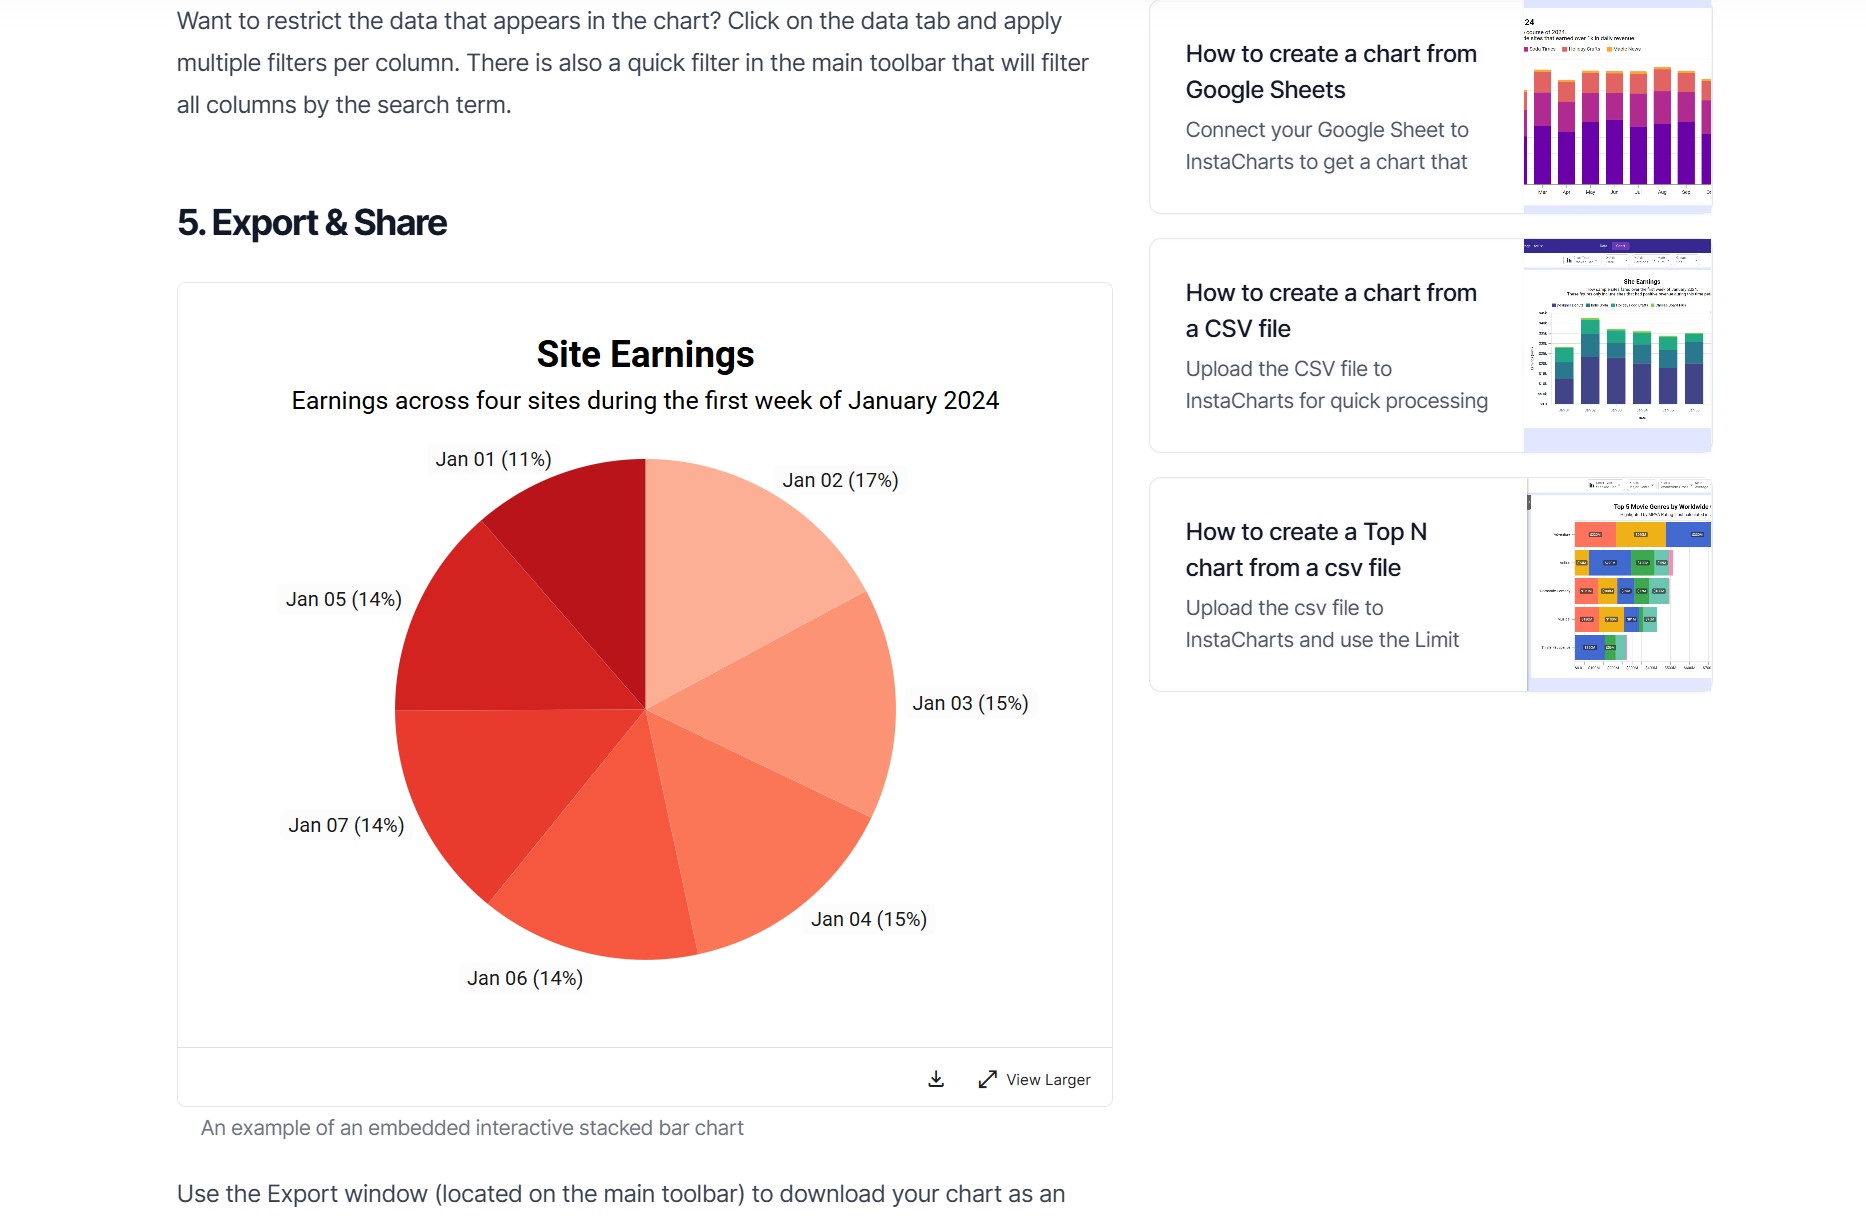
The optional embed toolbar lets readers explore your chart and its data right on your page.
Chart & Data Views
Include the chart, the full dataset and the plotted data, and readers switch between them from the toolbar.
Export & View Larger
Readers can export the chart or open a larger full page view in a new tab.
Match Toolbar to Chart
Color the toolbar with the chart background, with text that switches to light or dark to stay readable.

Features
Charts Built to Fit Your Website
Simple Embedding
Copy and paste your chart embed code into any website. Works with WordPress, Webflow, Ghost, and more.
Live Updates
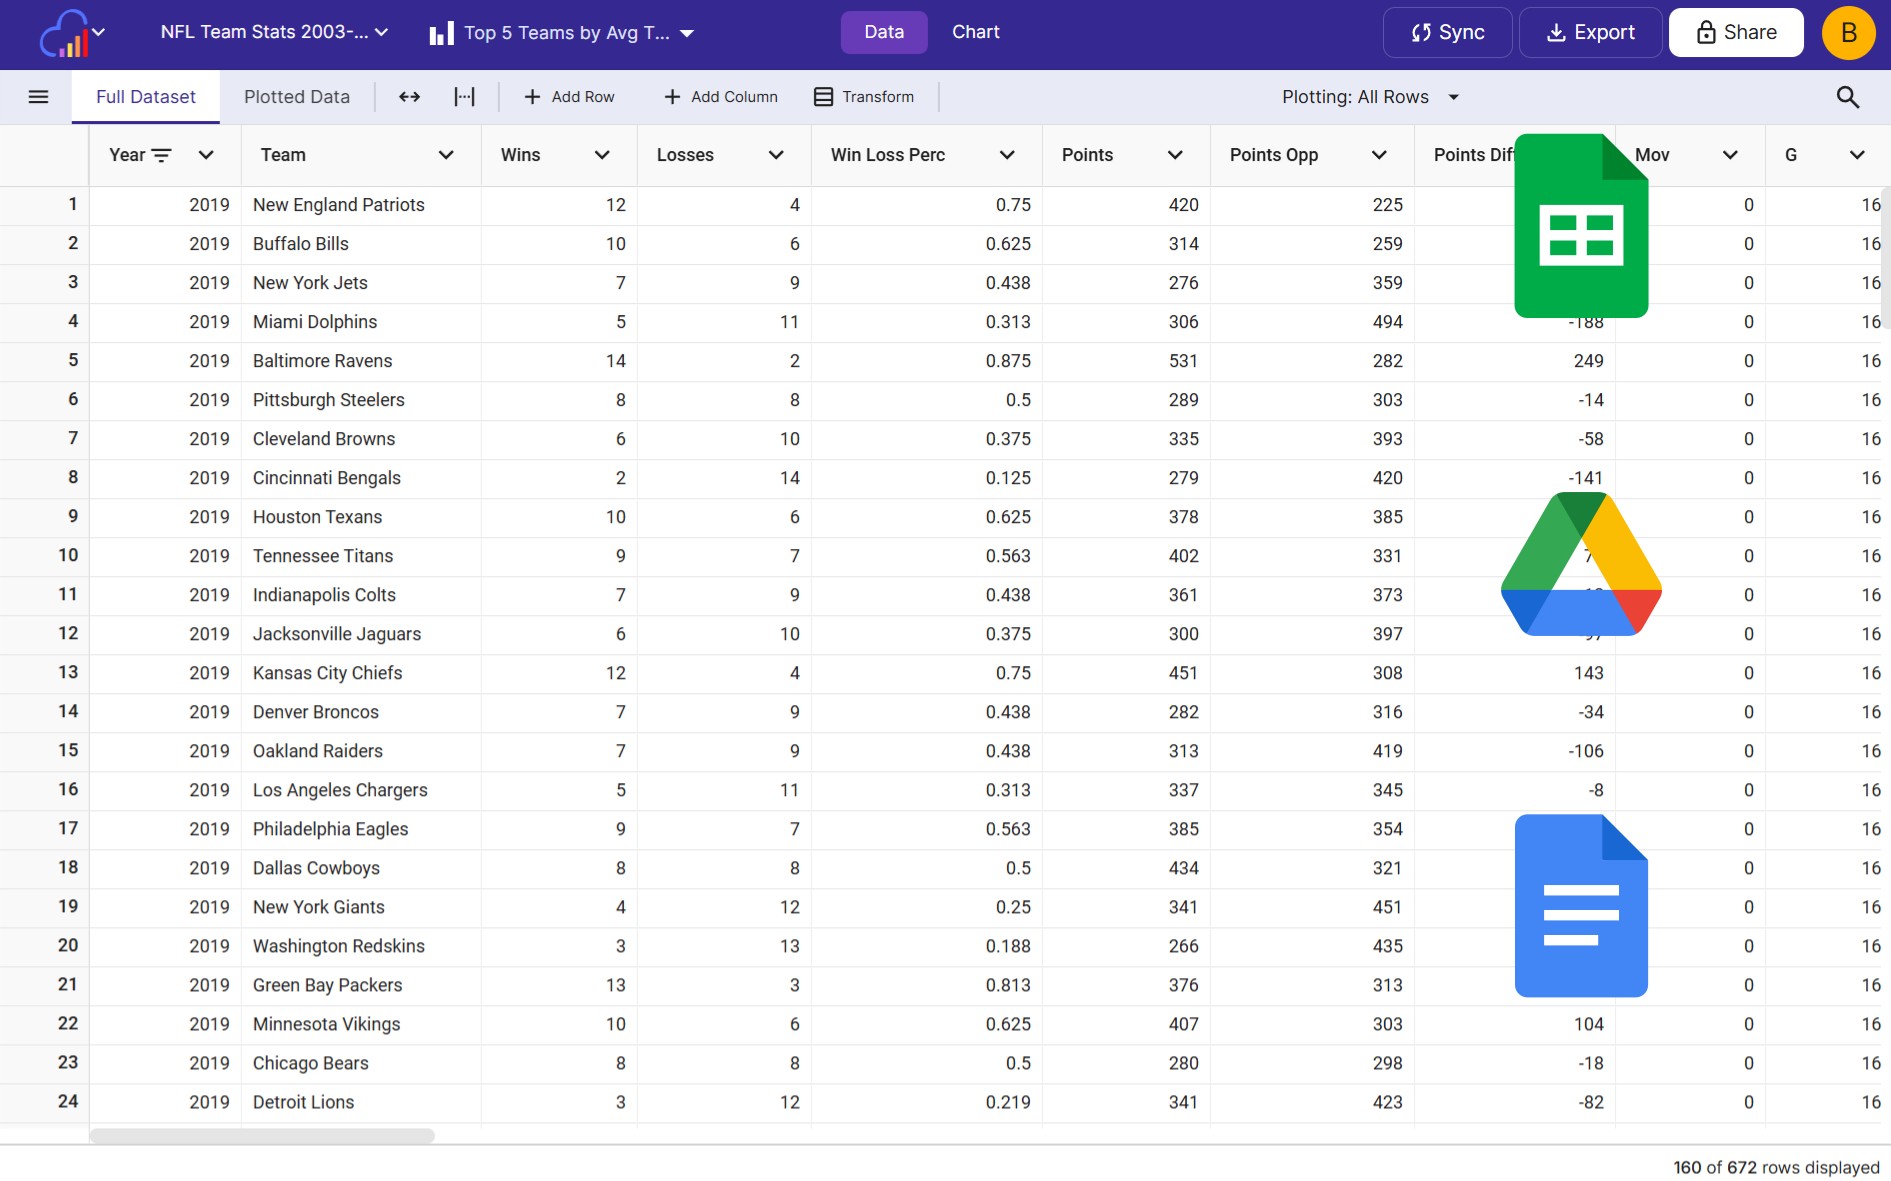
Connect to Google Sheets. Your charts update automatically when your data is synced.
Embed View Counts
Share analytics tells you how many times each chart was loaded, all time and over the last 30 days, with a day by day trend.
See Which Pages Load Your Charts
The top referring pages report ranks the URLs showing your embeds by view count, so you know which posts drive traffic and can spot sites embedding a chart you did not expect.
Control Who Can Embed
Whitelist the domains allowed to load your embeds so your charts only appear on the sites you approve.
Chart Images
Turn on image sharing to get a public image URL and image tag for newsletters, emails and platforms that only accept images.
Live data
Keep embedded charts up to date
Update the sheet behind a chart and every page that embeds it shows the new numbers. Your embed code stays the same.
Google Sheets & Drive Sync
Connect a Google Sheet or Drive file and sync on a schedule or whenever the original file changes.
Update From a File
Overwrite the data, append rows or add columns with a newer file, and your charts keep their settings.
Automate with Zapier
Send new rows from forms, stores and other apps into your sheet with the Zapier "Add Data Row" action.
Design
Charts that match your website
Style every chart to fit your site's colors and fonts, so embeds look like a natural part of your page.
10 Chart Themes
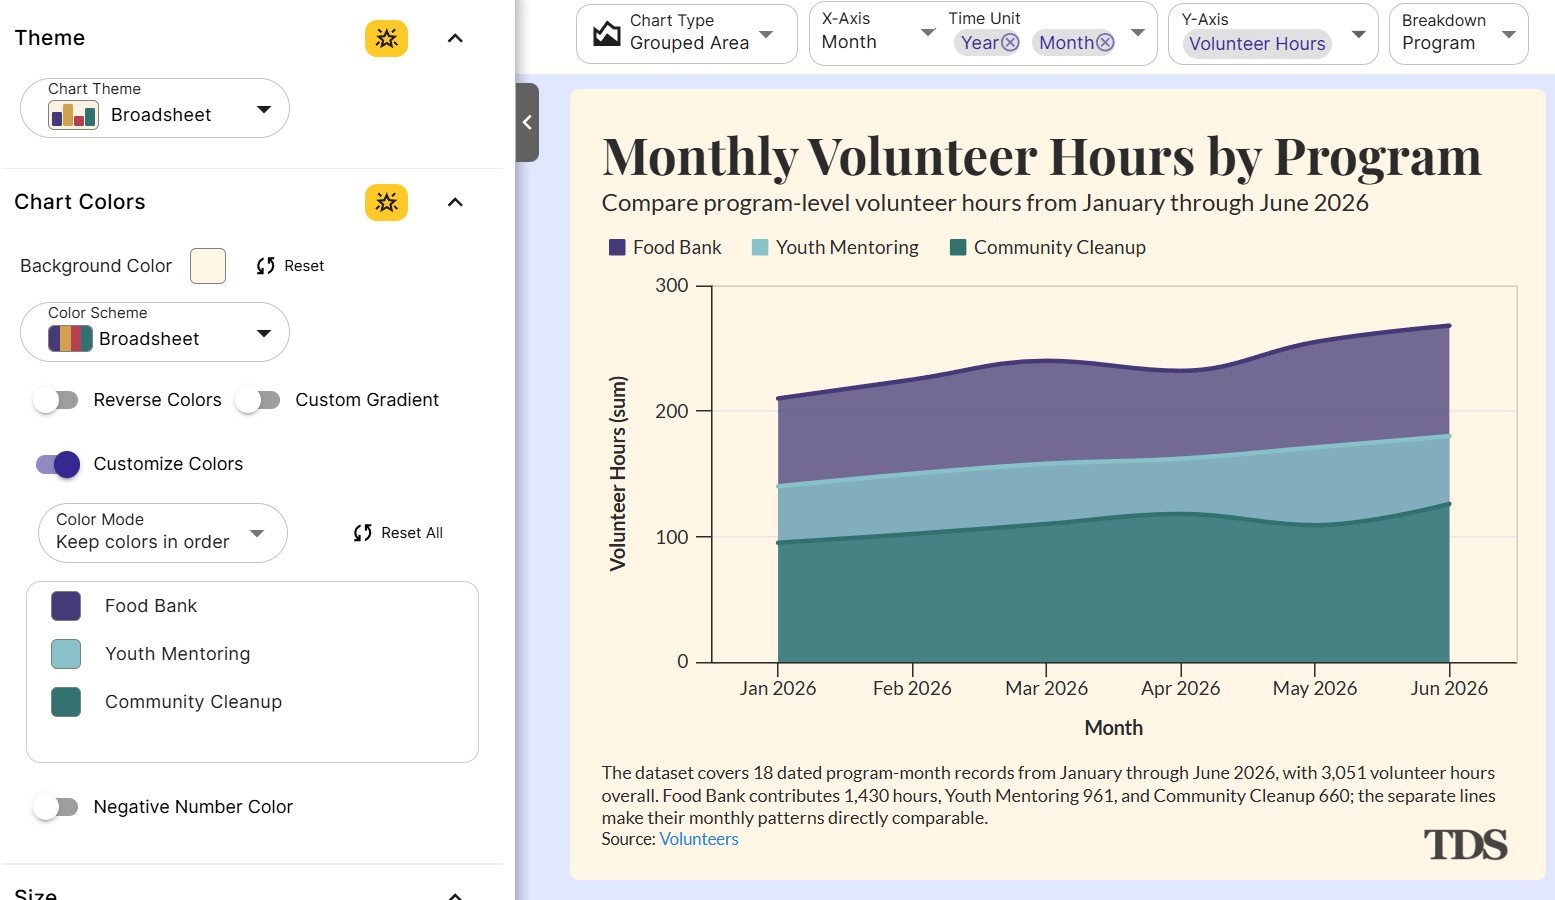
Set the background, colors, fonts and grid style at once with themes such as Midnight, Broadsheet and Financial.
Brand Colors & Fonts
Choose from 39 color palettes or your own colors, and use Google Fonts for titles and axis text.
Logos & Sources
Add your logo with an image annotation, plus a caption and source link so readers know where the data comes from.
FAQs
Website Embedding FAQs
Create a chart in InstaCharts, open the share dialog and turn sharing on. Copy the embed code from the "Embed in a webpage" tab and paste it into an HTML or embed block on your page. The chart appears as a live, interactive embed that readers can hover over to see tooltips.
InstaCharts embeds work on any site that accepts an HTML or iframe embed, including WordPress, Webflow, Ghost, Wix, Notion, Squarespace, Bubble and custom HTML websites. Paste the embed code into the platform's HTML, code or embed block to add the chart to a page or post.
Copy the embed code from the InstaCharts share dialog, then add a Custom HTML block to your WordPress post or page and paste the code into it. Preview the post to see the interactive chart. The same steps work for the HTML or embed blocks in Webflow, Ghost, Wix and Squarespace.
The Responsive embed tag includes a small script that resizes the frame to fit the chart, so the embed adjusts to phones, tablets and desktops. The Iframe Only tag is a plain iframe for platforms that accept iframes and strip scripts. Both tags let you set the width, height, border and background color of the embed.
Yes. Responsive chart sizing is the default, so the chart redraws to fit the space it has and text stays full size on small screens. You can also choose Scale Chart to Fit Screen, which stretches or shrinks the whole chart along with its text. On very small embeds, the embed toolbar collapses into a single menu to save room.
Yes. In the share settings, choose the views to include: Chart, Full Dataset and Plotted Data. When more than one view is included, the embed toolbar lets readers switch between the chart and sortable, filterable data tables. The Data Table Colors setting can match the tables to a dark or light chart background.
The embed toolbar is an optional bar under the embedded chart. Readers can use it to export the chart, open a larger full page view and switch between the chart and its data. Turn on Match Toolbar to Chart to color the toolbar with the chart background, and the text and buttons switch to light or dark so they stay readable.
Yes. Embeds always show the latest version of the sheet behind the chart. Connect a Google Sheet or Google Drive file and set a sync schedule, update the sheet with a newer file from your device, or add rows through the Zapier "Add Data Row" action. The embed code stays the same, so the chart on your page updates with zero edits to your website.
Yes. Share the full dataset or the plotted data of a chart and embed it on your site as a sortable, filterable table. Readers can sort any column and search the data, which suits rankings, price lists, statistics and directories.
Yes. Turn on image sharing in the Share Image tab to get a public image URL and an image tag for your chart. Use the image in newsletters, emails and platforms that accept images and block interactive embeds.
Yes. Export any chart as a PNG, SVG, JPG, WebP, PDF or PowerPoint file to use in blog posts, social media posts, articles and reports. You can also export the chart data as a CSV, Excel, TSV or JSON file to offer readers a download.
Yes. Paid plans include embed analytics for every shared chart. See an all time summary, views over the last 30 days with a day by day or month by month trend, and the top referring pages that load your embed for the last 30 days and all time. Every analytics table can be exported to CSV, and individual visitors stay anonymous.
Paid plans can turn on Whitelist Domains in the share settings and add the domains and subdomains allowed to load your embeds, such as blog.example.com. Turn off Allow Top Level Loading to keep the chart viewable only as an embed on your approved sites, or leave it on so the full page share link works too.
Yes. Apply one of 10 chart themes, pick from 39 color palettes or set your own brand colors, choose Google Fonts for the chart text, and add your logo with an image annotation. Set the embed background color and border in the embed code options so the chart blends into your page.
Yes. Turn on a chart template in the Templates tab of the share dialog, then pass new data in the URL to create an interactive chart page, an embed or a chart image with the same styling. Templates suit sites that publish the same kind of chart for many products, teams or locations.
Yes. The free plan lets you create and embed charts using up to 500 rows of data per sheet, and free embeds include a small InstaCharts link. Paid plans starting at $10 per user per month remove the row limit and the watermark, and add embed analytics and domain whitelisting.
Start Engaging Your Readers Today
InstaCharts makes data visualization easy, so you can build clear reports without design experience.