· charts
When to use a pie chart
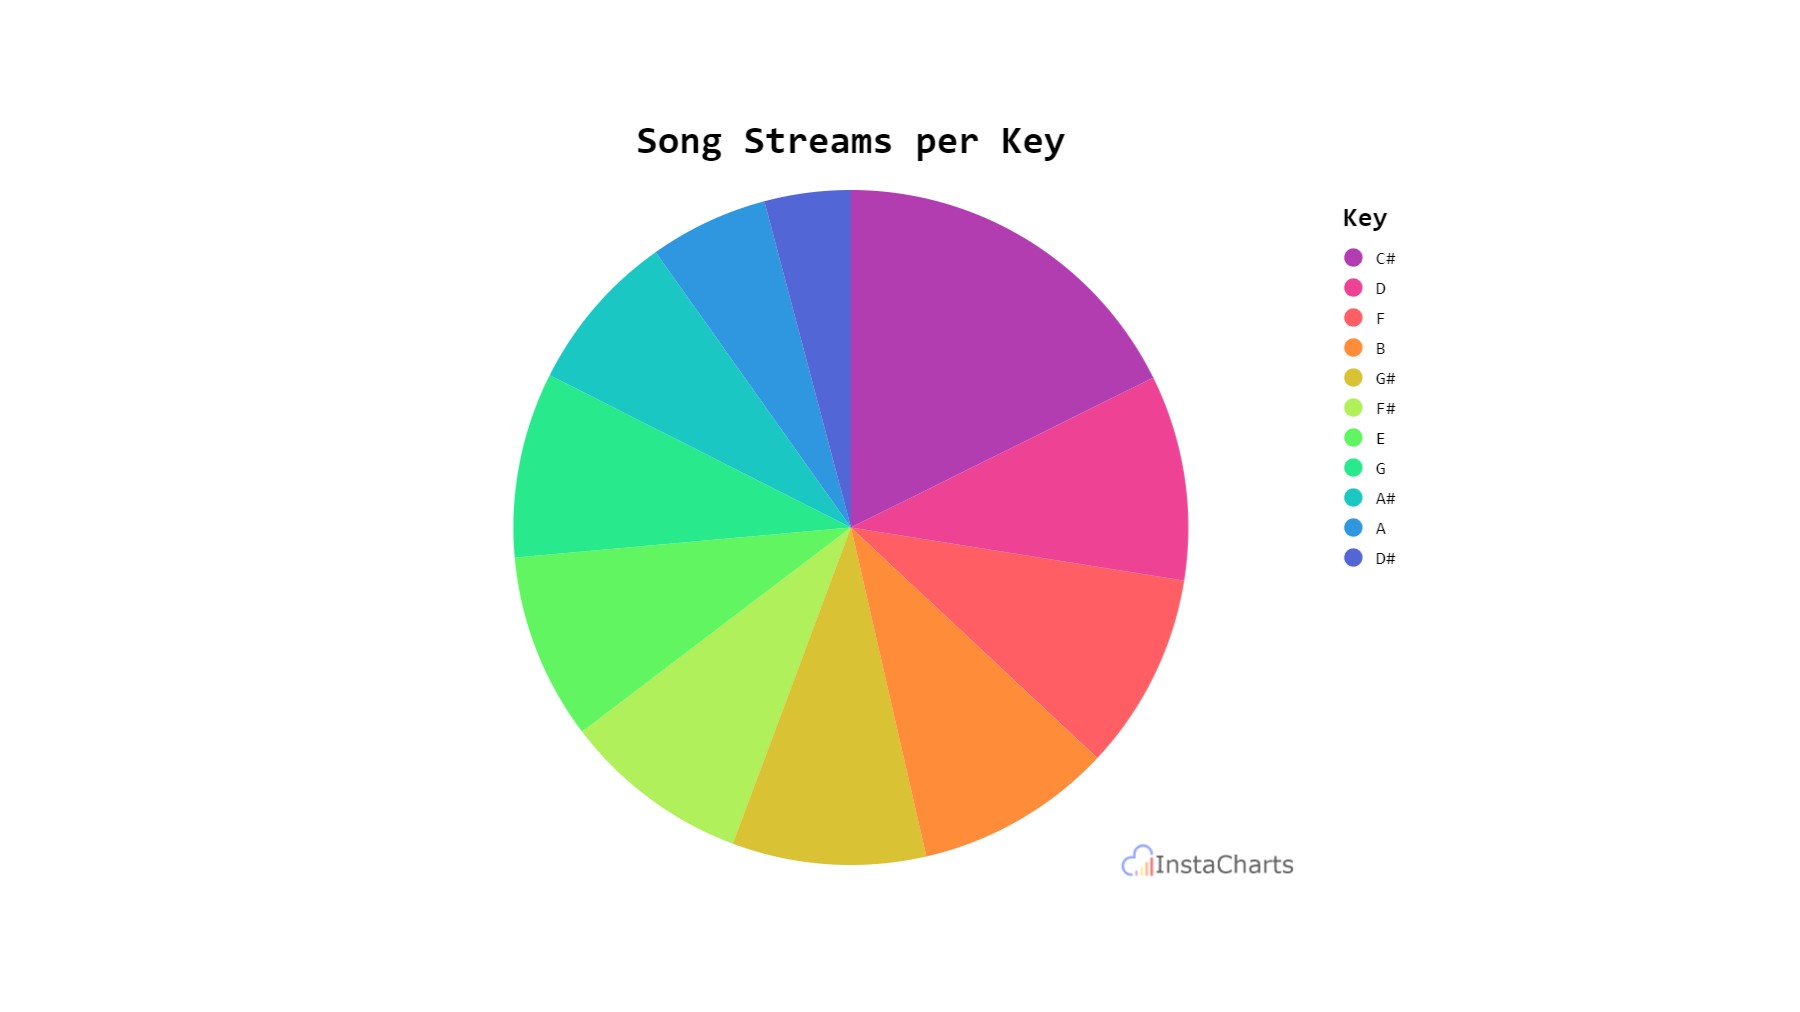
Use pie charts to show categorical data, whose values can be added together to form a whole amount.

Use pie charts to show categorical data, whose values can be added together to form a whole amount.

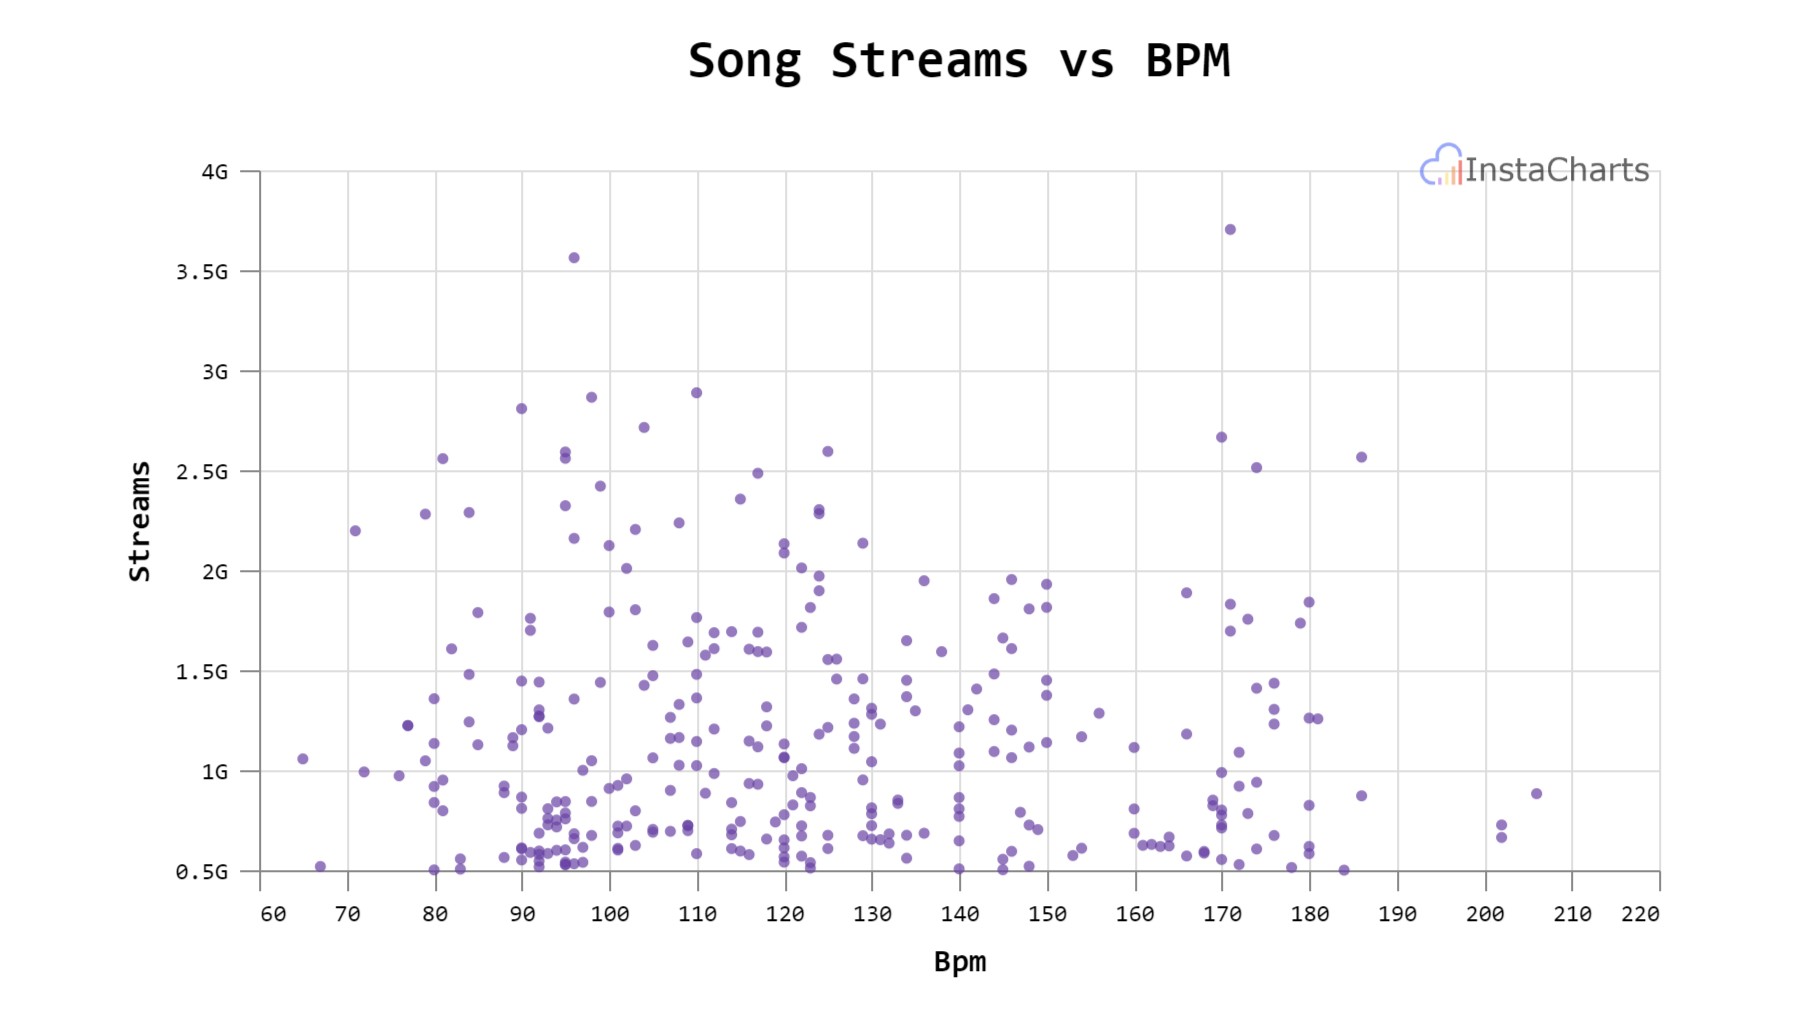
Use a scatter plot chart to quickly visualize the relationship between two numeric values

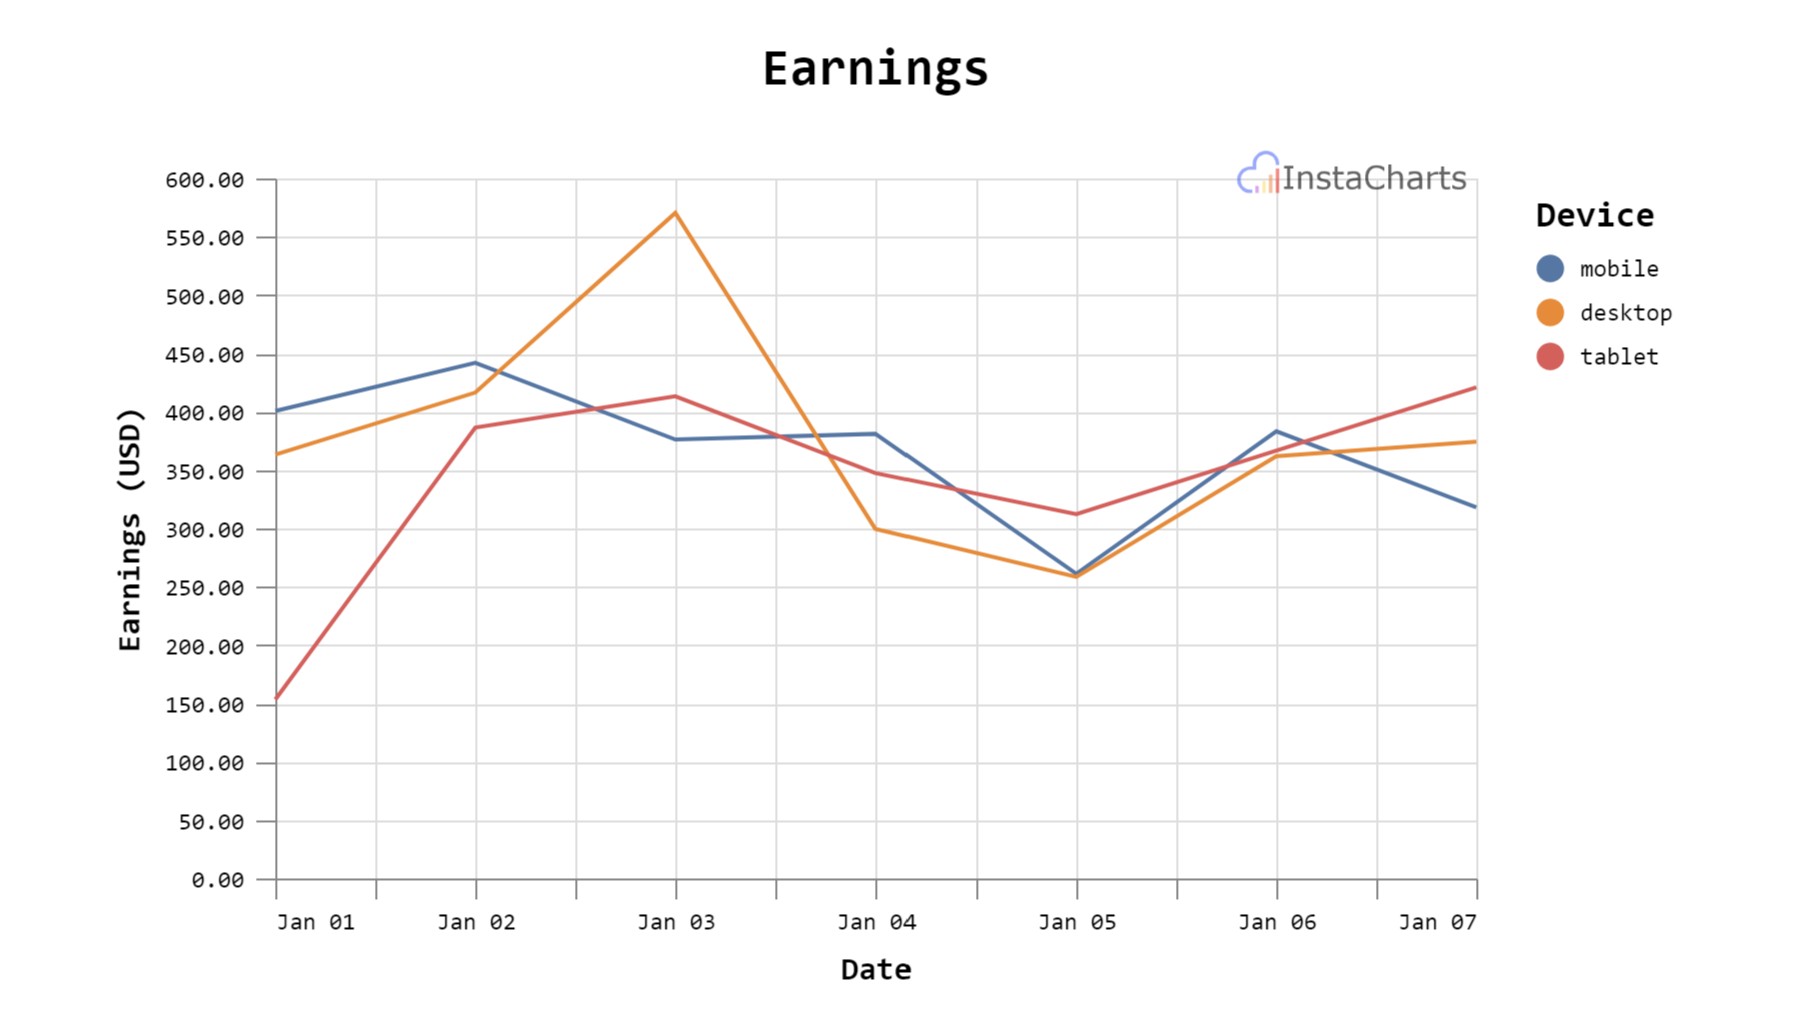
Use line charts to show trends over time, to compare multiple trends and to show relationships between variables.

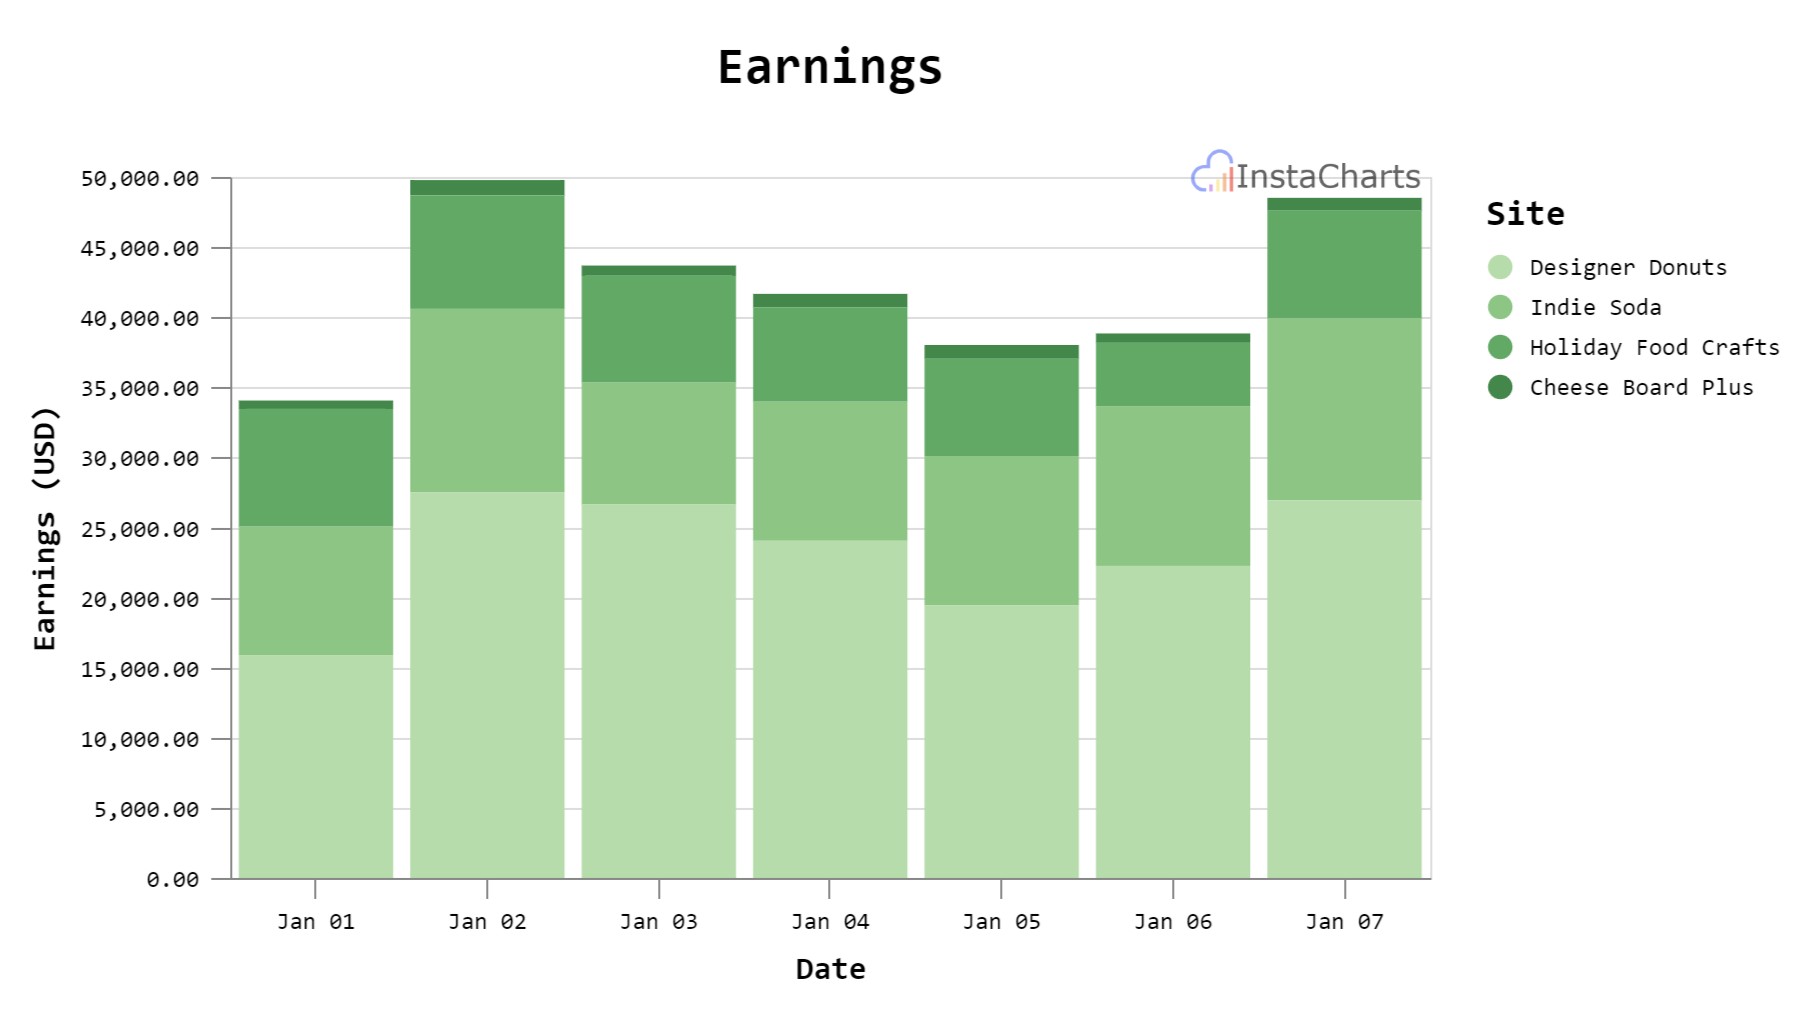
Use bar charts for frequency distributions, relative frequencies, comparisons between groups and changes over time.