
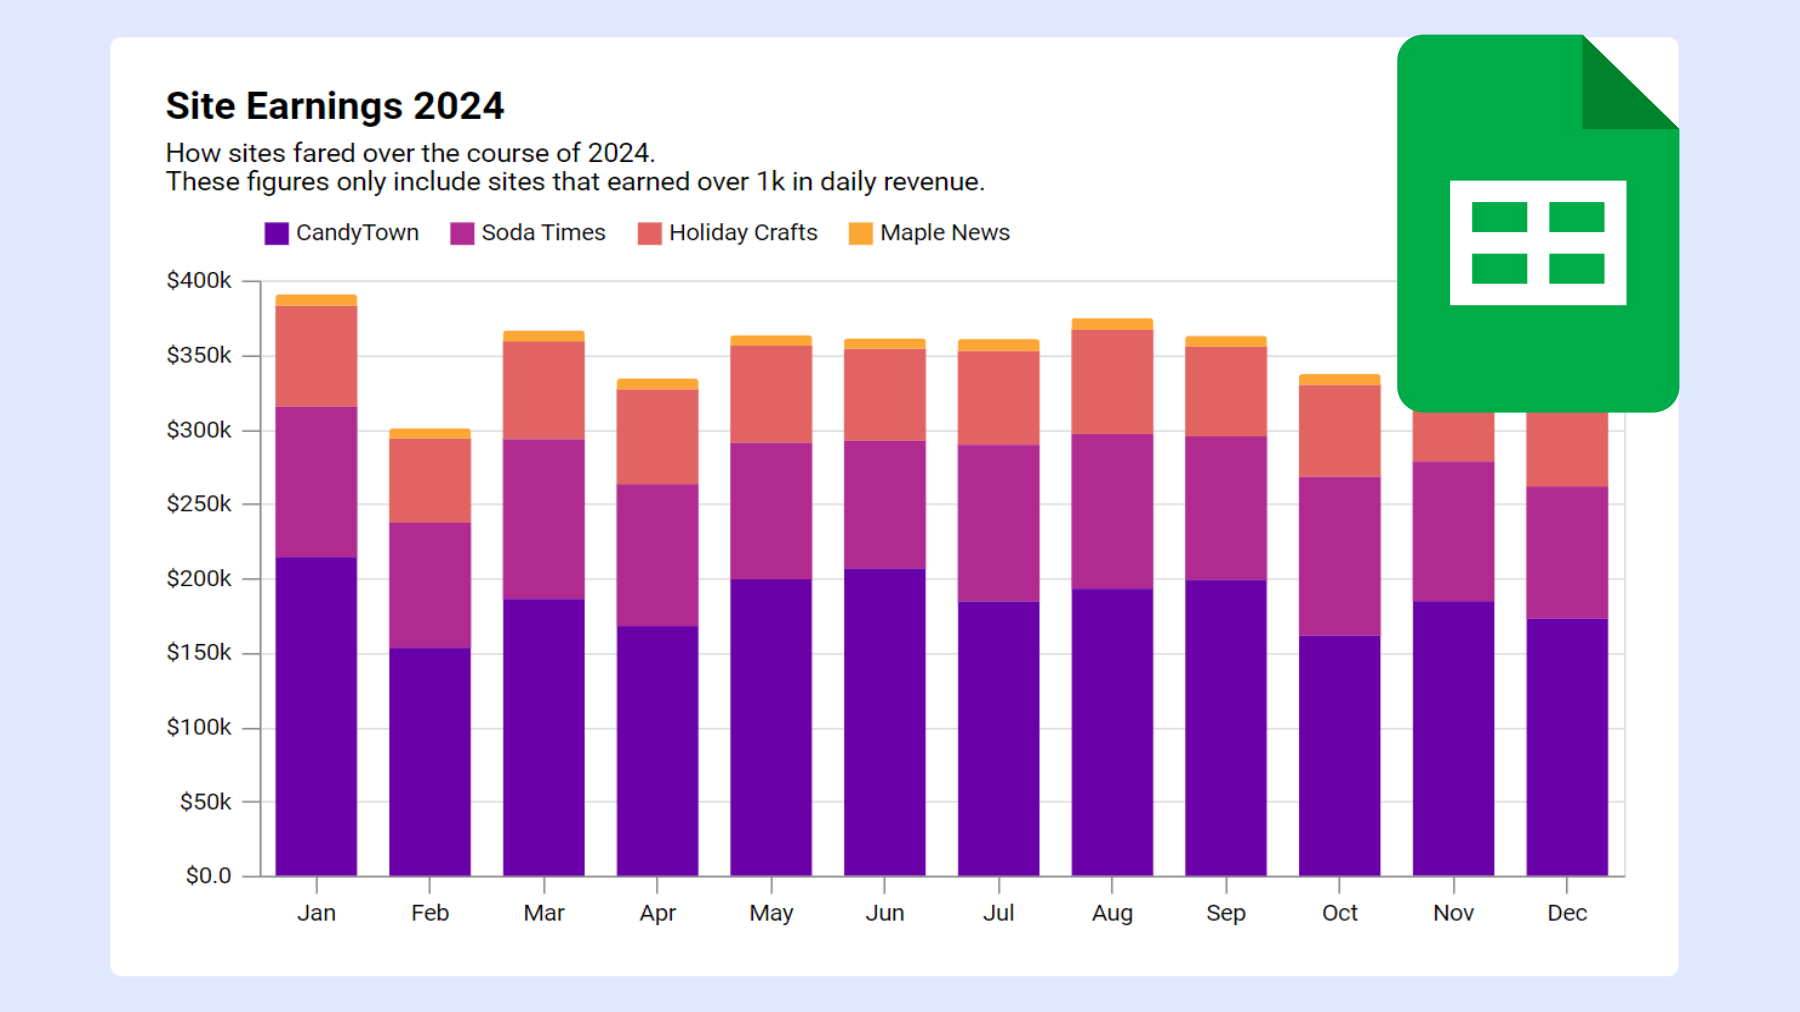
How to create a chart from Google Sheets
Connect your Google Sheet to InstaCharts to get a chart that automatically updates with your changes
Connect your Google Sheet to InstaCharts to get a chart that automatically updates with your changes
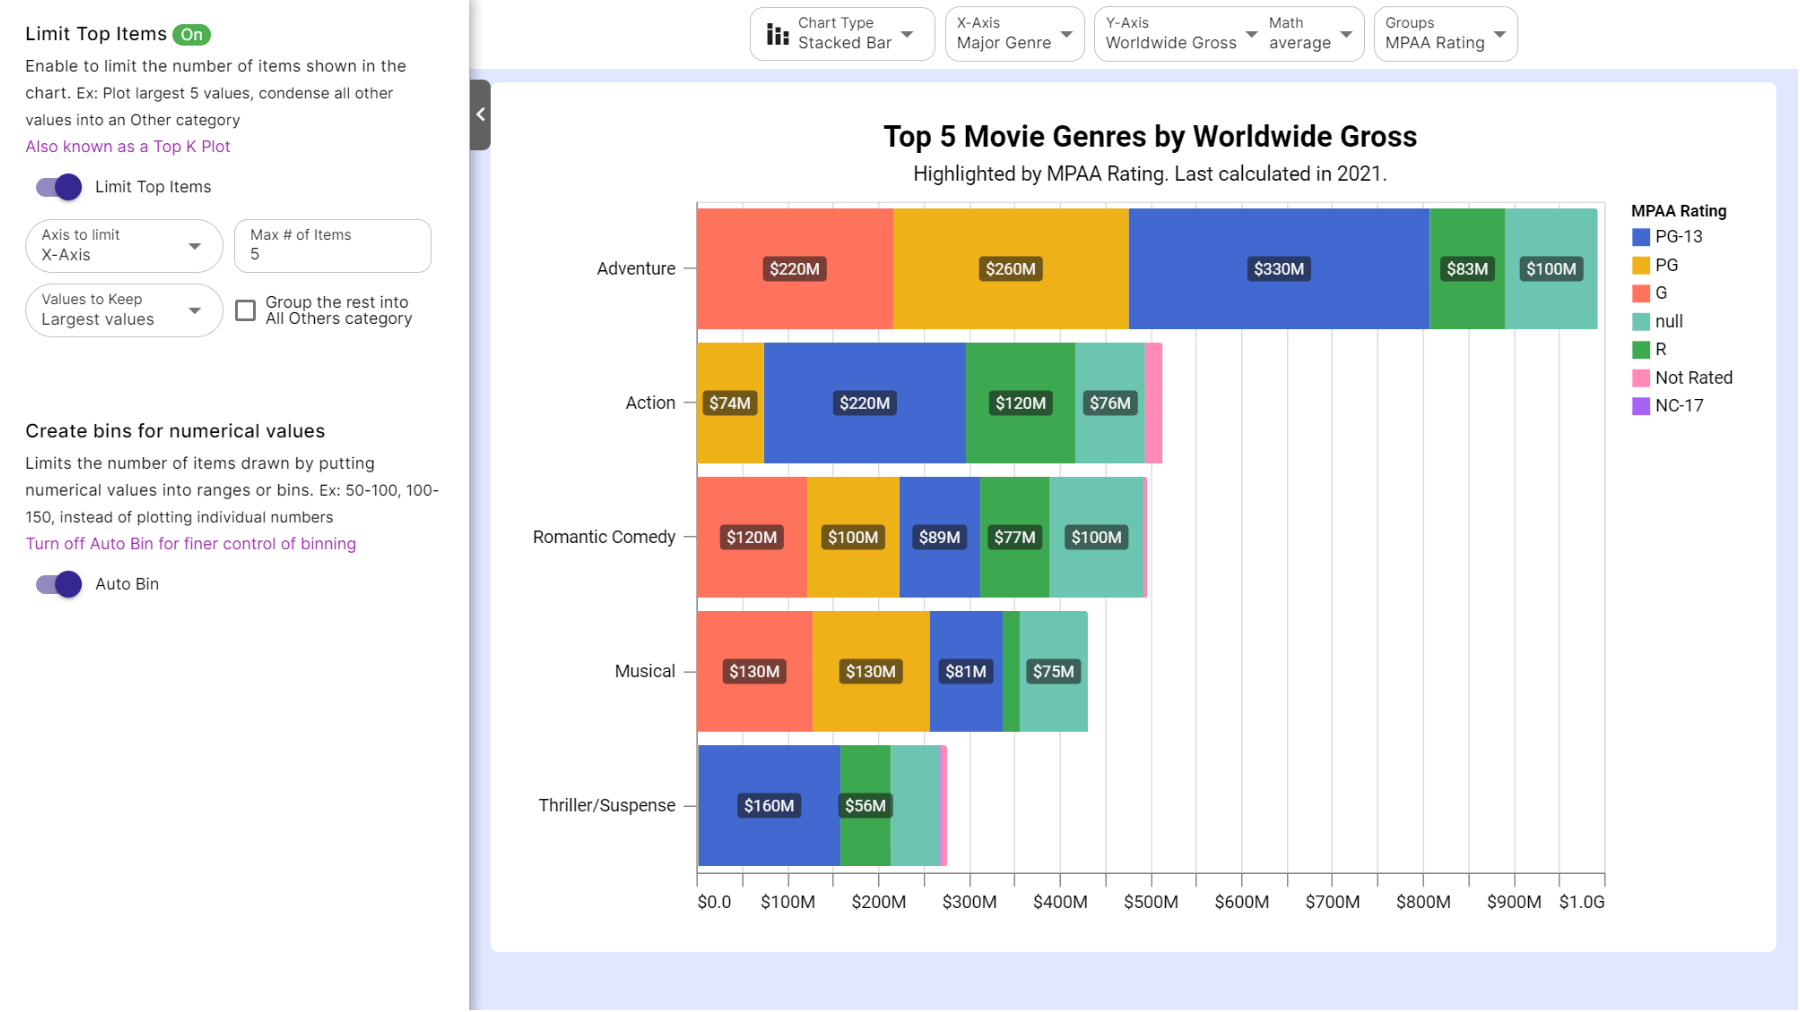
Upload the csv file to InstaCharts and use the Limit Items settings
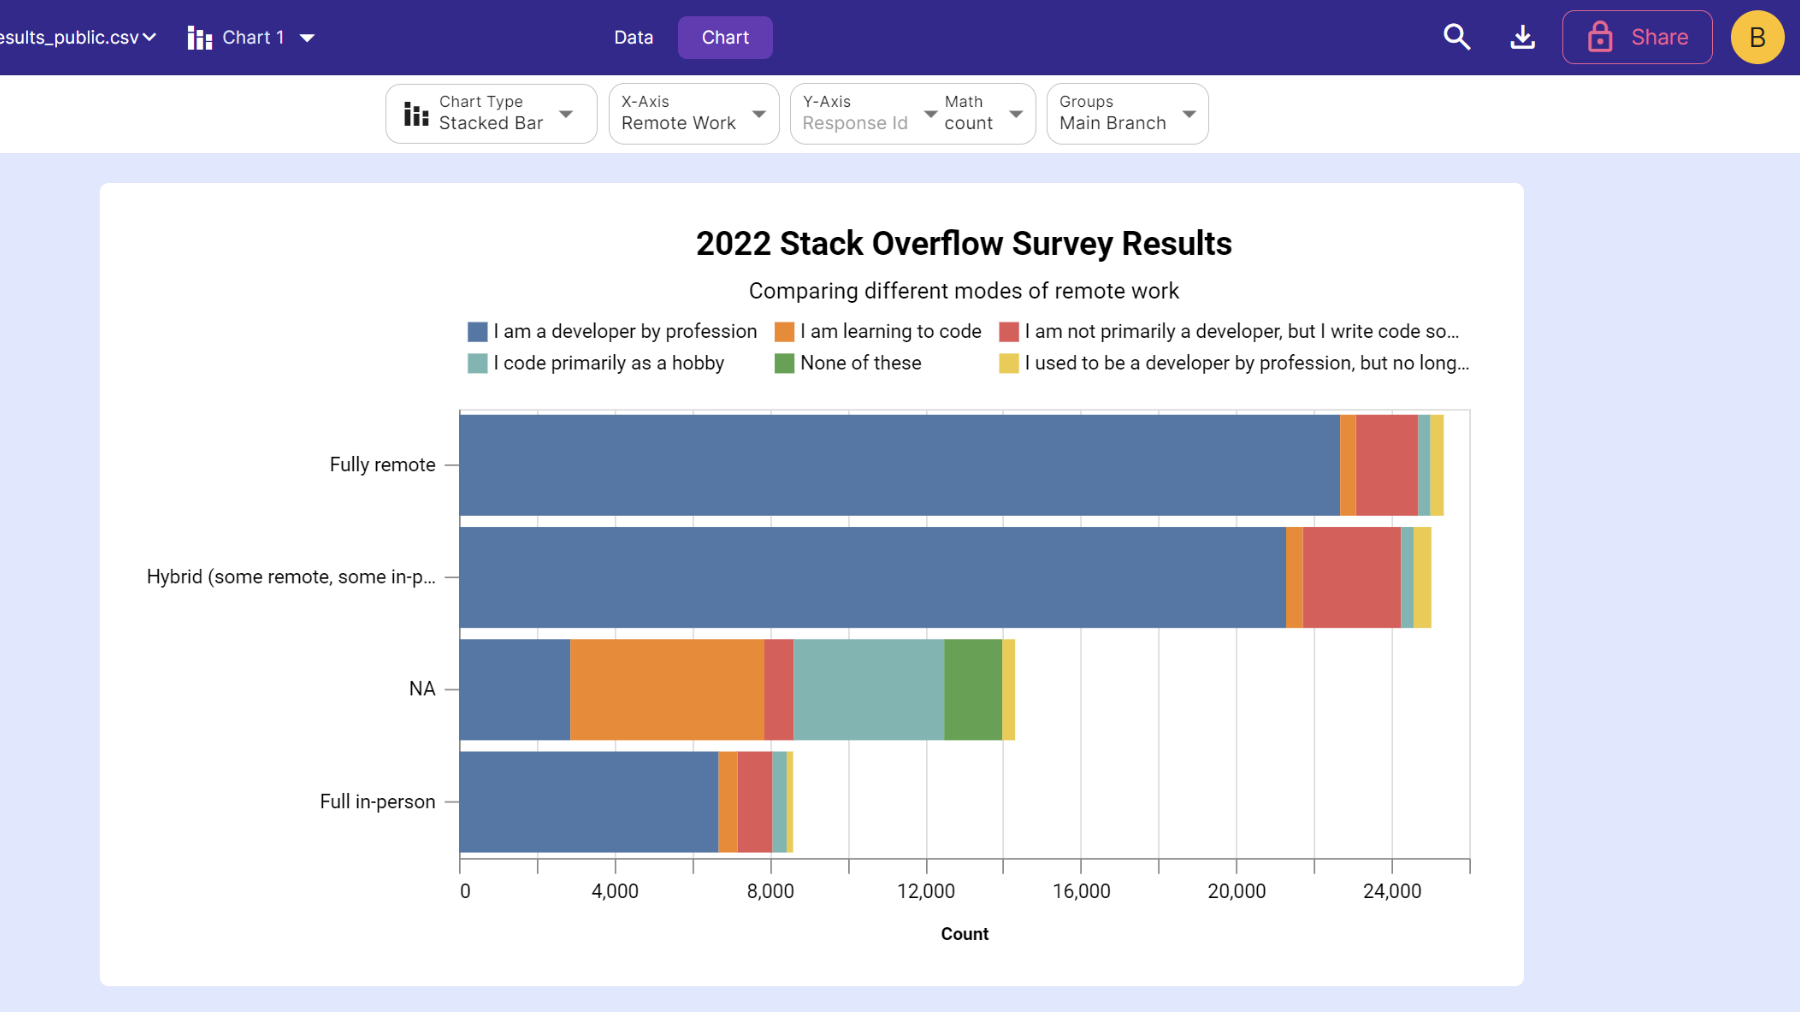
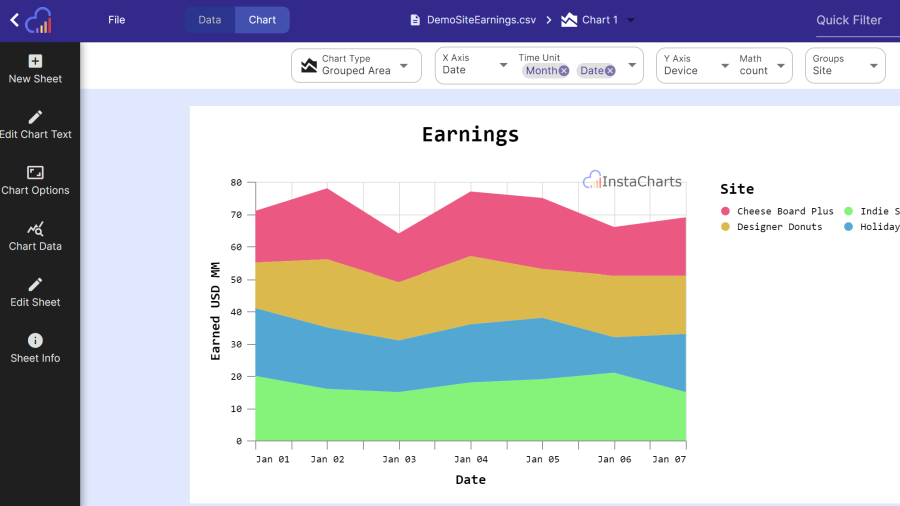
Stacked Bar charts easily show how two different survey sub categories relate to each other
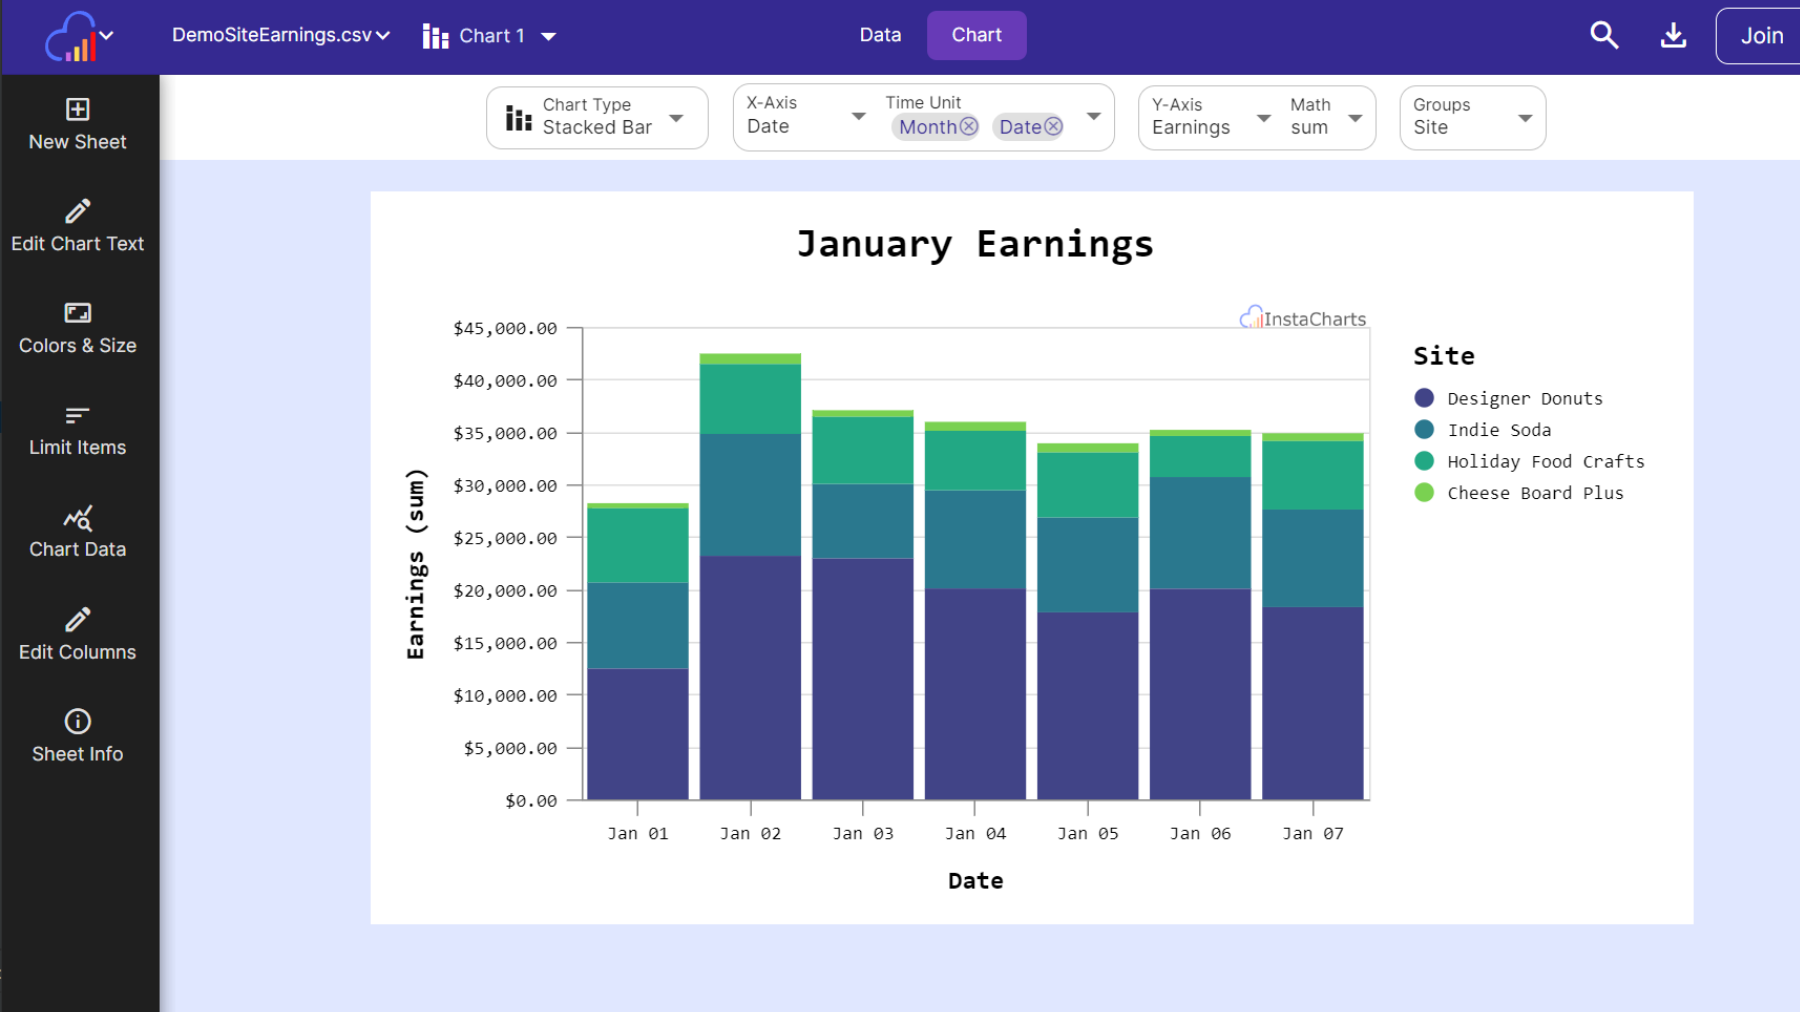
Upload the CSV file to InstaCharts for quick processing
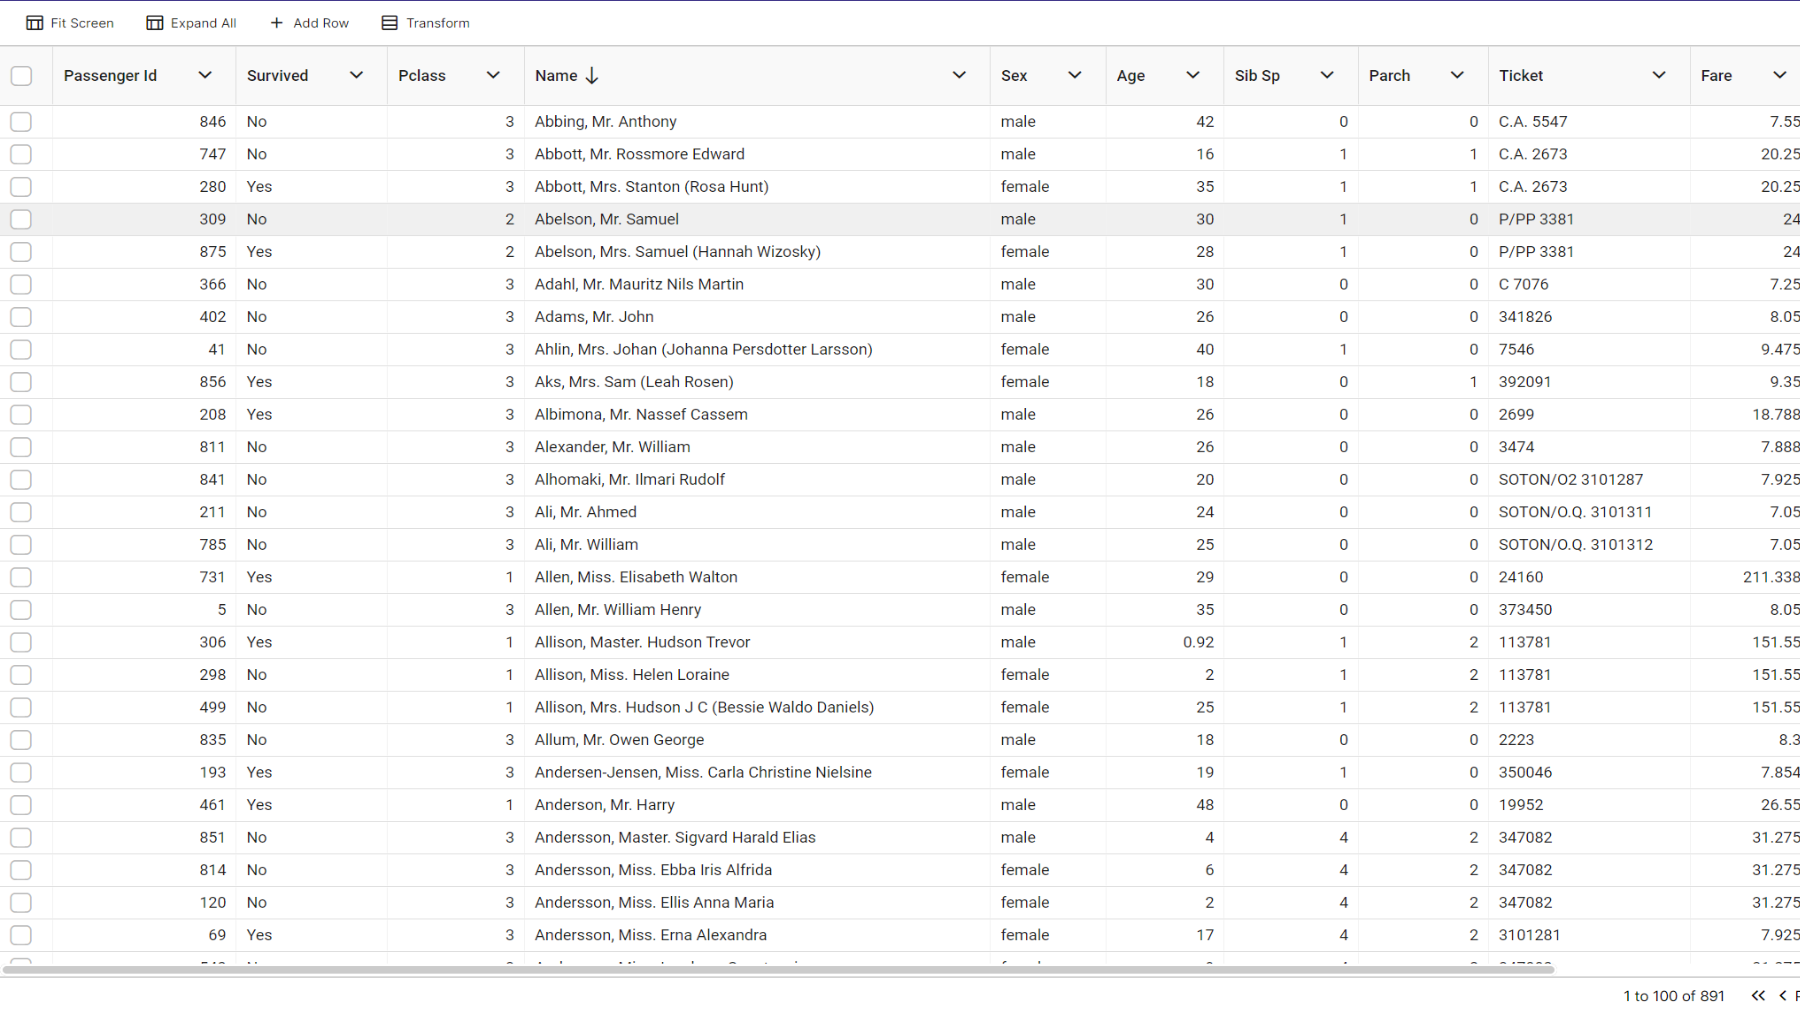
Upload the CSV file to InstaCharts for quick viewing
Upload the JSON file to InstaCharts for quick processing
Upload the excel workbook to InstaCharts for quick processing
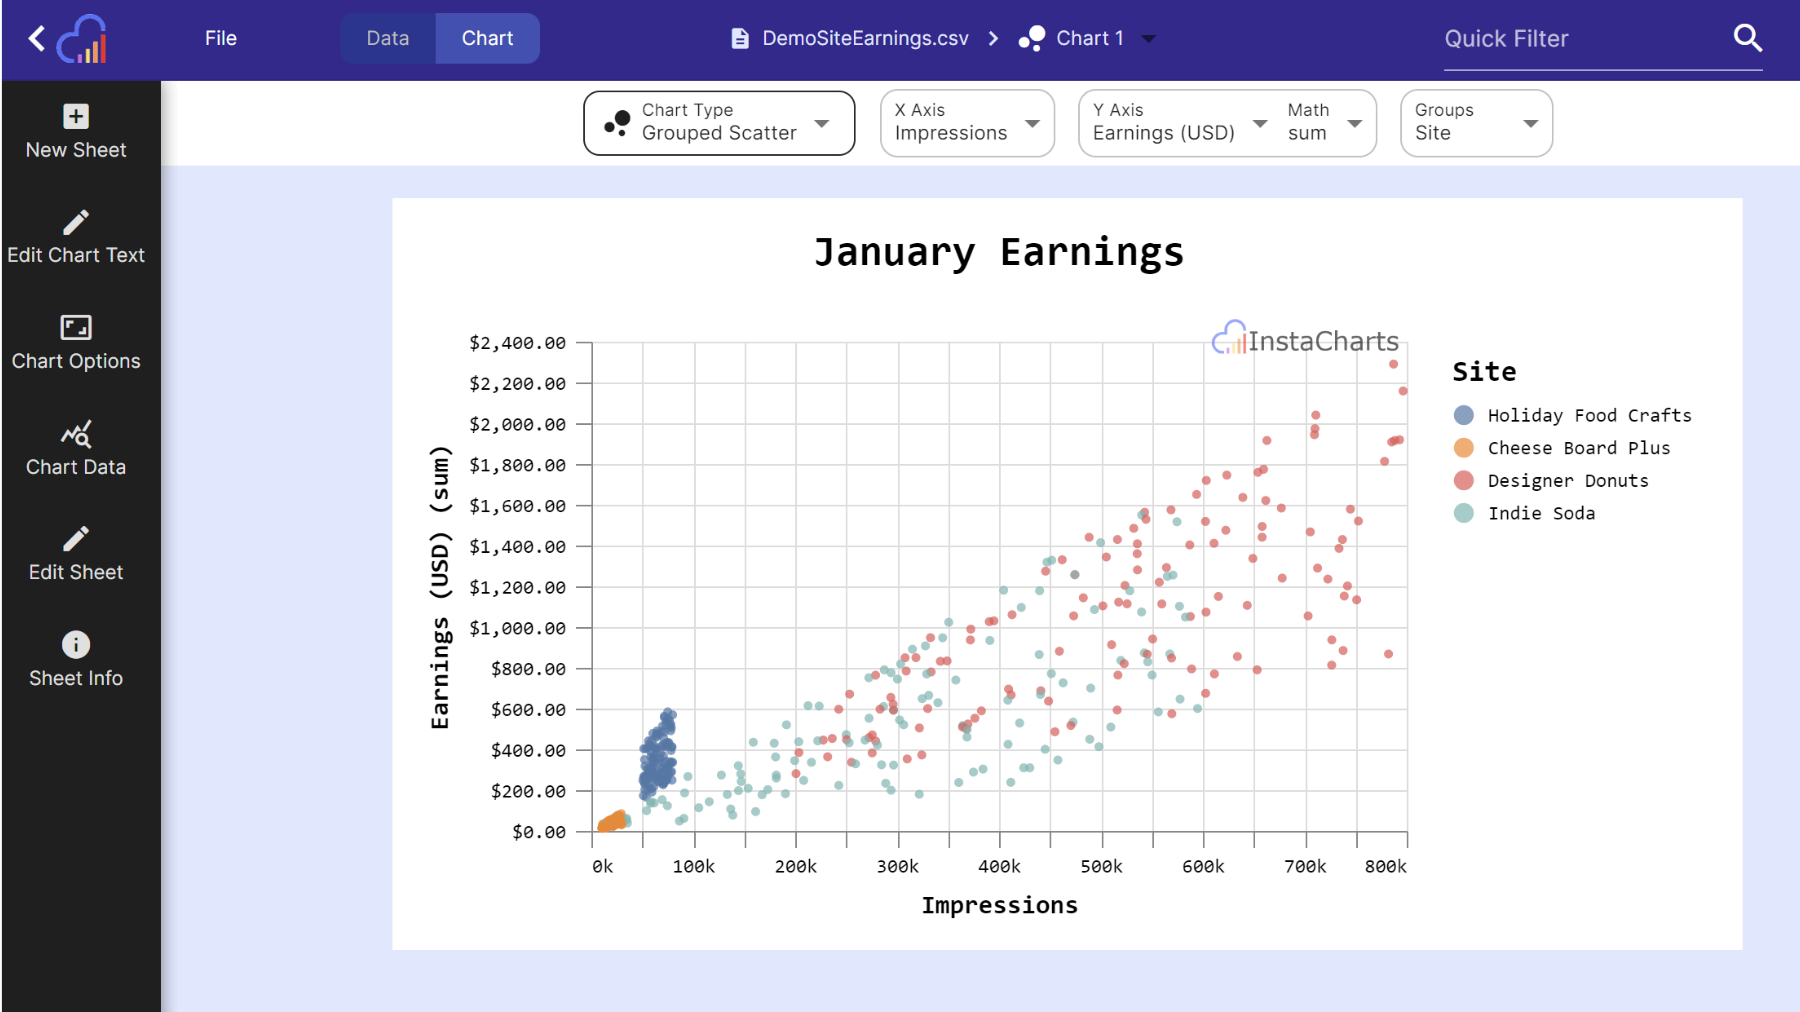
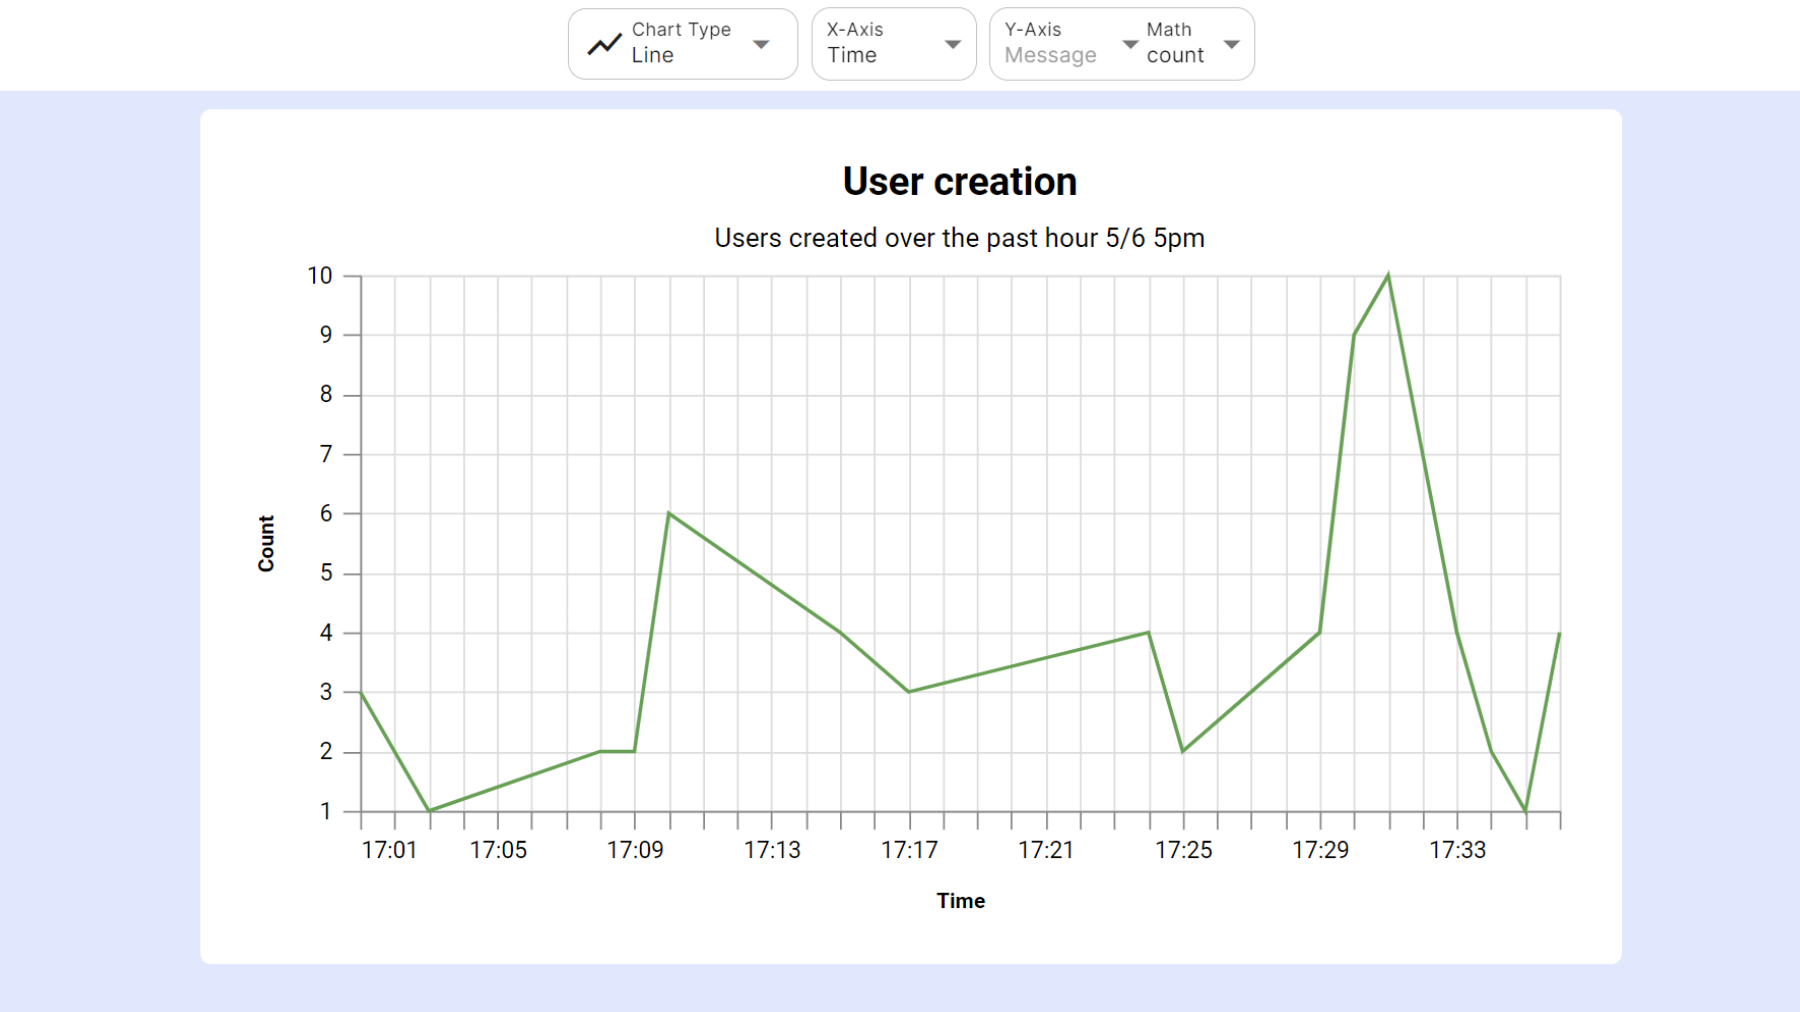
Upload a csv to instantly produce a graph or scatterplot