· charts
When to use a line chart
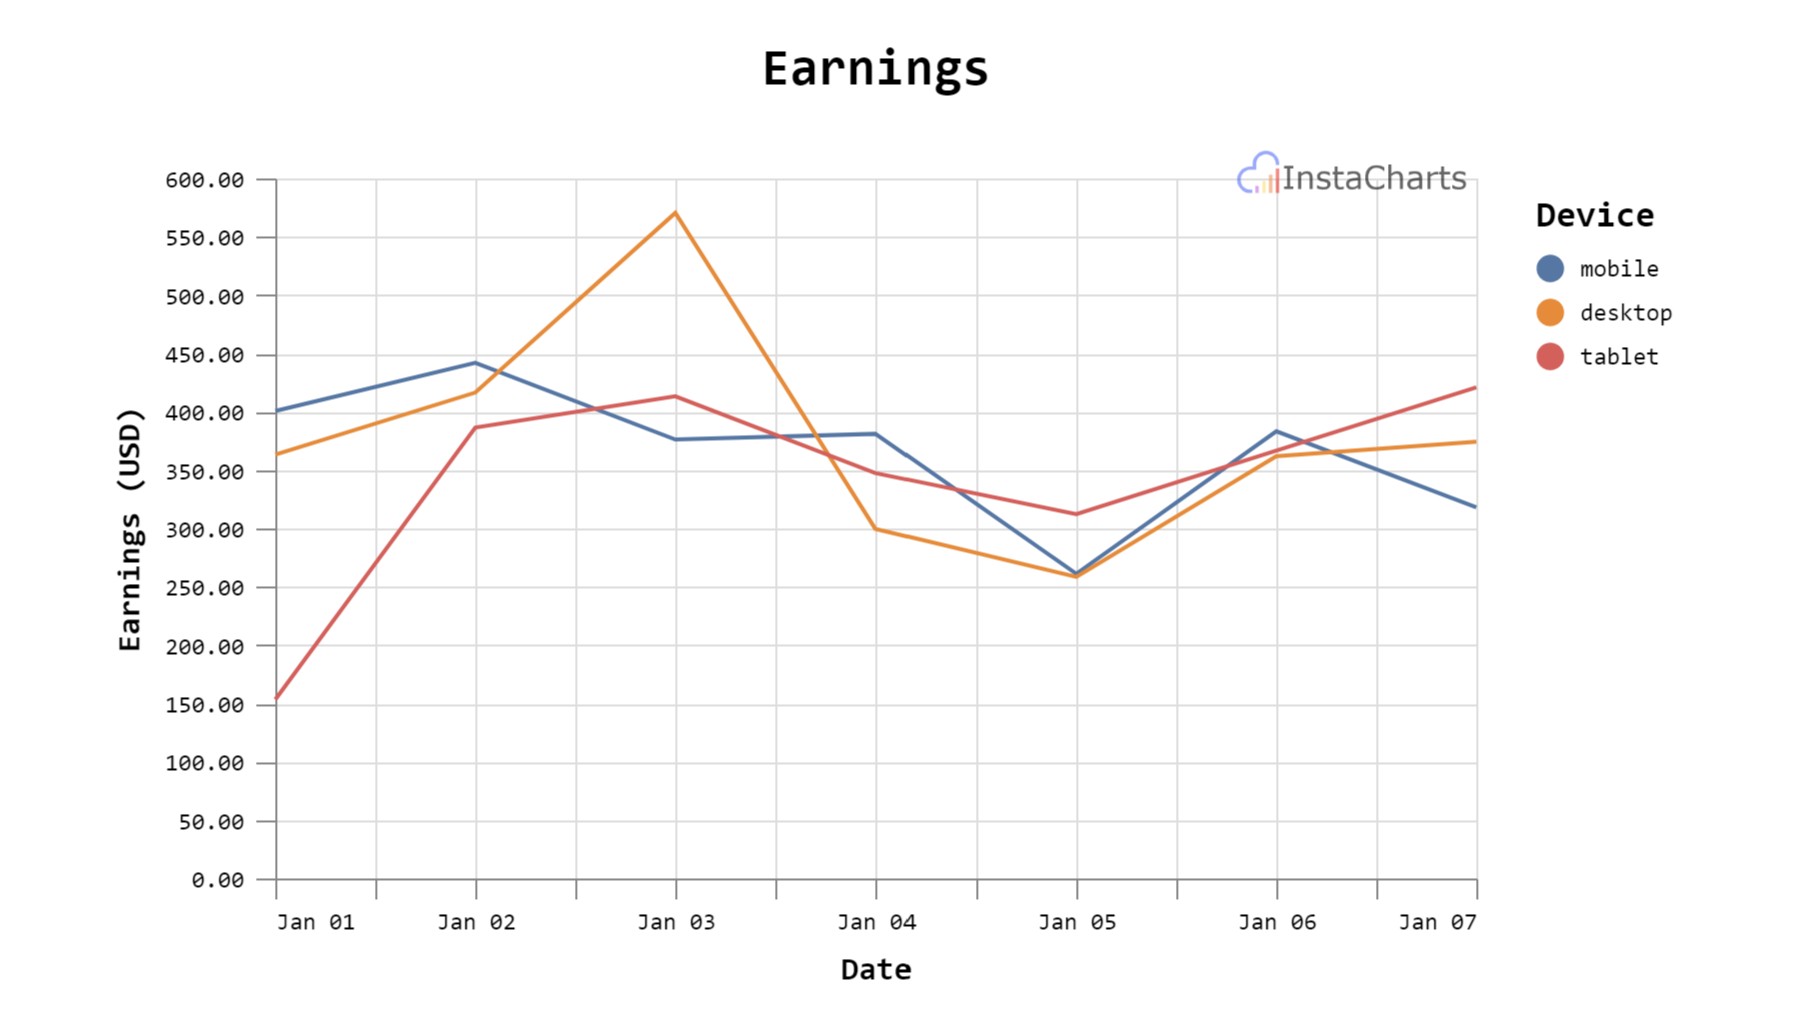
Use line charts to show trends over time, to compare multiple trends and to show relationships between variables.

Use line charts to show trends over time, to compare multiple trends and to show relationships between variables.