
For Marketers
Turn Campaign Data Into Reports That Win Clients
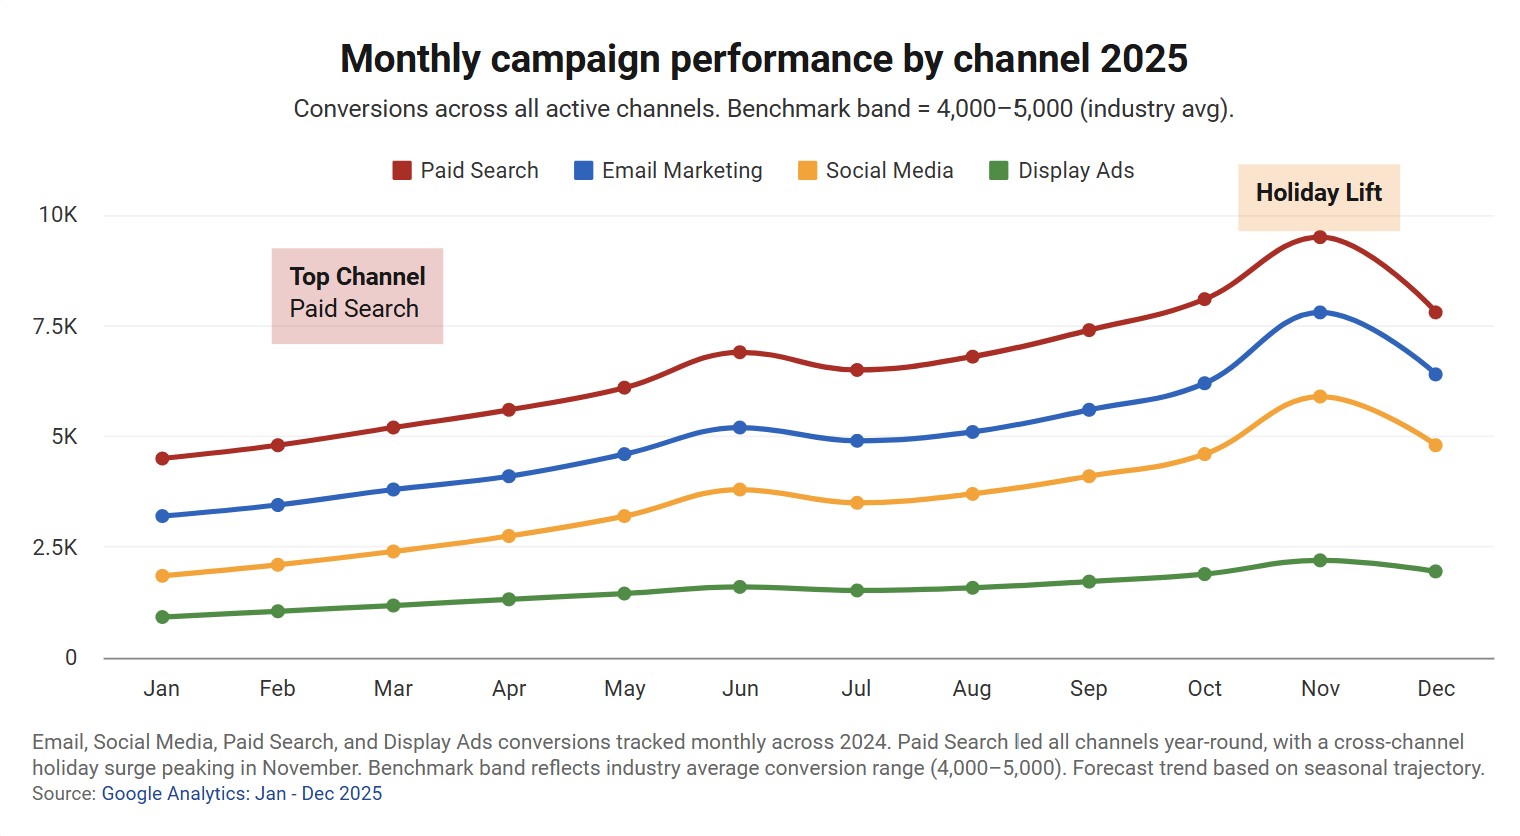
Visualize ad performance, social metrics, and ROI in charts that tell the story – without needing a data analyst on your team.
From Spreadsheet to Stakeholder-Ready in Minutes
Import your campaign metrics from CSV, Excel, or Google Sheets and generate polished charts instantly. Spend your time on strategy, not formatting.
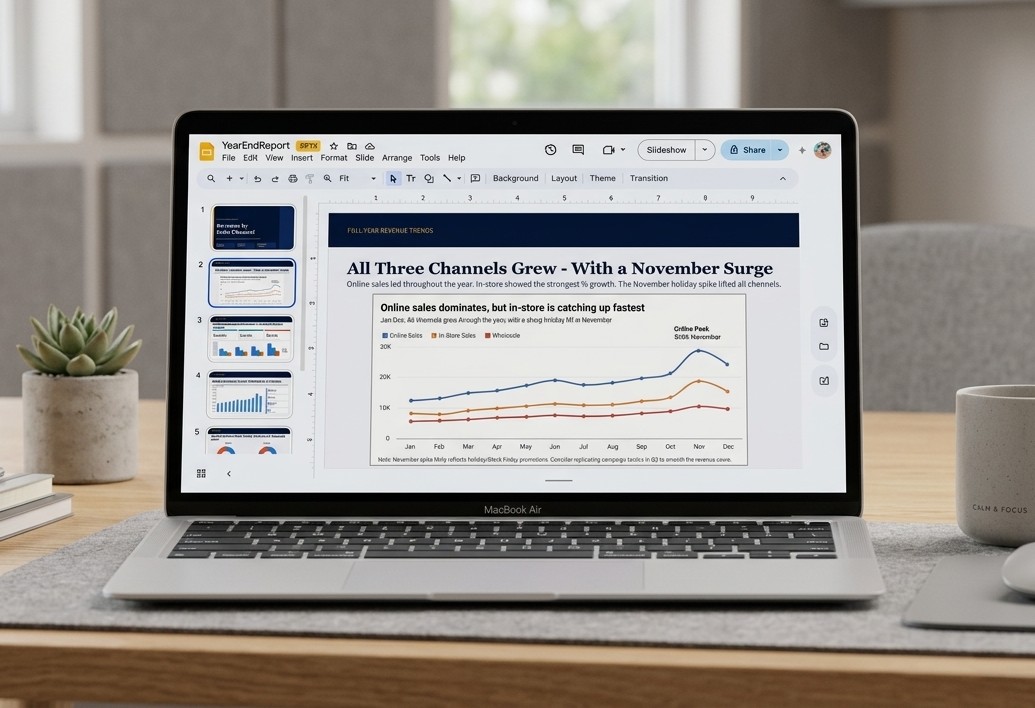
Drop Charts Into Your Existing Workflow
Export or embed: PNG, SVG, PDF, PowerPoint, or a live embed link.
Works seamlessly with:
- Google Slides
- PowerPoint
- Notion
- Confluence
- HubSpot pages
- WordPress
- Webflow
- PDF reports
One Live Dashboard for Every Client
Combine campaign charts, KPI widgets for ROAS and conversions, data tables and text widgets into a single marketing dashboard. Send clients one live link instead of rebuilding a slide deck every month.

Everything a Marketer Needs
Live Data from Google Sheets
Connect your Google Sheets and your charts update automatically when data changes. Always up to date for your next client call.
Branded Visuals
Match your brand colors and fonts in seconds. Deliver charts that look like they came from your design team.
Shareable Links
Share a private or public link to any chart. Clients and stakeholders can view live charts without needing an account.
Start Building Better Marketing Reports
Boost your productivity. Elevate your reports. InstaCharts makes data visualization effortless.