Aggregation
Automatic aggregation is applied to most charts in InstaCharts.
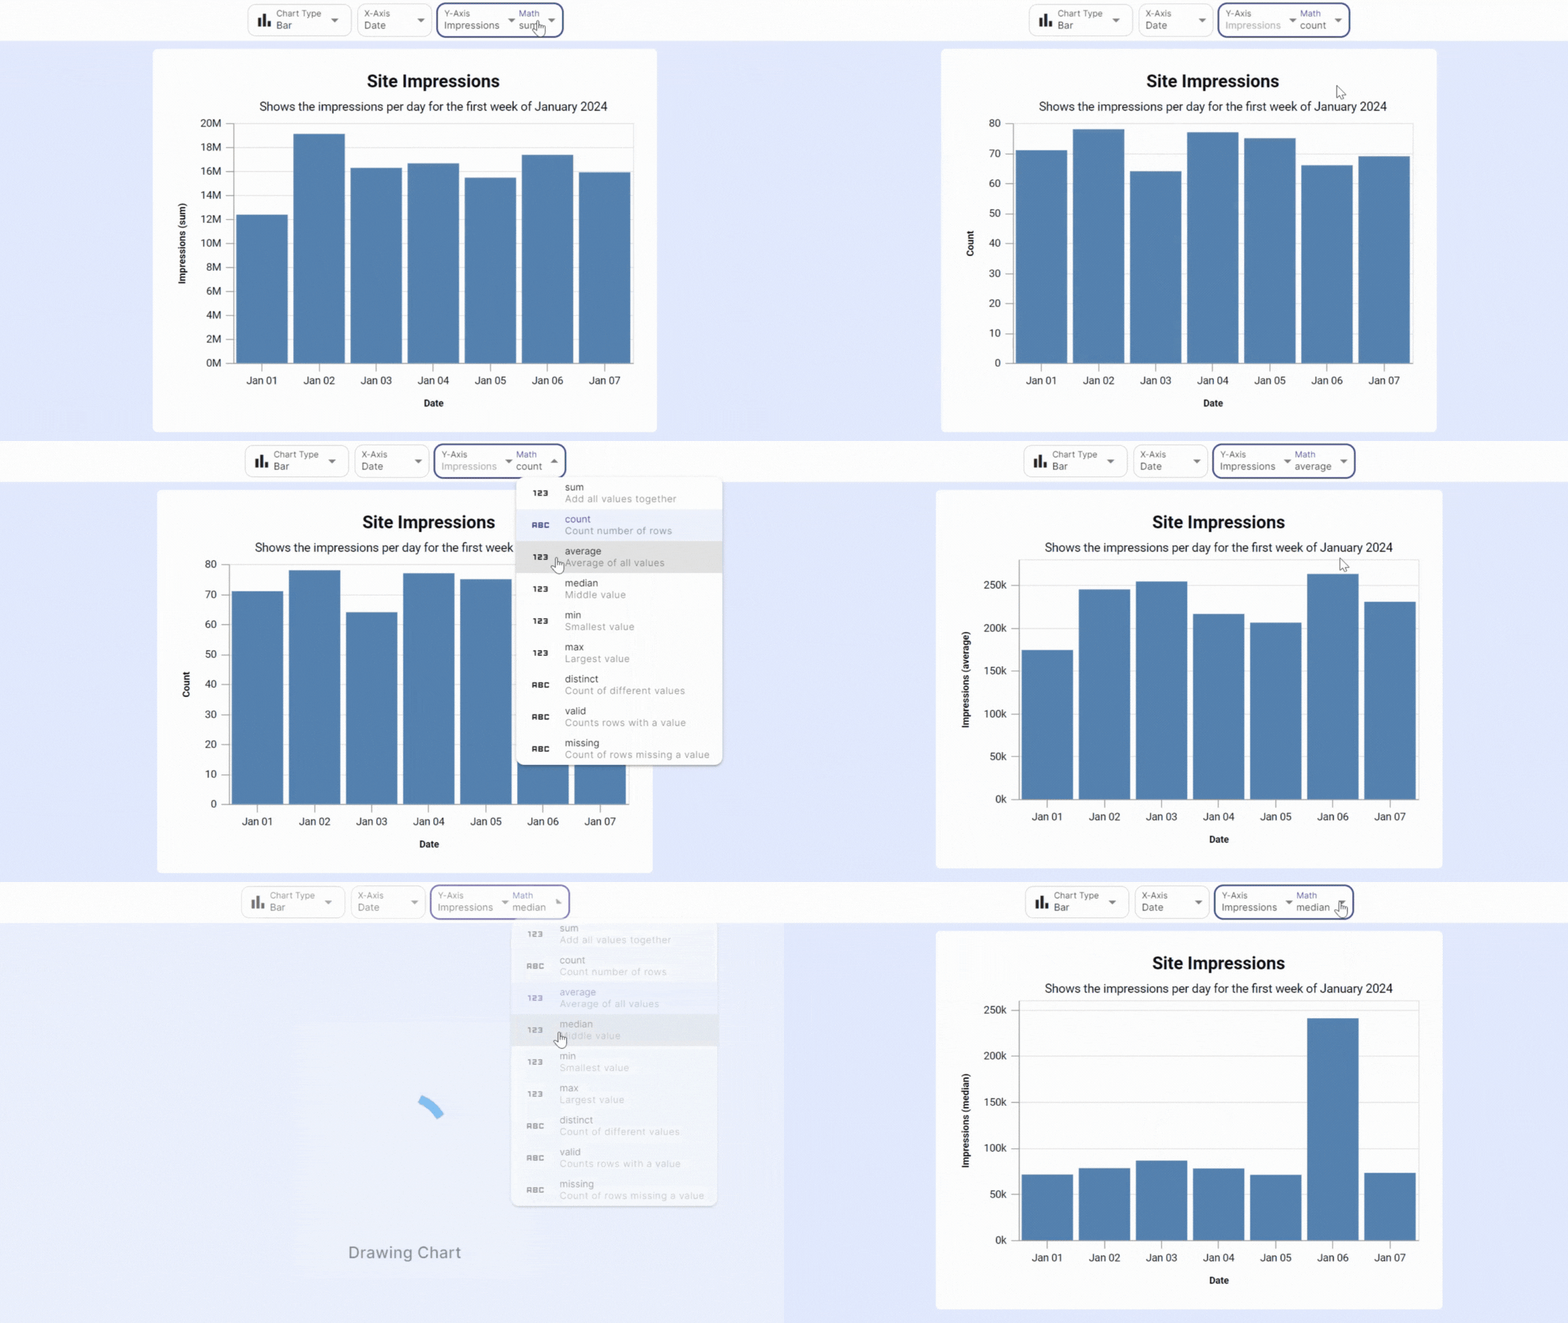
You can change the aggregation function applied through the Math dropdown, located within the Y-Axis/Series dropdown on the chart toolbar.

Aggregation performs calculations on a set of values and returns a single value. In the video above, the values on the y-axis are changing as the aggregation is changed.
Aggregation Functions
Below is a list of the aggregation functions you can apply to the Y Axis. In the UI, they appear next to the Y Axis under the Math dropdown.
Numerical Aggregation
These are mathematical functions applied to the numerical values within a column:
- Sum Add all values together
- Average Average of all values
- Median Middle value
- Min Smallest value
- Max Largest value
Non-Numerical (Text) Aggregation
These are the functions that can be applied to non-numerical values:
- Count Counts number of rows
- Distinct Count of different values
- Valid Counts rows with a value
- Missing Count of rows missing a value