
Transform Data
Data can be messy; sometimes it comes from a third party source and requires some clean up. Some datasets require a transformation before you can make effective charts from it.
InstaCharts offers four types of transformations to help with data clean up: Pivoting, Unpivoting, Merging Columns, and Splitting Columns.
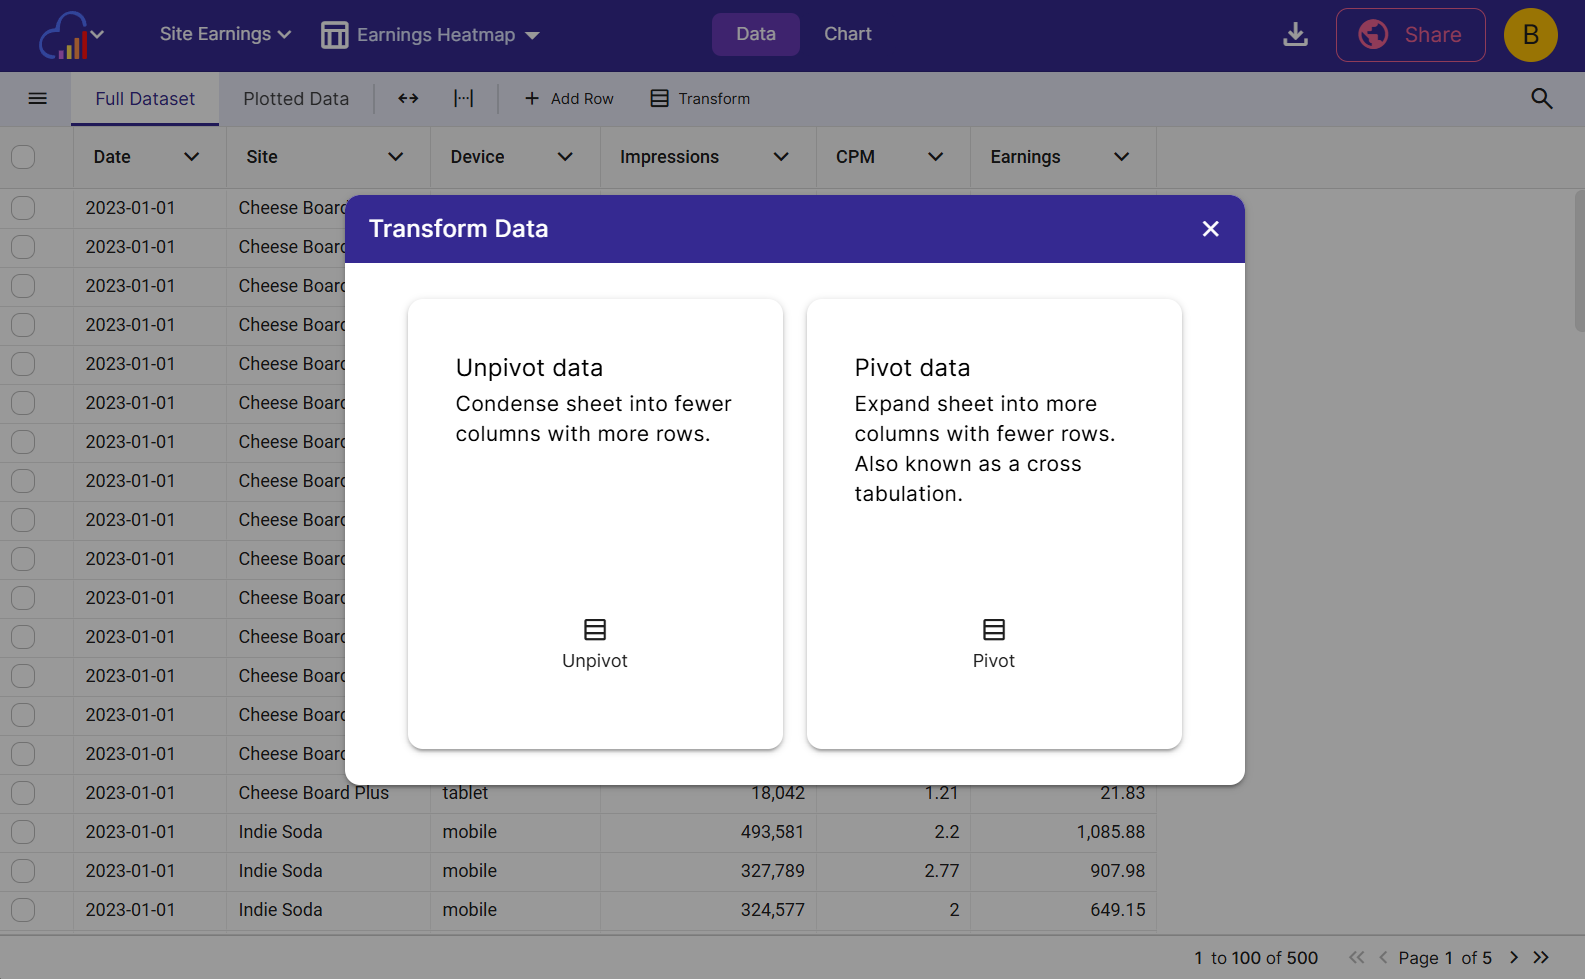
Pivot
Apply a pivot to your data when you’d like to explore a particular subvalue of a column further.
Pivots are sometimes know as a cross tabulation, and generally create a wider dataset (more columns, less rows).
Applying a pivot
On the data tab, make sure the Full Dataset view is selected. Click Transform on the sheet toolbar. On the newly opened Transform dialog, click Pivot.
On the next screen, there are several options to choose from.
- Include Columns (under Columns to keep) - These columns will be included in the output
- New Columns (under Columns to pivot on) - Unique values in each column selected will become its own column
- Value Columns - The values in these columns will become the values of the newly created pivoted columns
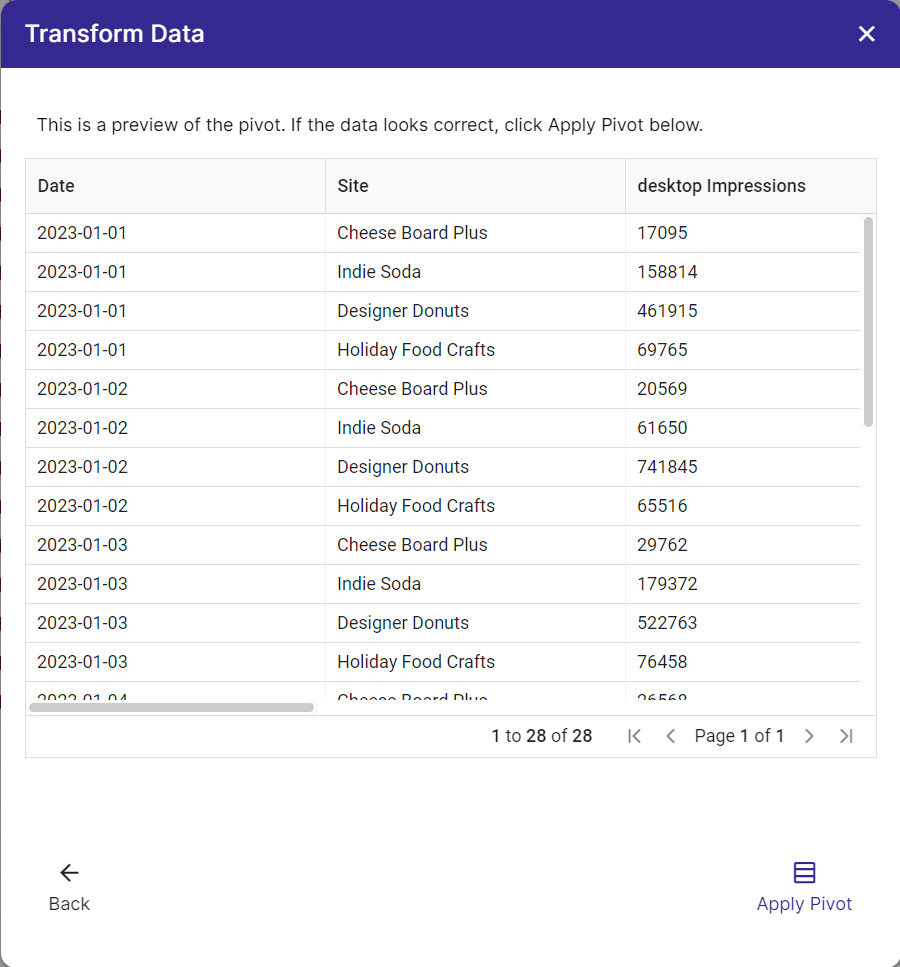
The preview updates live as you make selections. Once it looks good, click Apply Pivot to apply the transformation to your data.
Unpivot
Unpivoting is the opposite of pivoting. Use unpivoting to condense several columns back into just two columns: A category column and a value column.
Applying an upivot
On the data tab, click Transform on the sheet toolbar. On the newly opened Transform dialog, click Unpivot.
On the next screen, there are several options to choose from.
- Columns Select the columns to perform the unpivot on
- Item Column Name Enter a name for the new Item column
- Value Column Name Enter a name for the new Value column
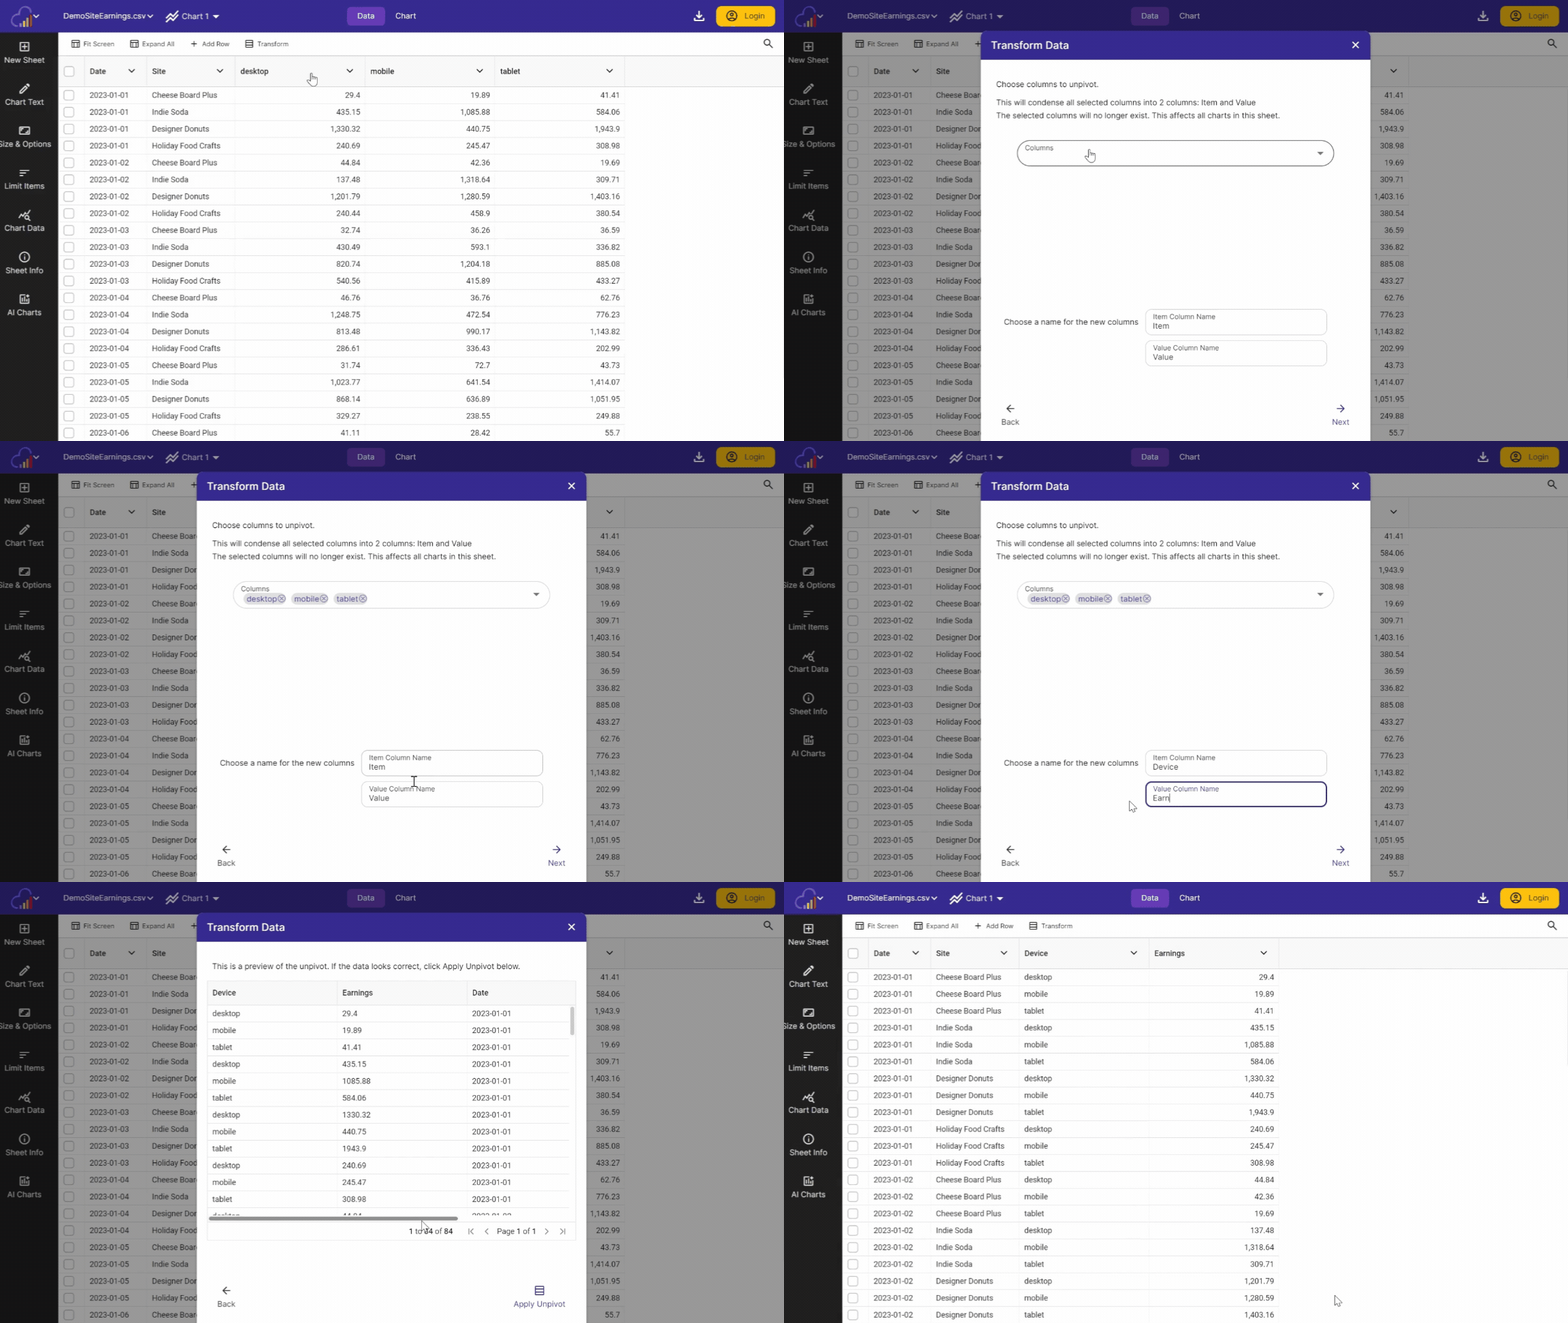
The preview updates live as you make selections. Once it looks good, click Apply Unpivot to apply the transformation to your data.
Merge Columns
Combine two or more columns into a single column. This is useful when related data is spread across several columns and charts would be easier to build with it in one place.
On the Transform dialog, click Merge Columns, then choose the columns to combine and how to join their values:
- Comma - joins the values with a comma. The merged column becomes a Multiple Choice column
- Space - joins the values with a space. The merged column becomes a Text column
Click Apply Merge to apply the transformation.
Split Columns
The opposite of merging: break one column apart into several columns using a delimiter.
On the Transform dialog, click Split Columns, then choose:
- Column - the column to split
- Delimiter - comma, space, semicolon, pipe, hyphen, tab, or a custom character
- Max columns (optional) - a limit on how many columns the split can create
- Names for each resulting column
Click Apply Split to apply the transformation.
Related
- Formatting Data for Import - lay out your data cleanly before you transform it
- Edit Data - work with your data on the Data tab
- Column Types - how columns are detected after a transform
- Filtering - filter rows instead of reshaping them
- Aggregation - summarize values in the chart