
Import File
Uploading a spreadsheet file to InstaCharts is the fastest way to turn raw data into a chart. Once uploaded, InstaCharts automatically detects column types, builds an initial chart, and makes your data ready to explore.
InstaCharts supports a wide range of spreadsheet file types:
| Format | Extension(s) |
|---|---|
| Comma-separated values | .csv |
| Pipe-separated values | .psv |
| Tab-separated values | .tsv |
| Delimiter-separated text | .dsv, .txt, .log |
| Microsoft Excel | .xls, .xlsx, .xlsm, .xlsb |
| OpenDocument Spreadsheet | .ods, .fods |
| Apple Numbers | .numbers |
| JSON | .json, .jsonl |
| Web and rich text tables | .html, .rtf |
| Legacy data formats | .dif, .dbf, .eth |
To sync a live spreadsheet that updates automatically, check out the Import from Google Sheets guide instead.
For a data file published at a public web address (ex: an open data portal export or a raw GitHub file), see Import and Sync from a Link. The sheet can sync from the link again later.
To push a newer version of a file into a sheet you already have, rather than creating another one, see Update Sheet Data.
New Sheet Dialog
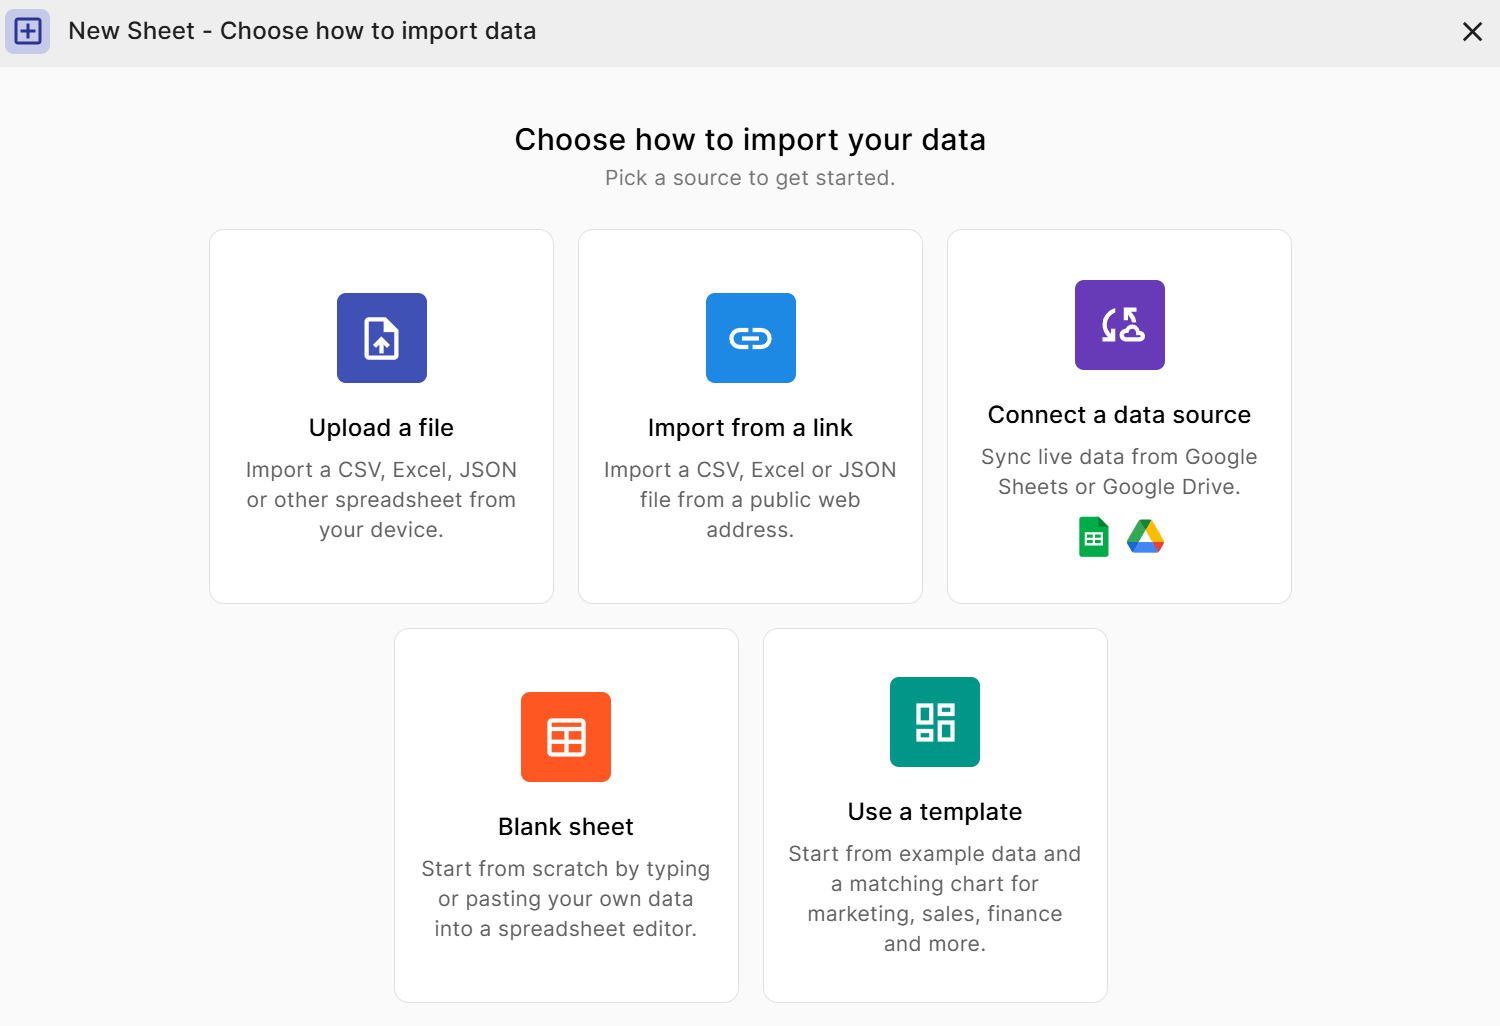
To import a new spreadsheet, from your workspace, click New -> New Sheet in the upper left corner.
The New Sheet dialog offers three ways to get data into InstaCharts:
- Upload a file imports a CSV, Excel, JSON, or other spreadsheet from your device.
- Connect a data source syncs live data from Google Sheets or Google Drive.
- Blank sheet starts from scratch by typing or pasting your own data into a spreadsheet editor.
To load a spreadsheet file click the left option, Upload a file.
Import Options
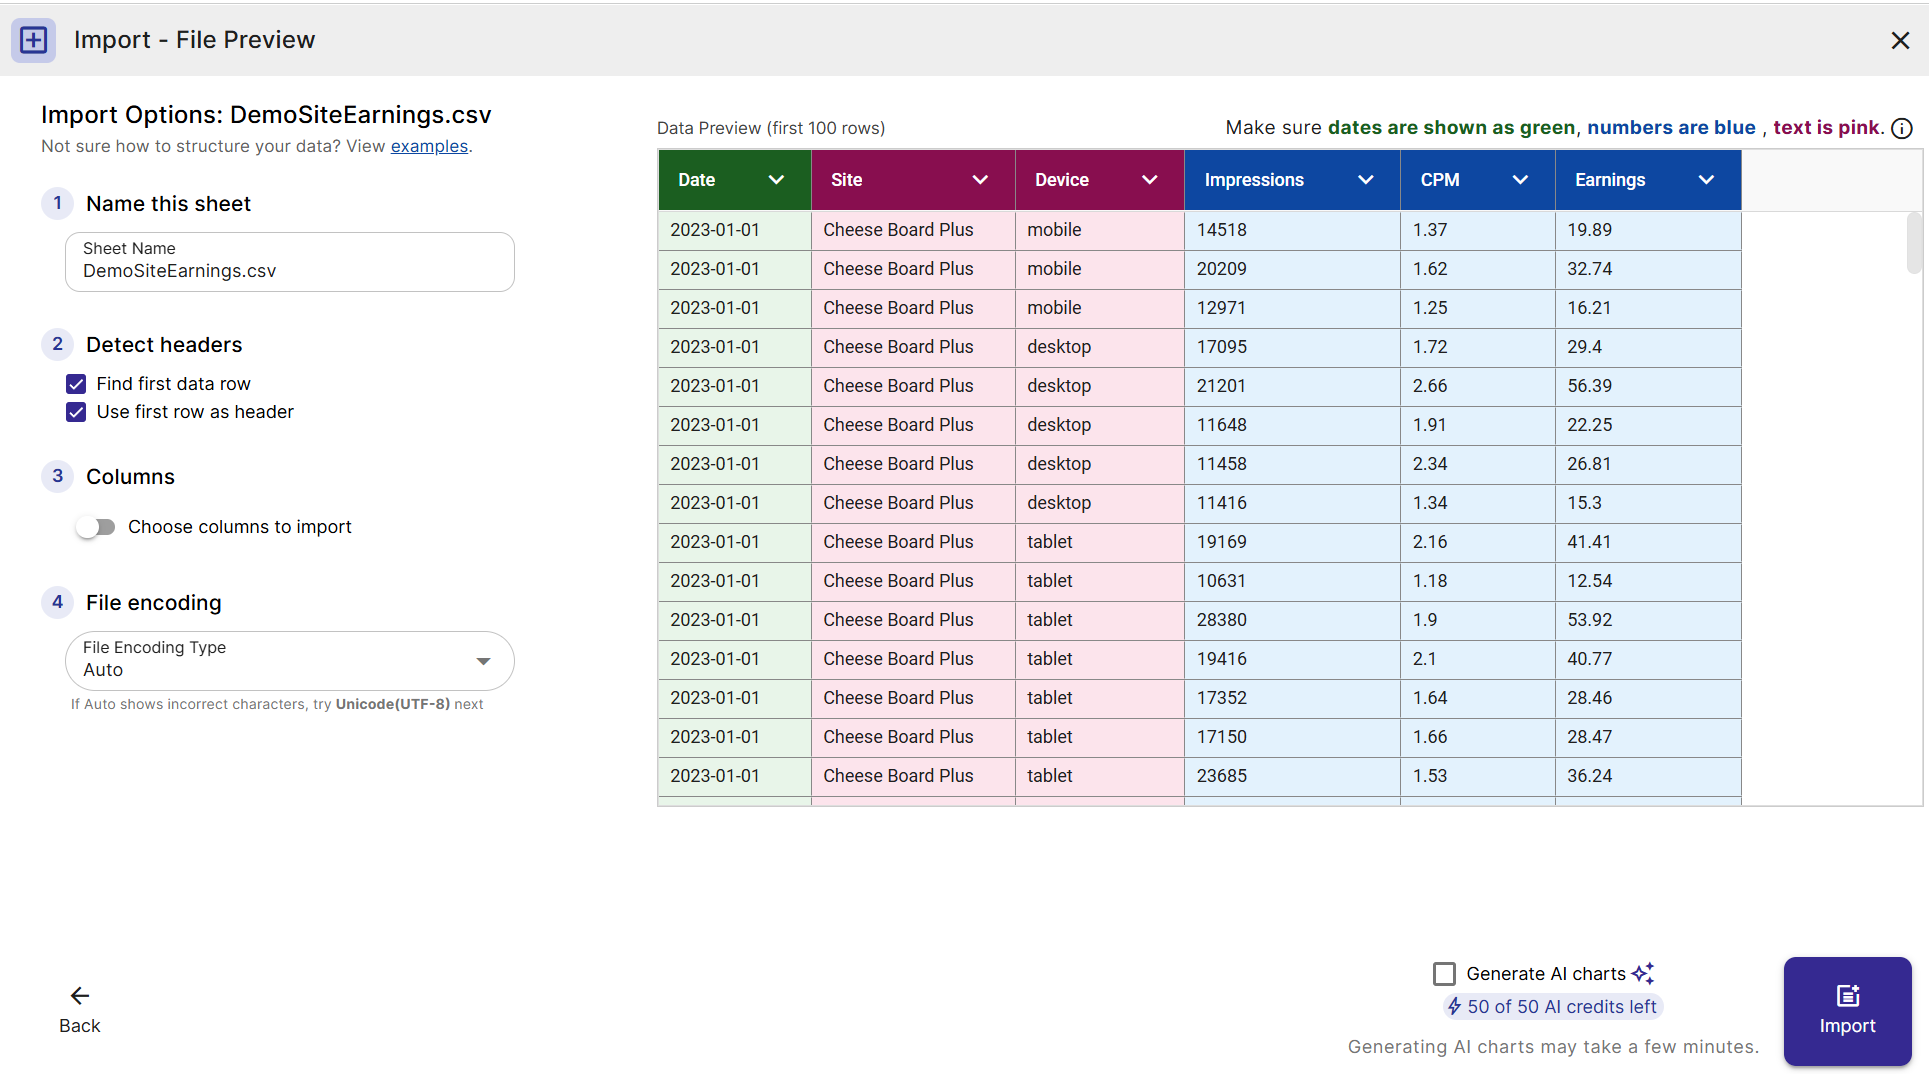
After you pick a file, InstaCharts parses it and opens the Import - File Preview window. The left side holds the import options, and the right side shows a live preview of the data those options produce. Changing an option reloads the preview, so you can see the result before you commit.
1. Name this sheet
The Sheet Name box is filled in from the file name. Type over it to give the new sheet a more descriptive name. The name you enter here is the name that appears in your workspace, so it is worth setting before you import.
For a workbook with several pages, this box is labeled Base Name instead, and the name is used for every sheet the import creates.
2. Detect headers
Two checkboxes control how InstaCharts finds the header row and the start of your data. Both are turned on by default.
Find first data row looks through the first few rows to find a row that contains numbers or dates. Blank and incomplete rows at the top of the sheet are removed. Turn this on when your spreadsheet has a title, a note, or a few empty rows above the actual table, because that extra text can stop a column from being detected as a number or a date.
Use first row as header treats the first row of the sheet as the column names. Uncheck it when your spreadsheet has no header row, and the columns are given generic names such as A, B, and C instead.
3. Columns
By default every column in the file is imported. Turn on Choose columns to import to pick a subset, then use the Columns dropdown to toggle individual columns on and off. The dropdown also has Select All and Deselect All buttons for working with wide spreadsheets.
Columns you leave out are hidden in the preview and are not imported into the sheet.
4. File encoding
Some kinds of files (like .csv, .psv, .tsv) don’t contain their file encoding types, which help provide the correct character set for the file.
Use the File Encoding Type dropdown to change your spreadsheet’s encoding if the character set doesn’t look correct in the preview.
Data Preview
The preview grid shows the first 100 rows of the file so you can confirm the data was read the way you expect before importing.
Column headers are color coded by the type InstaCharts detected:
- Green columns are dates, which can be split apart into parts like month and year when charting.
- Blue columns are numbers, which can be plotted on a value axis and aggregated.
- Pink columns are text, which become the labels and groups in your charts.
If a column you expect to be a number or a date is showing as pink text, a stray value is usually the cause. Edit the spreadsheet to remove the extra text from the column, then import again. See Formatting Data for Import for the rules InstaCharts uses to detect each type.
Row and column limits
If the file is larger than your plan allows, a warning appears under the preview telling you how many of the file’s rows and columns can be imported, along with an Upgrade Plan link. The rest of the file is not imported, so trim the source file or raise your limits before importing if you need the full data set.
Workbooks with Multiple Pages
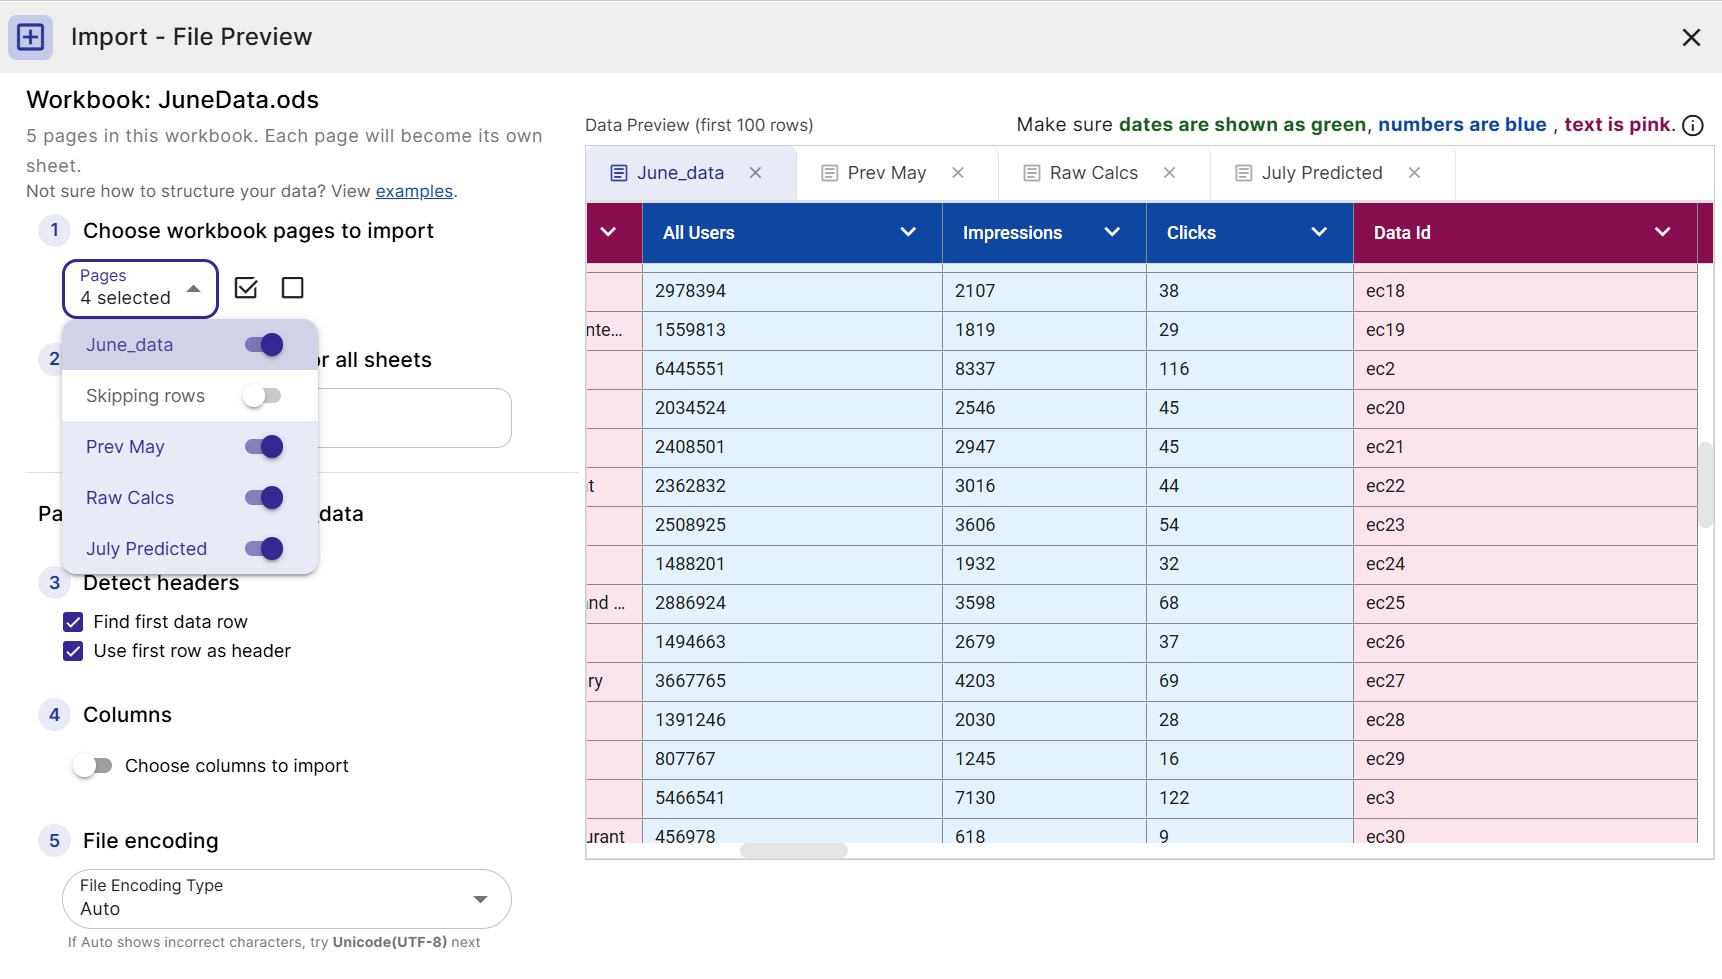
Excel and OpenDocument workbooks often hold several pages. When InstaCharts finds more than one page in a file, the import options open with a Workbook heading that names the file and lists how many pages it contains. Each page becomes its own sheet in InstaCharts.
- In the Pages dropdown, choose which workbook pages to import. Every page is selected by default, and Select All and Deselect All are available for large workbooks.
- Enter a Base Name. It is used to name the sheets created from the pages you selected.
- Click a page tab above the preview to review that page, then set its Detect headers and Columns options. These options are stored per page, so each page can be imported differently.
- Click the X on a tab to drop that page from the import, or clear the whole selection from the Pages dropdown.
Generate AI Charts on Import
Next to the Import button is a Generate AI charts checkbox. Leave it checked and InstaCharts analyzes the sheet as soon as it finishes uploading and creates three recommended charts for you, then opens the first one.
Generating charts this way uses 1 AI credit, and the chip under the checkbox shows how many credits your workspace has left for the month. Generation can take a few minutes, and you can click Open sheet on the progress window to start working while the charts finish in the background.
See AI Chart Recommendations for generating recommendations later from inside a sheet.
Imported Spreadsheet
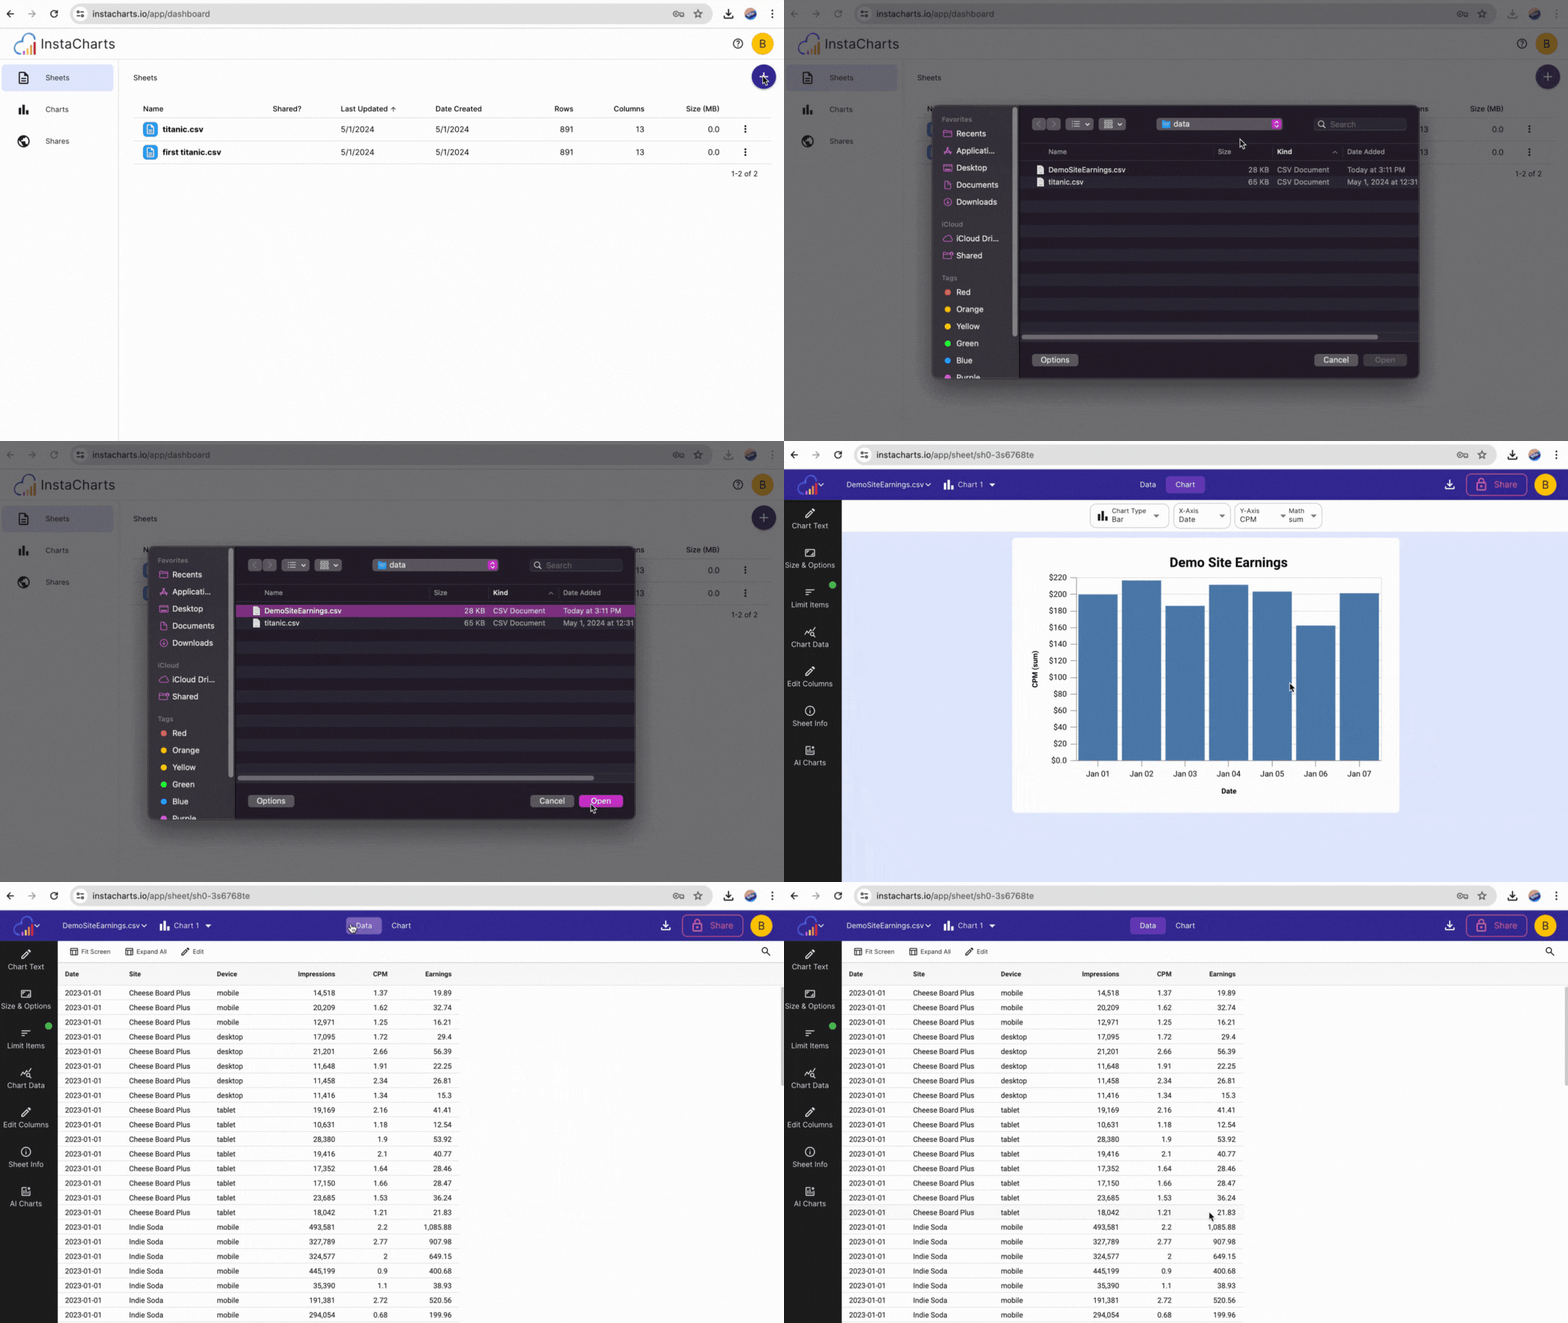
Once your sheet has been imported, it will automatically open to a chart created with your data.
Check Formatting
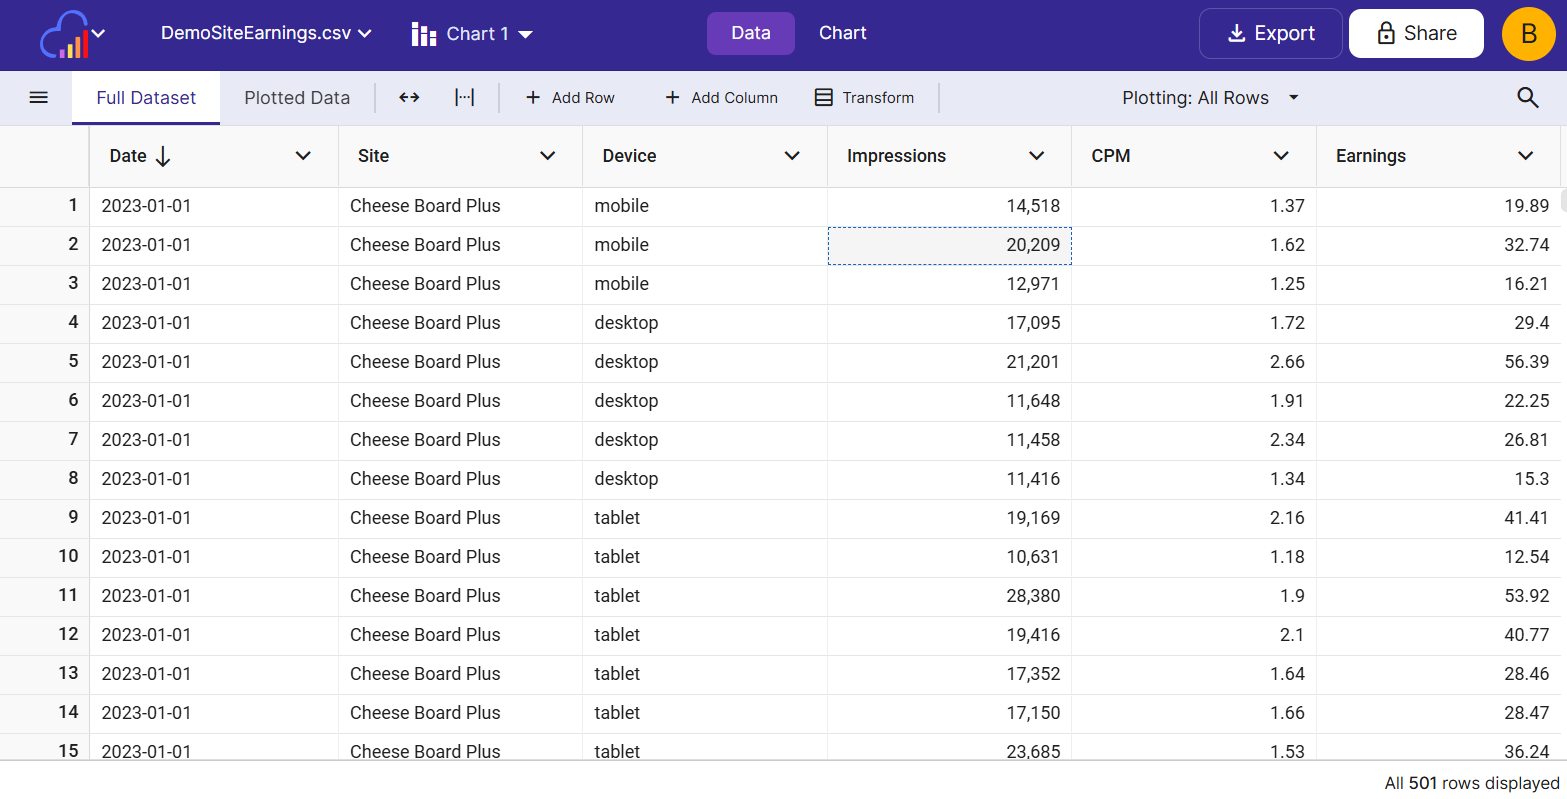
Click the Data tab to view your processed spreadsheet data. Column types are autodetected based on the data each contains. Column names are pulled from the header row of the spreadsheet.
To edit column names, click Edit Column from each column’s header menu on the data tab.
Next Steps
Got a newer version of the file later on? Update the sheet with it instead of importing again, and the charts you built keep working.
Need to do some light editing of the data? View how to edit individual data cells or replace all values within a column.
There are also several Data Transformations available in InstaCharts to reshape your data.
Add a trend line to your chart.
Export your chart as an image file.