Share Charts
InstaCharts makes it easy to share your charts and data with anyone - no InstaCharts account required. Sharing works through a URL link you can send via email, Slack, or any messaging tool. You can also embed charts directly into websites, dashboards, and web apps.
Charts can be shared as interactive charts (where viewers can hover, explore data, and switch views) or as static images. You can share publicly with anyone who has the link, or privately with specific users.
To share a chart, first make sure you are logged into your InstaCharts account. If you don’t have an account, sign up here.
Share & Templates Dialog
To open the Share & Templates dialog, click the Share button on the main toolbar. The Share dialog is also accessible through the File Menu.
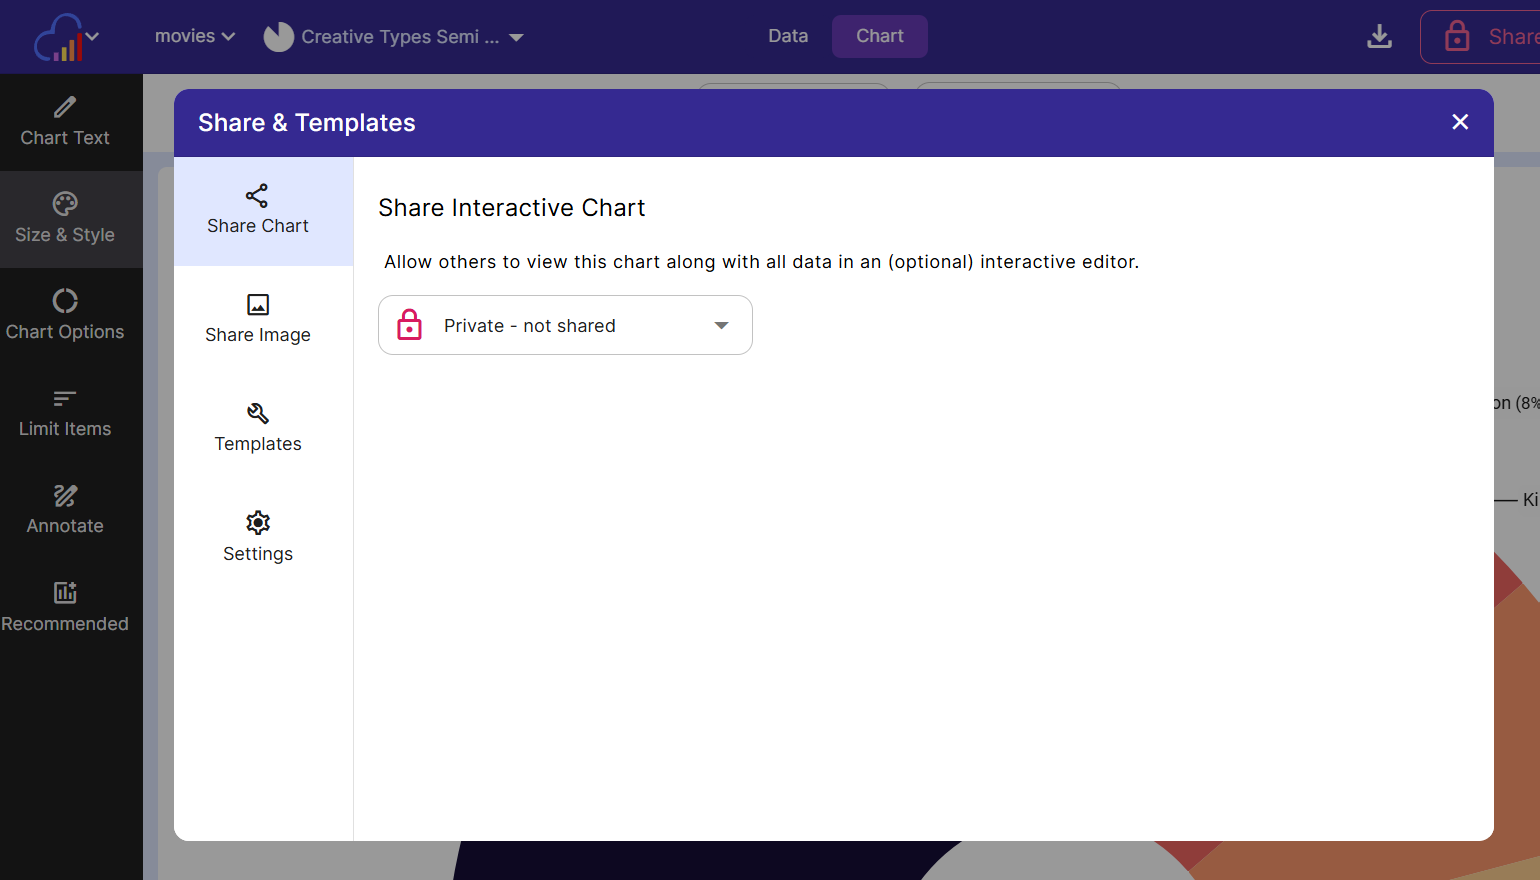
Share Interactive Chart
On the left side menu of the Share dialog, make sure Share Chart is selected.
Share Mode
There are three share modes accessed via the share type dropdown:
- Private: Only you can access
- Share with specific users: Only shared with users you specify (for paid users only)
- Public: Anyone with link can access
Share Publicly
To share your chart, change the share mode to Public. Anyone with the url will be able to view your interactive chart (no account needed).
If you no longer wish to share this chart, set it to private.
To share a chart with someone, copy the Interactive Chart URL and send it to them.
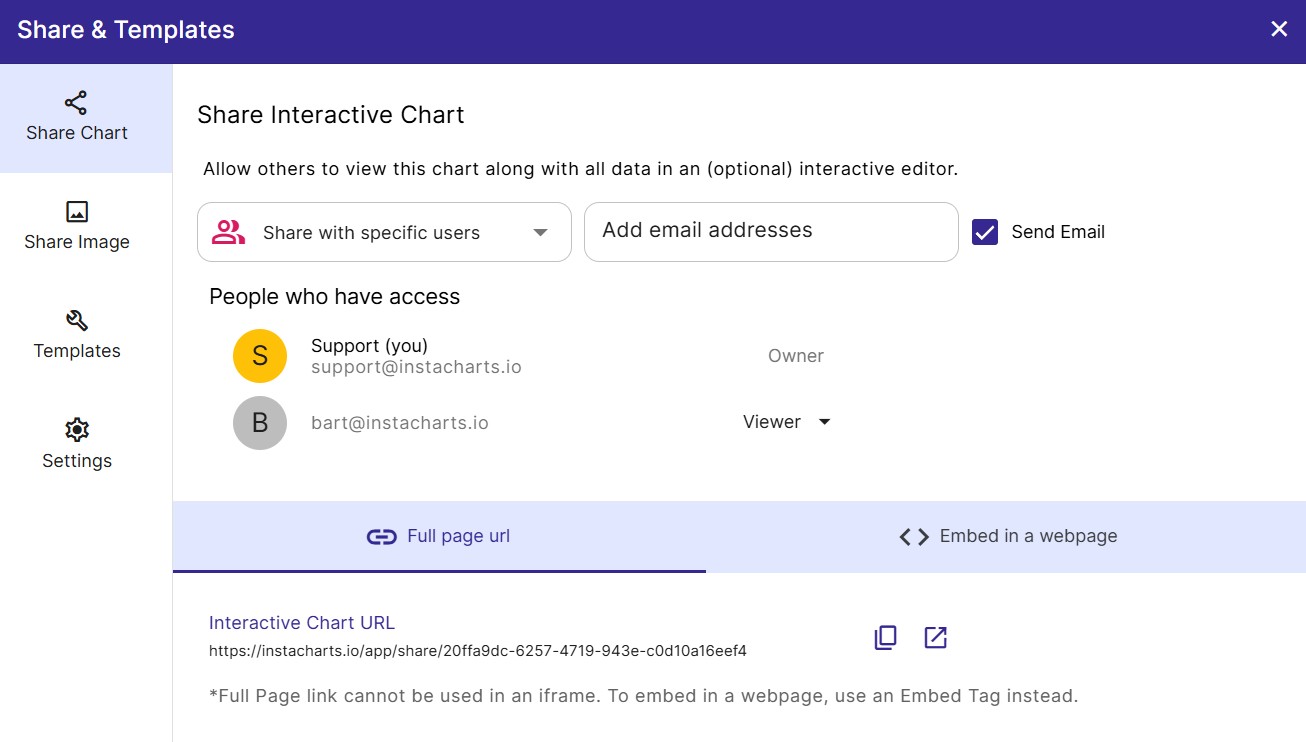
Share Privately 🔒 (paid feature)
To share your chart with specific users, change the share mode to “Share with specific users”.
- To grant another user access, decide if you want to send them an email notification with a link to the share. If not, unclick Send Email.
- Type in their email address into the Add email addresses box. When you are done, press enter.
- Permission has been granted, and the user will appear under People who have access. To remove their access, click Viewer, then Remove Access.
Share Settings
If the chart is currently shared, options appear under the Settings tab that allow you to customize the share.
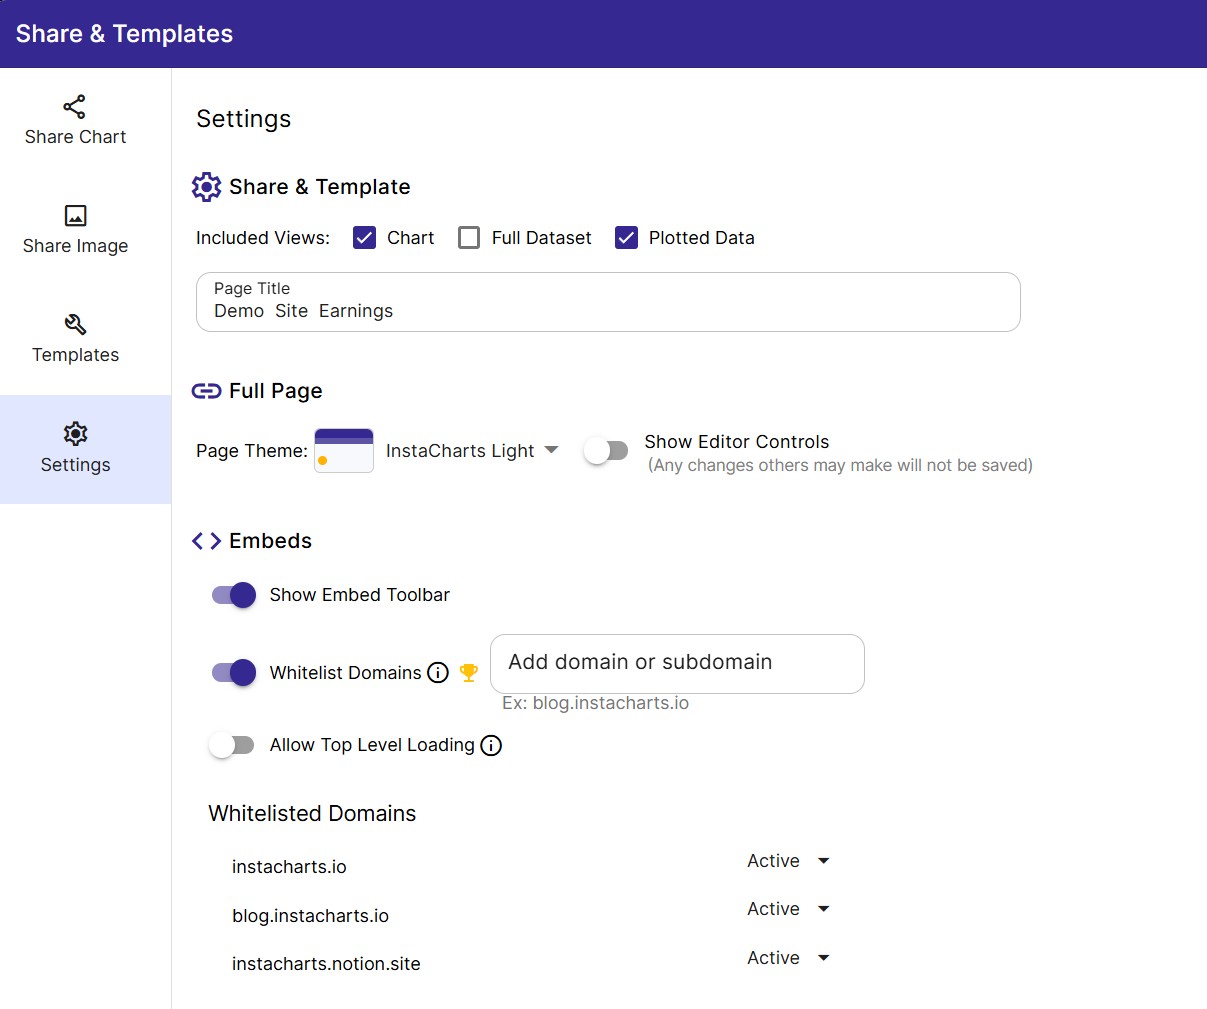
Included Views
Each shared chart can have up to 3 different views enabled. Use the checkboxes to select which views should be included in the share.
Views:
- Chart : Show the chart
- Full Dataset : Show the full dataset as a data table.
- Plotted Data : Show the data plotted in the chart as a data table.
If more than 2 views are selected, a dropdown will appear in the share that allows you to switch views.
Page Title
Optionally change the page title of the shared chart
Page Theme
Change the page theme of full page interactive charts. There are currently 12 themes to choose from.
Themes do not apply to embeds, full page interactive charts only.
Show Embed Toolbar
This controls whether the bottom toolbar is shown on embedded charts and data tables. The embed toolbar contains:
- A dropdown to switch between views
- An Export button to export the chart image or download data
- A View Larger button to open the embedded chart into a new tab
Show Editor Controls
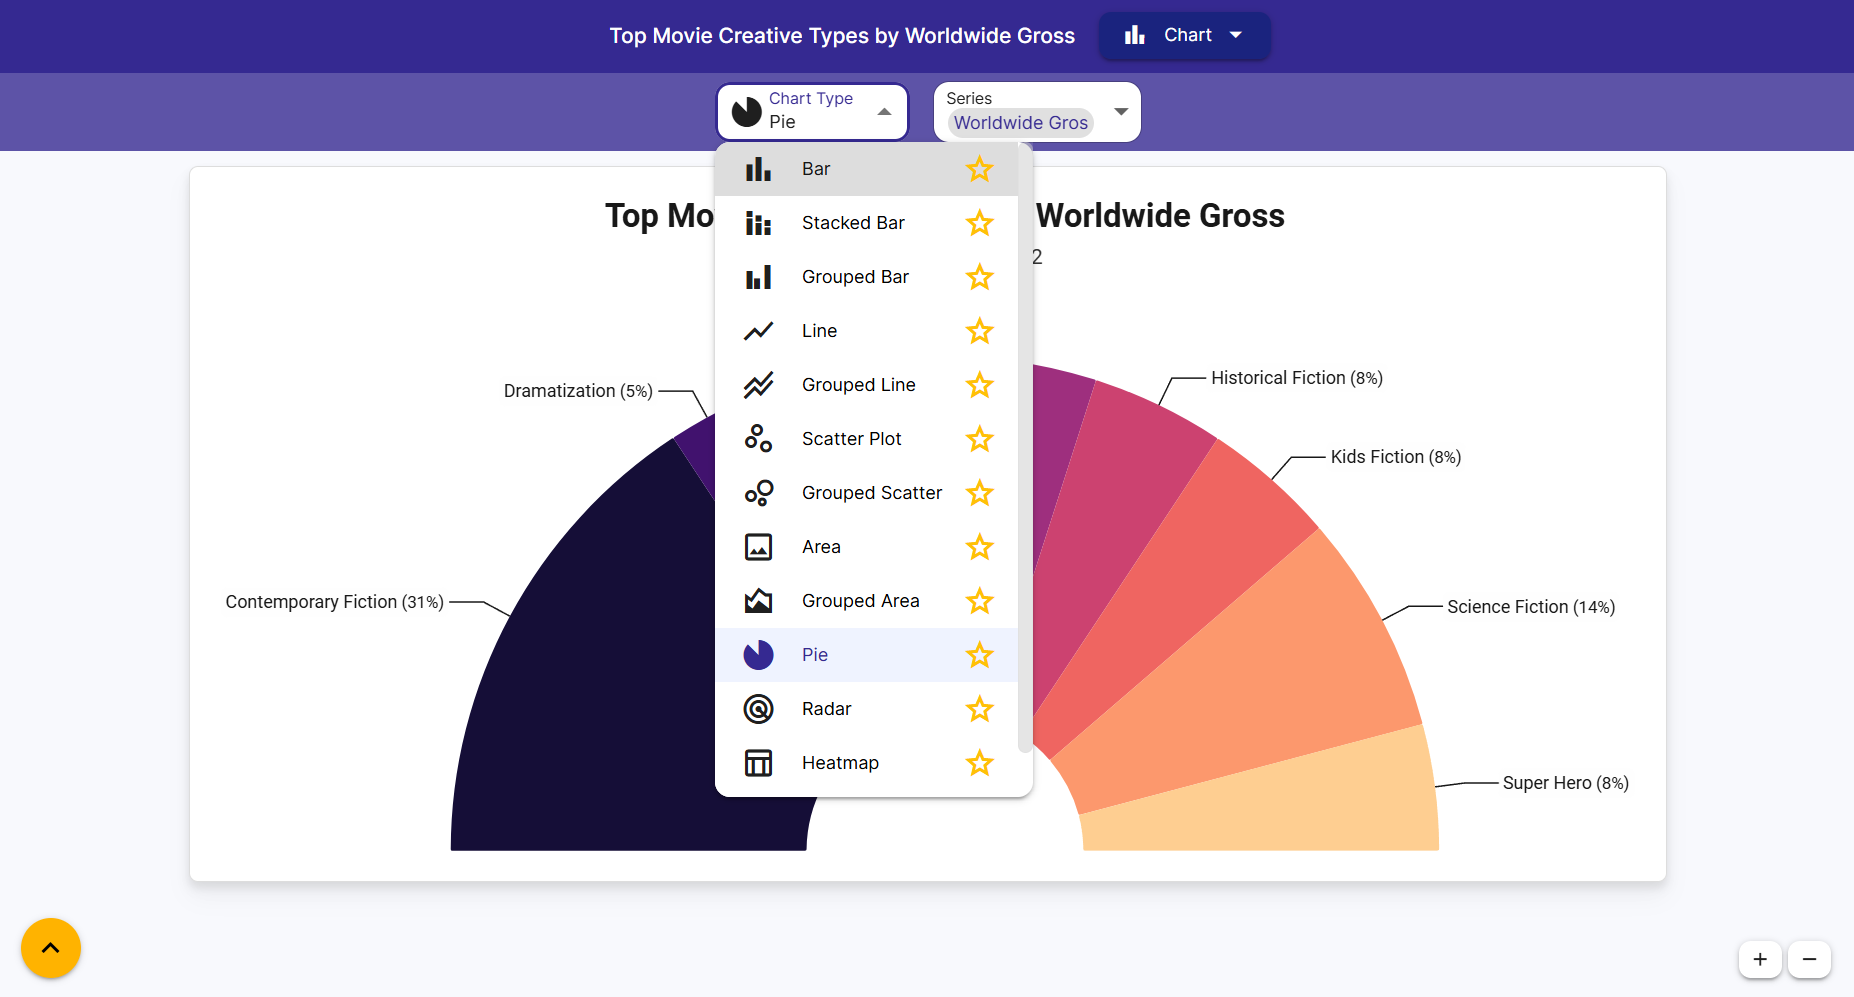
Sometimes a dataset is best represented by multiple charts instead of just one. Enable the editor controls to allow a viewer to change chart axis, chart type and many other chart settings to change the chart that is displayed.
Whitelist Domains 🔒 (Paid Feature)
Domain Whitelisting is a security feature that prevents your charts from being embedded and displayed on unauthorized websites. By default, charts are embeddable anywhere. To enable this restriction, you must specify the exact subdomains allowed to display the chart content.
You must enter the full domain or subdomain where the chart will be embedded. Wildcards are not supported.
| Domain Type | Input Example | Chart Display Location |
|---|---|---|
| Main Domain | example.com | https://example.com/page |
| Standard Subdomain | blog.example.com | https://blog.example.com/post |
| Specific Path (Not supported) | example.com/page | The system ignores paths and only uses the domain. |
Example: If you only add reports.clientportal.com to the whitelist, the chart will not load on www.clientportal.com or any other site.
- Allow Top Level Loading Turn this toggle off to prevent any charts from loading outside the whitelisted domains. This prevents loading via top level navigation (Typing the chart resource url directly into the browser address bar)
Embed in a webpage
Charts, datatables and images can also be embedded into webpages. There are two ways to embed an item into a webpage:
- Embed Url Copy this url and paste it into services that take an embed url, like Notion.
- Embed Tag Copy this html iframe tag and paste directly into an html webpage or a service that accepts html tags.
Embed in a Website Builder
Below is how to integrate with different website builders as of Jan 2026:
- Bubble Drag an HTML Element onto your page, then paste in the Embed Tag under Appearance.
- Webflow Add a Code Embed Element to your page, then paste in the Embed Tag.
- WordPress Use the Embed Tag and paste it into a Custom HTML block
- Ghost Add a raw HTML card and paste in the Embed Tag
- Notion Add an Embed Block, and paste in the Embed URL
- Medium Medium doesn’t support many third party services by design. Download your chart image to svg or png, and upload the image to your Medium article.
- Substack Substack also doesn’t support many third party services by design. Download your chart image to svg or png, and upload the image to your Substack article.
- Wix Add an HTML Embed Element. Choose Website address and paste in the Embed URL or choose Code and paste in the Embed Tag.
- Squarespace Add an Embed Block. Embed as a Code Snippet, then paste in the Embed Tag.
- Shopify Add a Custom Liquid Section. Paste the Embed Tag into the Liquid code text area.
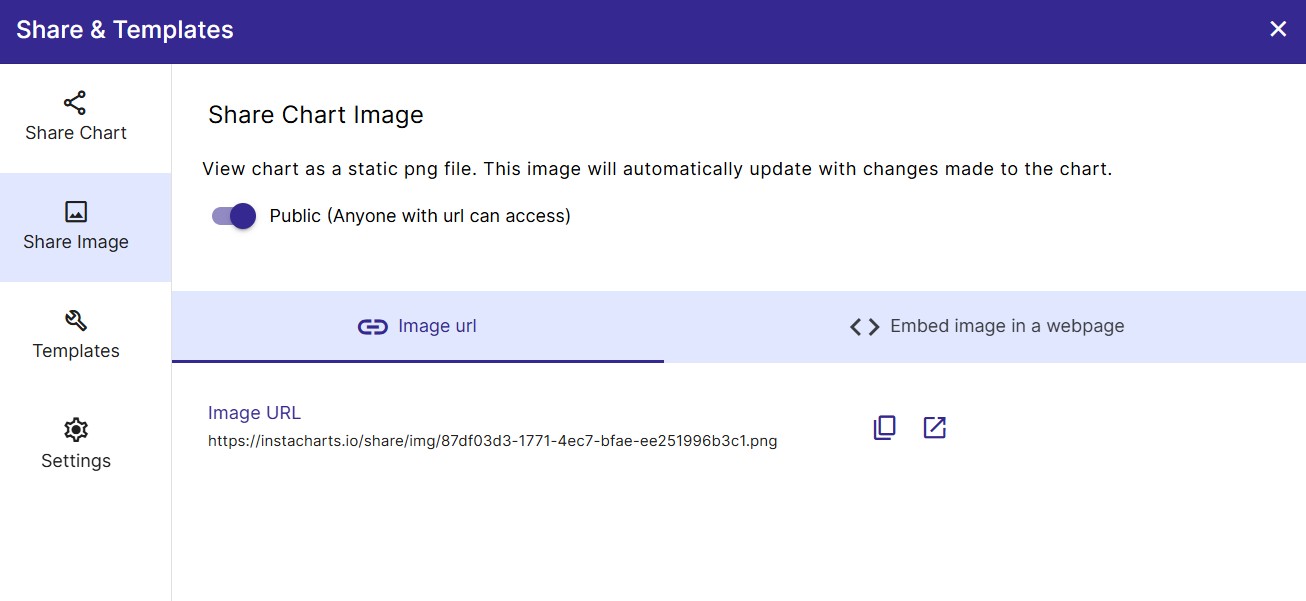
Share Chart Image
You can also share static chart images with others. These images will automatically update with any changes made to the underlying chart.
Much like shared interactive charts above, shared images can either be shared via a url link or embedded into a website.
Currently shared images are only available in .png format.
Templates
The last tab of the Share & Templates window allows you to create templates to simplify the chart generation through an API process.
Frequently Asked Questions
Do viewers need an InstaCharts account to see a shared chart? No. Anyone with the link can view a publicly shared chart or embedded chart without an account.
Can viewers edit my chart or change my data? Viewers can change chart display options (axis, chart type, colors) to explore the data, but their changes are not saved and do not affect the original chart.
What is the difference between sharing a link and embedding? Sharing a link sends the viewer to a standalone InstaCharts page. Embedding displays the chart inside your own webpage using an iframe, so the chart appears as part of your site.
What is the difference between an interactive chart and a shared image? An interactive chart lets viewers hover over data points, switch views, and explore the data. A shared image is a static PNG that automatically updates when the underlying chart changes, but has no interactive controls.
Can I stop sharing a chart at any time? Yes. Set the share mode back to Private at any time, and the link will stop working immediately.
Why is my embedded chart not showing on my website? If you have Domain Whitelisting enabled, make sure your site’s domain is listed exactly as it appears. If whitelisting is not configured, the chart should embed on any site.