Chart Management
Sometimes a dataset is better modeled by multiple different charts. Additional charts can be added to a Sheet in order to accommodate this. Not only does each chart save its own set of options, but contains its own filters on the data. Different charts can filter the underlying dataset in different ways without affecting the other charts.
Charts can be added to a sheet via the sheet menu (looks like the spreadsheet filename).
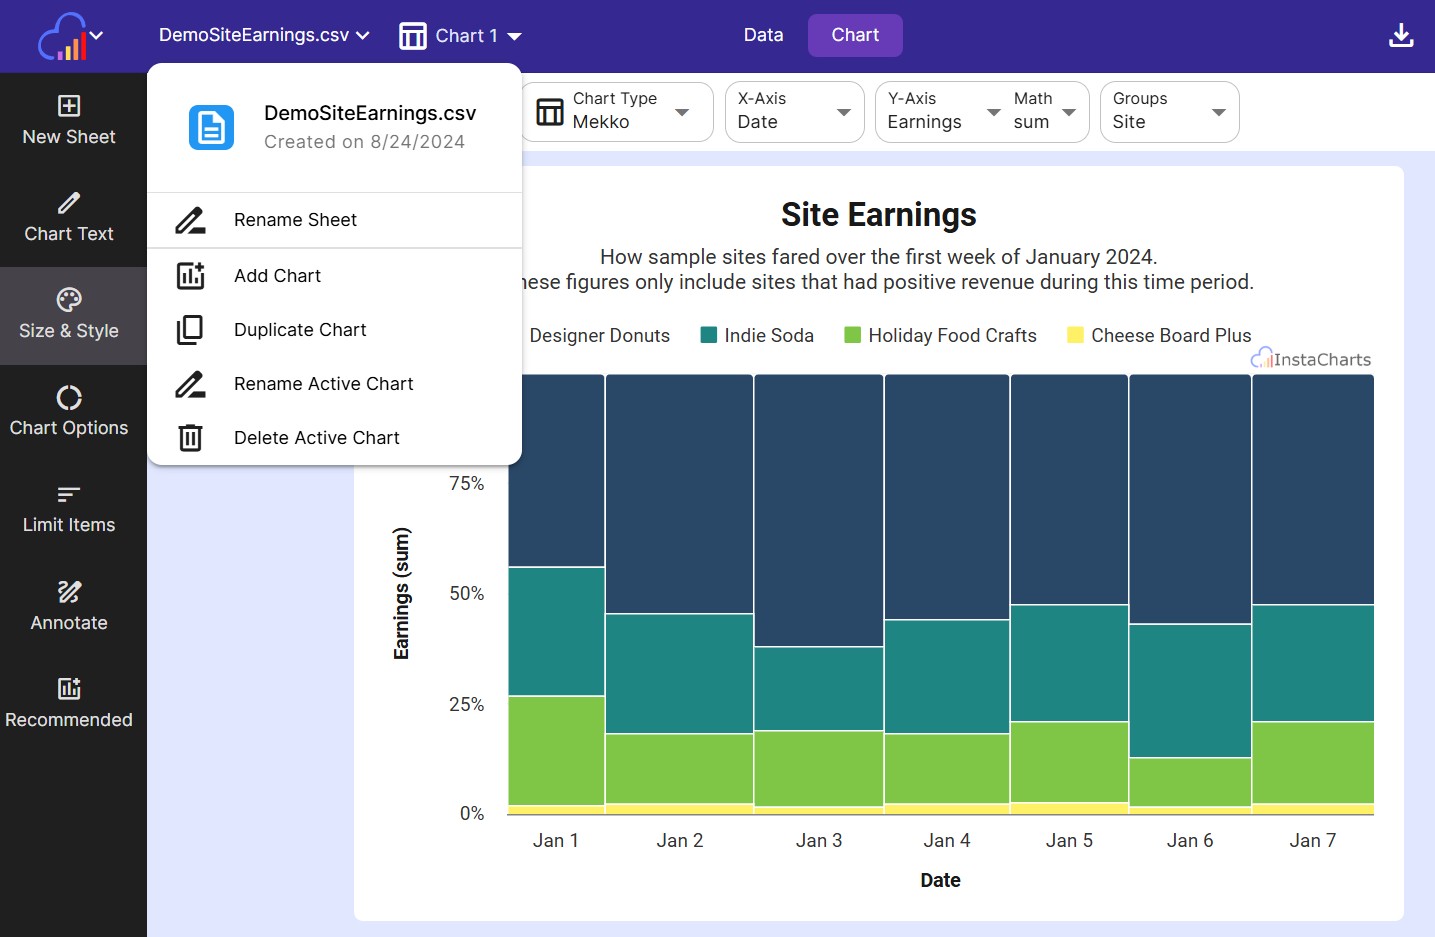
Add Chart
Add a new chart to your sheet through the Add Chart menu option in the sheet menu.
Duplicate Chart
To copy the current chart as a new chart, click the Duplicate Chart menu option in the sheet menu.
Rename Chart
Rename the currently selected chart through the Rename Active Chart menu option in the sheet menu.
If a sheet contains many charts, renaming each chart is helpful for keeping track of them.
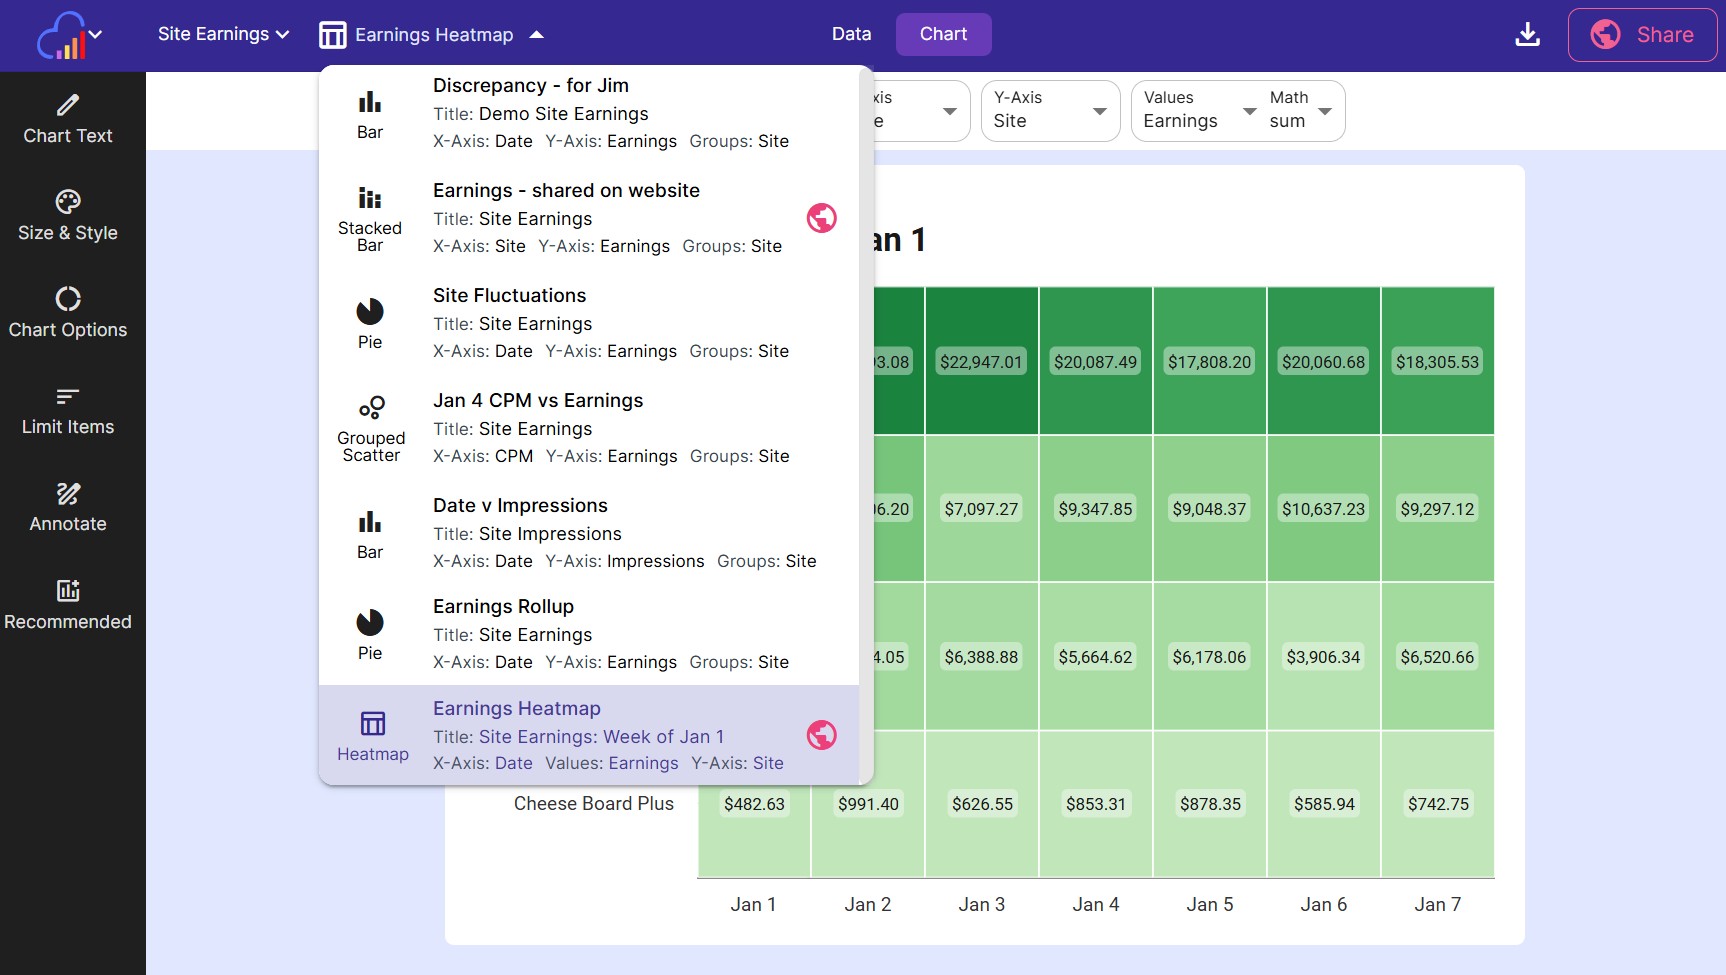
Select Active Chart
Use the chart select dropdown to choose the active chart shown in the sheet. Selecting a different chart will change both the Chart view and the Plotted Data view under Data.
The chart select dropdown is located in the main toolbar, to the right of the sheet menu dropdown.
Delete Chart
Delete the active chart through the Delete Active Chart option in the sheet menu.