Chart Text
Use the Chart Text panel to edit a chart’s title, subtitle, labels and legend. This panel contains many options to change the text within the chart.
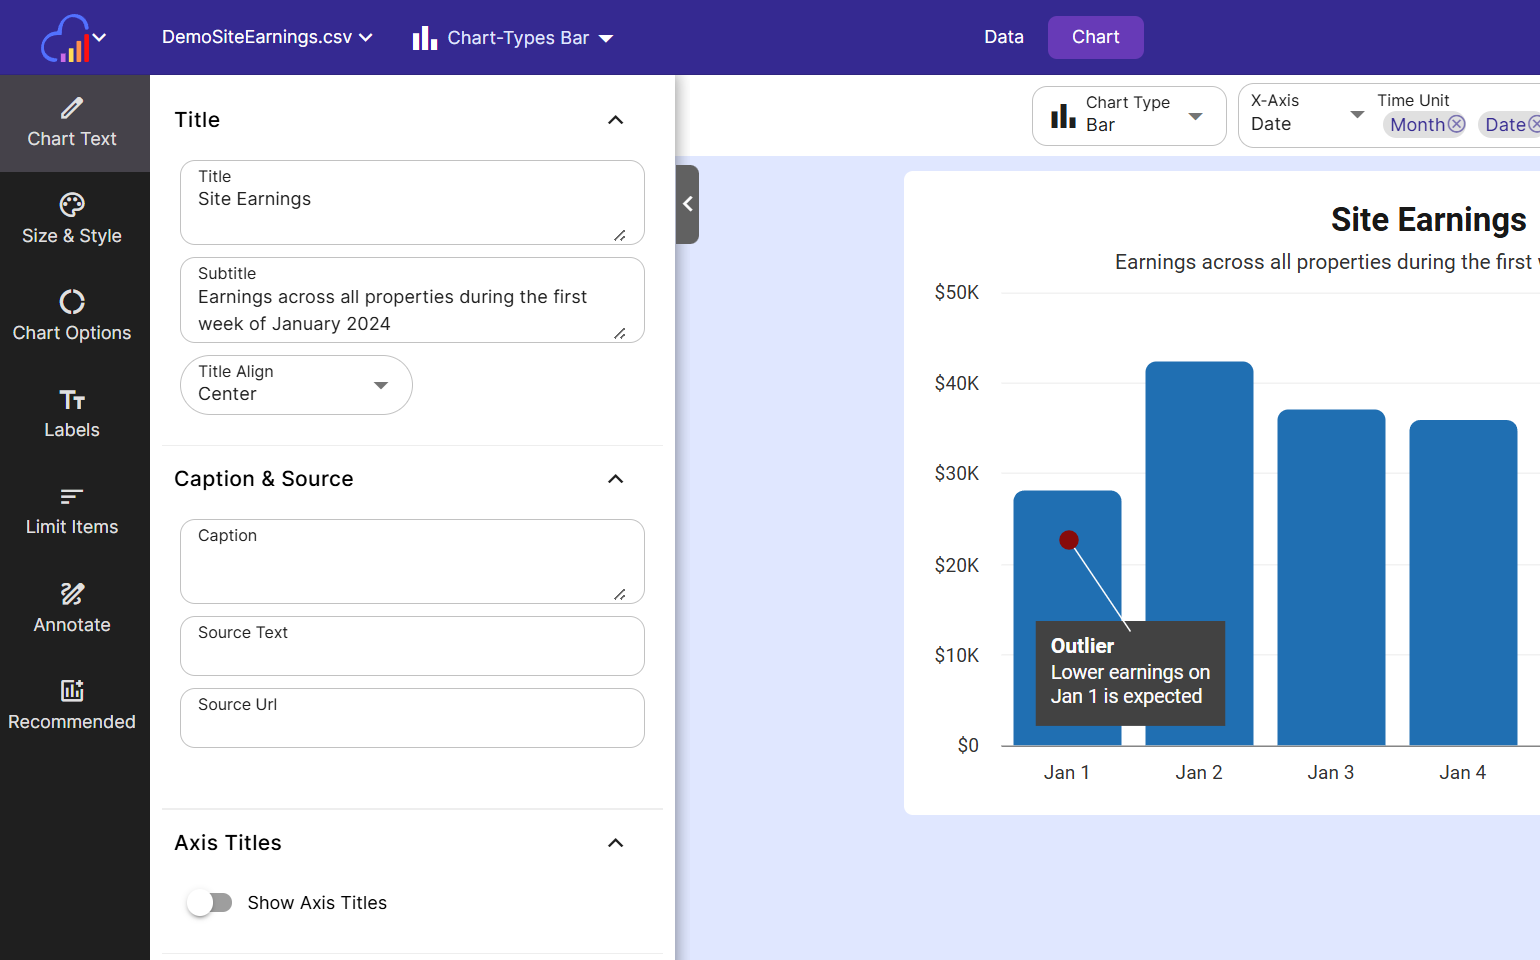
Titles
- Title Edit the chart’s title. Titles can have multiple lines; insert a line break using the enter key.
- Subtitle Add an optional subtitle to the chart. Like titles, subtitles can have multiple lines; insert a line break using the enter key.
- Title Align The title and subtitle are center aligned by default. Change this setting to ‘Left’ to left align the titles.
Caption & Sources
Use Caption and Sources to add text to the bottom left corner of the chart.
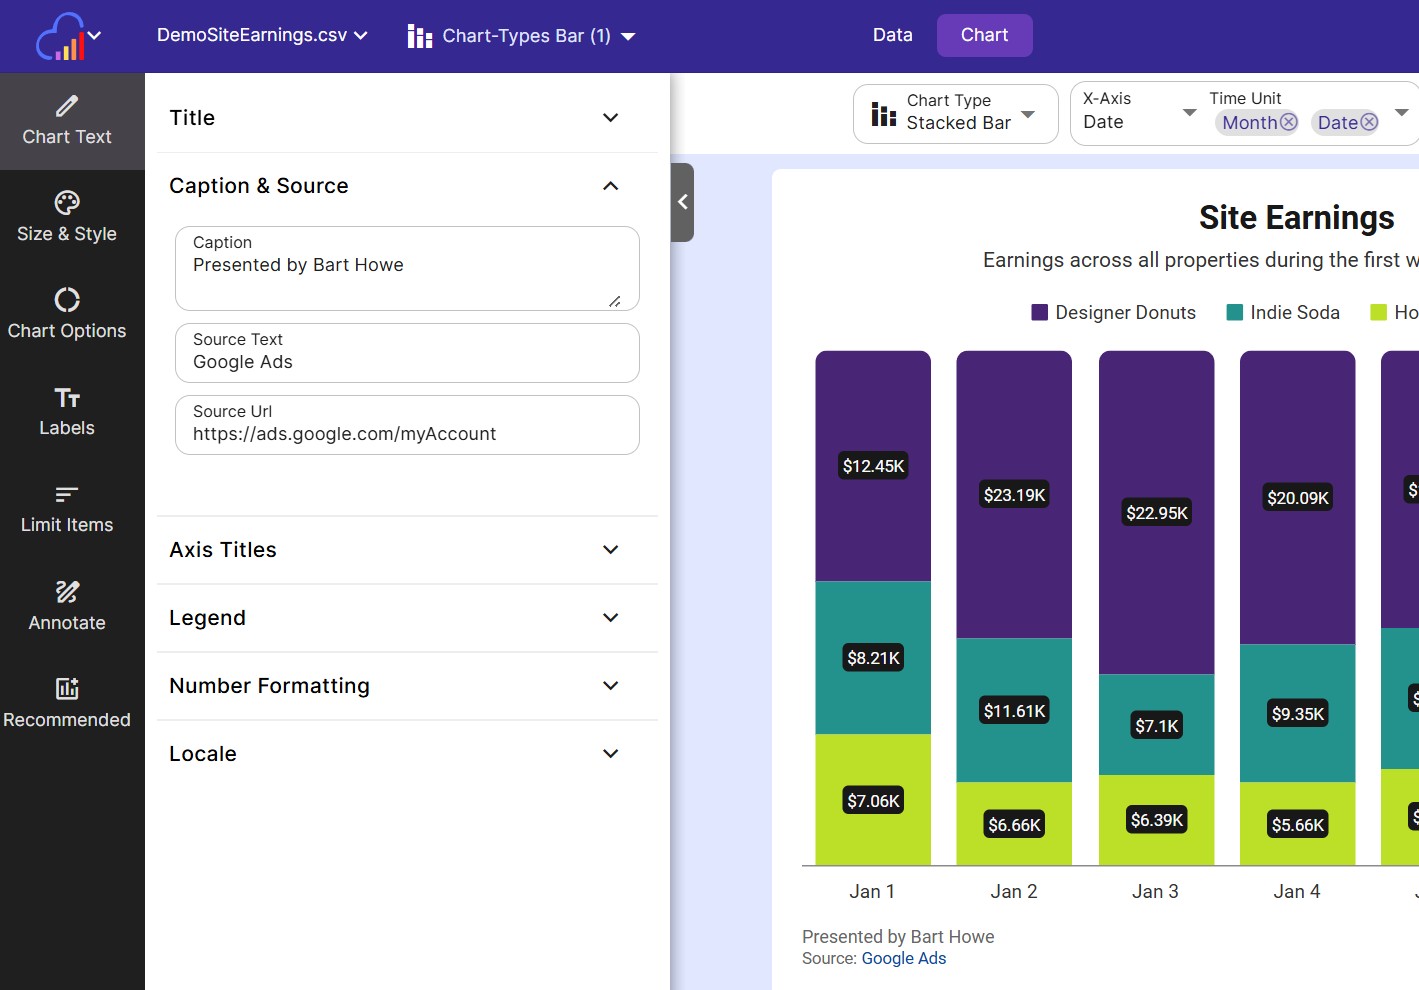
- Caption Enter in text to add a caption to the bottom left corner of the chart.
- Source Text Enter in text to display as a source. Shown on the chart under caption.
- Source Url Enter a url to display as a clickable source link. Shown on the chart under caption.
Axis Titles
- Show Axis Titles Enable this setting to show X and Y Axis titles.
You can either use the column name for the Axis Title (helpful when you are still narrowing down your axis), or you can override the X and Y-Axis title here.
Legend
Some charts such as the grouped charts or pie charts, automatically have legends drawn.
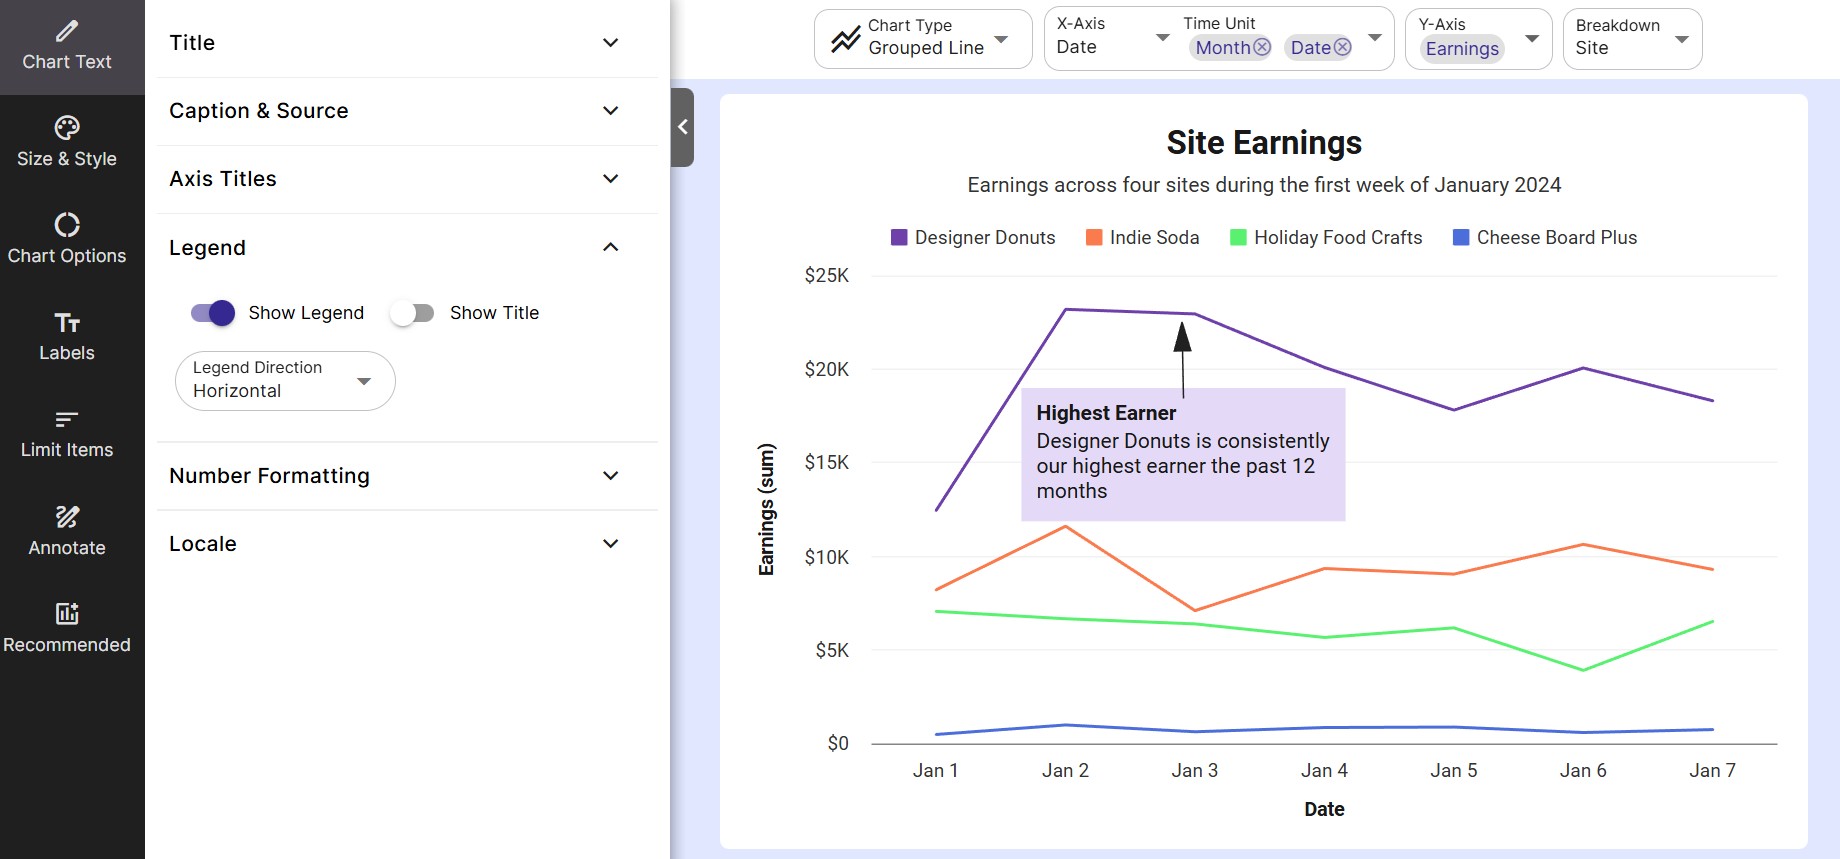
You can further customize the legend with the following options:
-
Show Legend Change this setting to show or hide the legend (if the chart type has one)
-
Show Title Enable this setting to show a legend label above the legend (if the chart has one)
-
Legend Title The text to use as the legend’s title. If the Use Column name checkbox is checked, the title is automatically set to the selected column name of the breakdown axis. Uncheck the checkbox to provide a custom title.
-
Legend Direction Set the direction to Vertical to have the legend on the right side of the chart. Set direction to Horizontal to have the legend items stacked horizontally across the top of the chart.
-
Columns Set the number of columns in a vertical or horizontal legend.
Number Formatting
Number formatting is set to Auto Format by default. Toggle this option off to choose a different format for each numerical axis that contains numbers.
A full description of the number formatting options can be found here: Number formatting.
Locale
Use the Number & Currency Locale and Time Locale dropdowns to change the locale of numbers and dates within the chart. The default values are autodetected by your browser.
List of Number & Currency Locales
Number and Currency locales are important for properly formatting numbers and currencies in your chart. InstaCharts has many number and currency locales from around the world, but this is not an exhaustive list. If we are missing your locale, please feel free to send us an email at support@instacharts.io to include it.
- Arabic
- Chinese - China
- Catalan - Spain
- Czech - Czechia
- Danish - Denmark
- German - Germany
- German - Switzerland
- English - Canada
- English - Great Britain
- English - United States
- Spanish - Spain
- Spanish - Mexico
- Finnish - Finland
- French - Canada
- French - France
- Hungarian - Hungary
- Italian - Italy
- Japanese - Japan
- Korean - Korea
- Dutch - Netherlands
- Polish - Poland
- Portuguese - Brazil
- Portuguese - Portugal
- Russian - Russia
- Russian - Ukraine
- Slovenian - Slovenia
- Turkish - Turkey
- Ukrainian - Ukraine
- Hebrew - Israel
- Swedish - Sweden
- English - India
- Macedonian - North Macedonia
List of Time Locales
Time locales are important for properly formatting dates in your chart. All currently supported time locales are listed below:
- Arabic - Egypt
- Arabic - Syrian Arab Republic
- Catalan - Spain
- Czech - Czechia
- Danish - Denmark
- German - Switzerland
- German - Germany
- English - Canada
- English - Great Britain
- English - United States
- Spanish - Spain
- Spanish - Mexico
- Farsi - Iran
- Finnish - Finland
- French - Canada
- French - France
- Hebrew - Israel
- Croatian - Croatia
- Hungarian - Hungary
- Italian - Italy
- Japanese - Japan
- Korean - Korea
- Macedonian - North Macedonia
- Norwegian Bokmål - Norway
- Dutch - Belgium
- Dutch - Netherlands
- Polish - Poland
- Portuguese - Brazil
- Russian - Russia
- Swedish - Sweden
- Turkish - Turkey
- Ukrainian - Ukraine
- Chinese - China
- Chinese - Taiwan
Related
- Number Formatting - detailed number and currency formats
- Labels - axis, series, data and total labels
- Size and Style - colors, sizing and axis styling
- Chart Options - sorting and chart-specific settings