Filtering
InstaCharts allows you to set a series of filters on your full dataset to limit the amount of rows shown in your chart.
Filters can be found on the Data tab, on the Full Dataset view. Each column can have a series of filters set.
A quick filter option that filters all columns is also available.
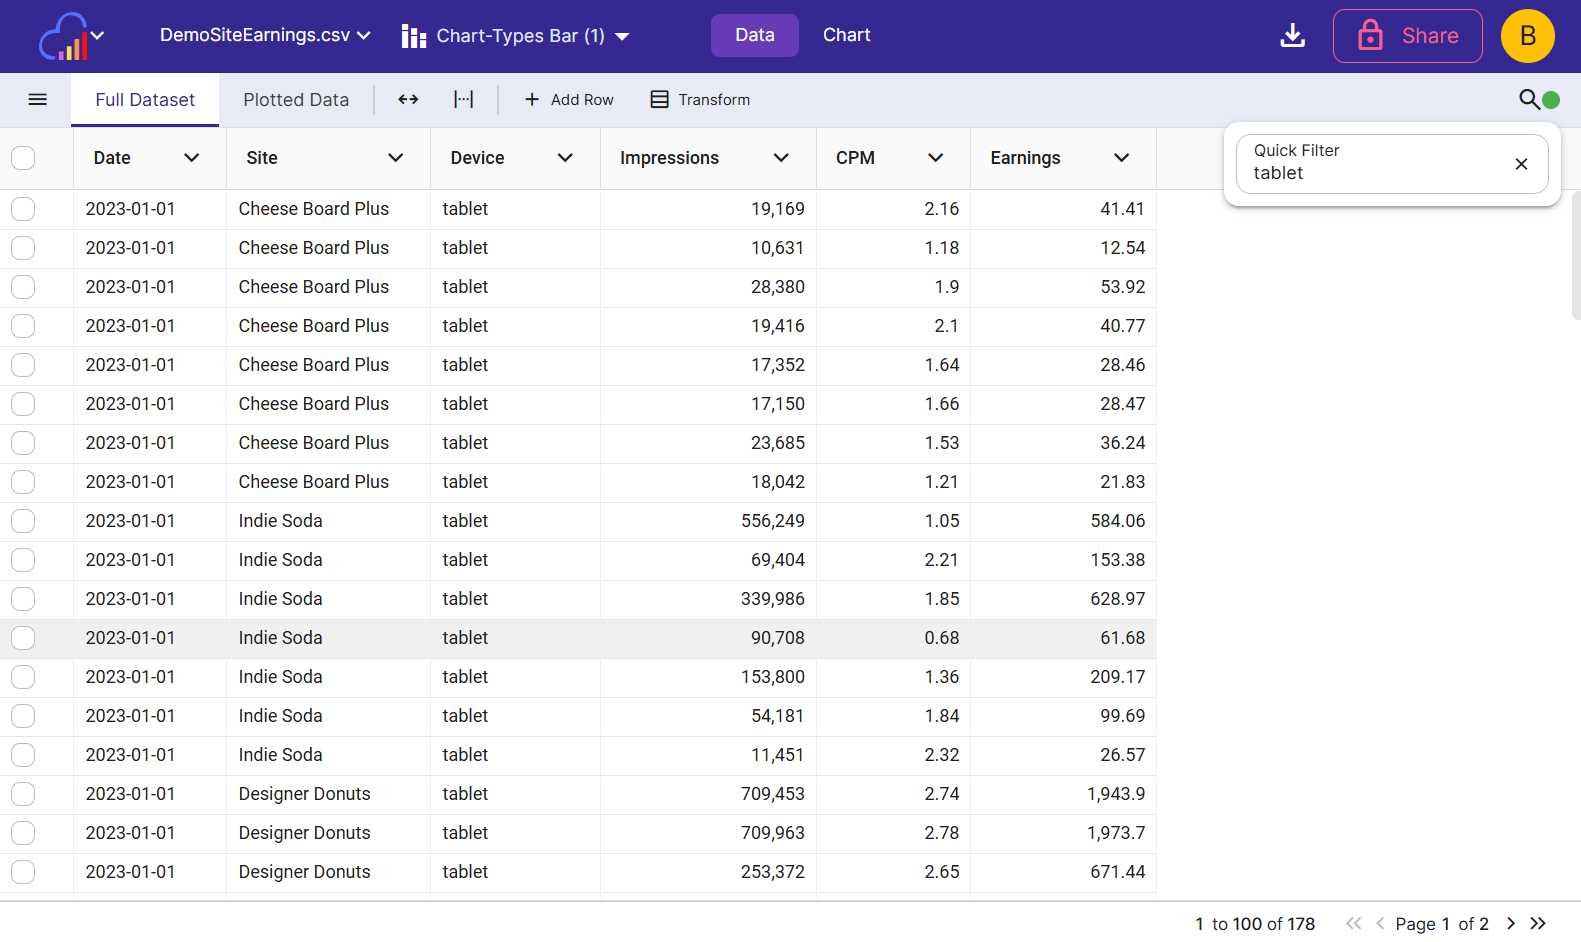
Quick Filter
Need to quickly filter the data that appears in the chart? Click the magnifying glass in the sheet toolbar, and type in a word or number that appears in all rows you want to appear in the chart.
Column Filters
In the Full Dataset view, every column header contains a dropdown menu icon. Click it to launch the column menu, then click Set Filters to launch the Column Filters dialog.
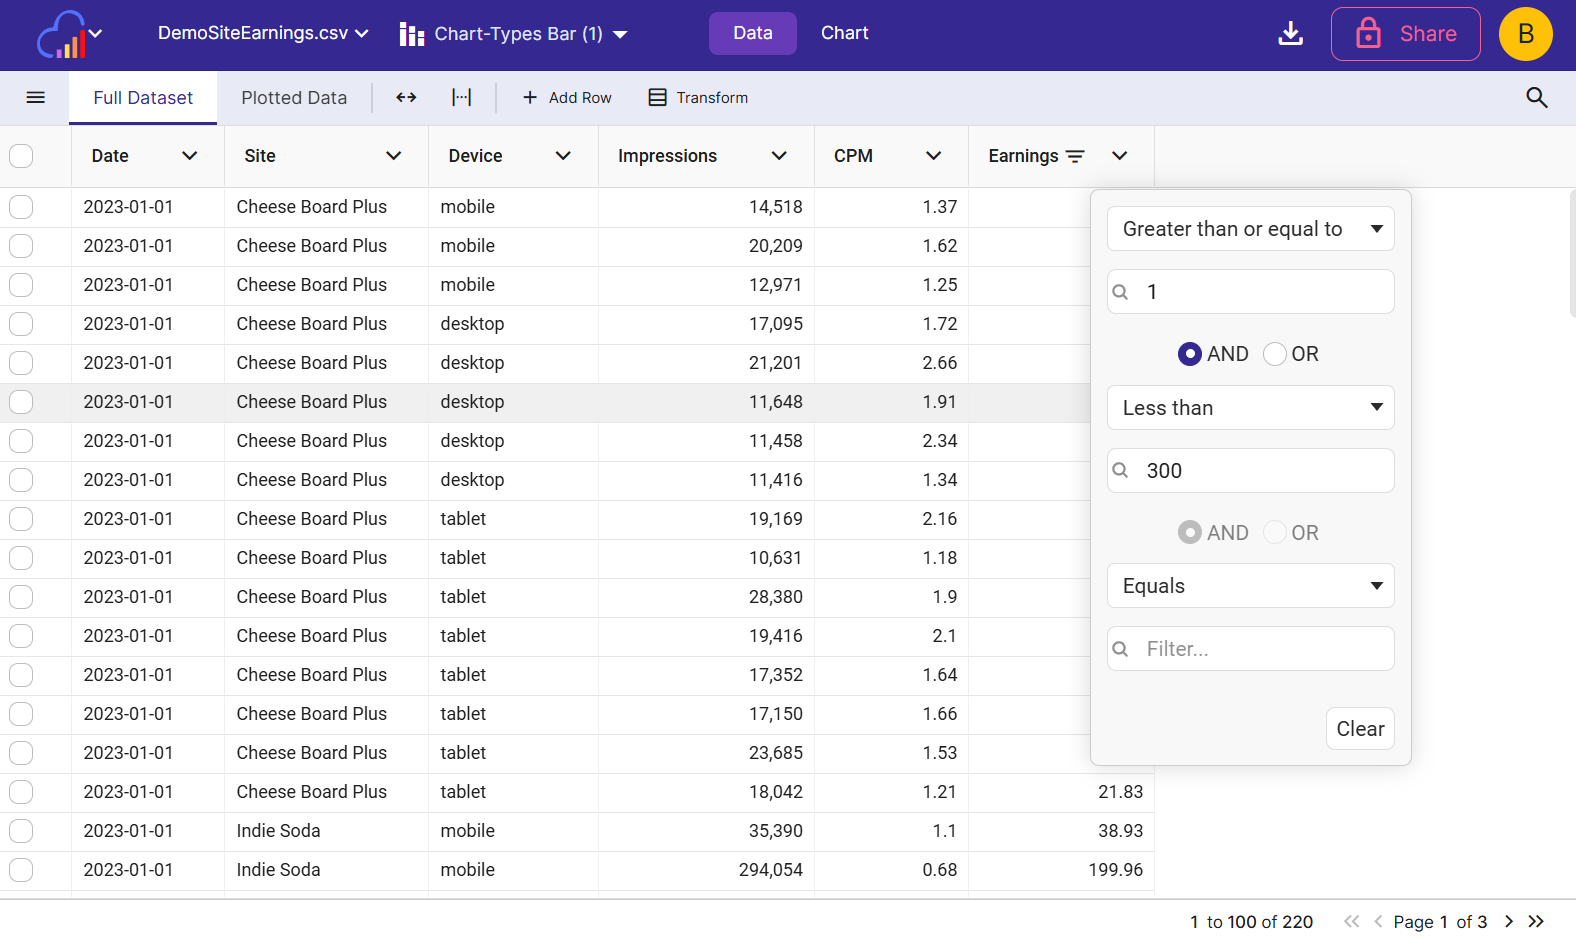
Multiple filters can be set on each column. The filter types are explained below.
Text Filter
Filters on text columns include:
- Contains and Does not contain
- Equals and Does not equal
- Begins with and Ends with
- Blank and Not blank
Number Filter
Filters on numerical columns include:
- Equals and Does not equal
- Greater than and Greater than or equal to
- Less than and Less than or equal to
- Between (inclusive of both ends)
- Blank and Not blank
Date Filter
Filters on date columns include:
- Equals and Does not equal
- Before
- After
- Between (inclusive of both ends)
- Blank and Not Blank
Remove Filters
There are two ways to remove a column filter:
- Select Remove Filters from the column dropdown menu
- Press the Clear button from inside the Column Filters dialog.