Limit Items
Too many items in the chart? Limit the chart to the top n items, or create bins of numerical values to reduce the noise in the chart.
Open the Limit Items panel from the left sidebar.

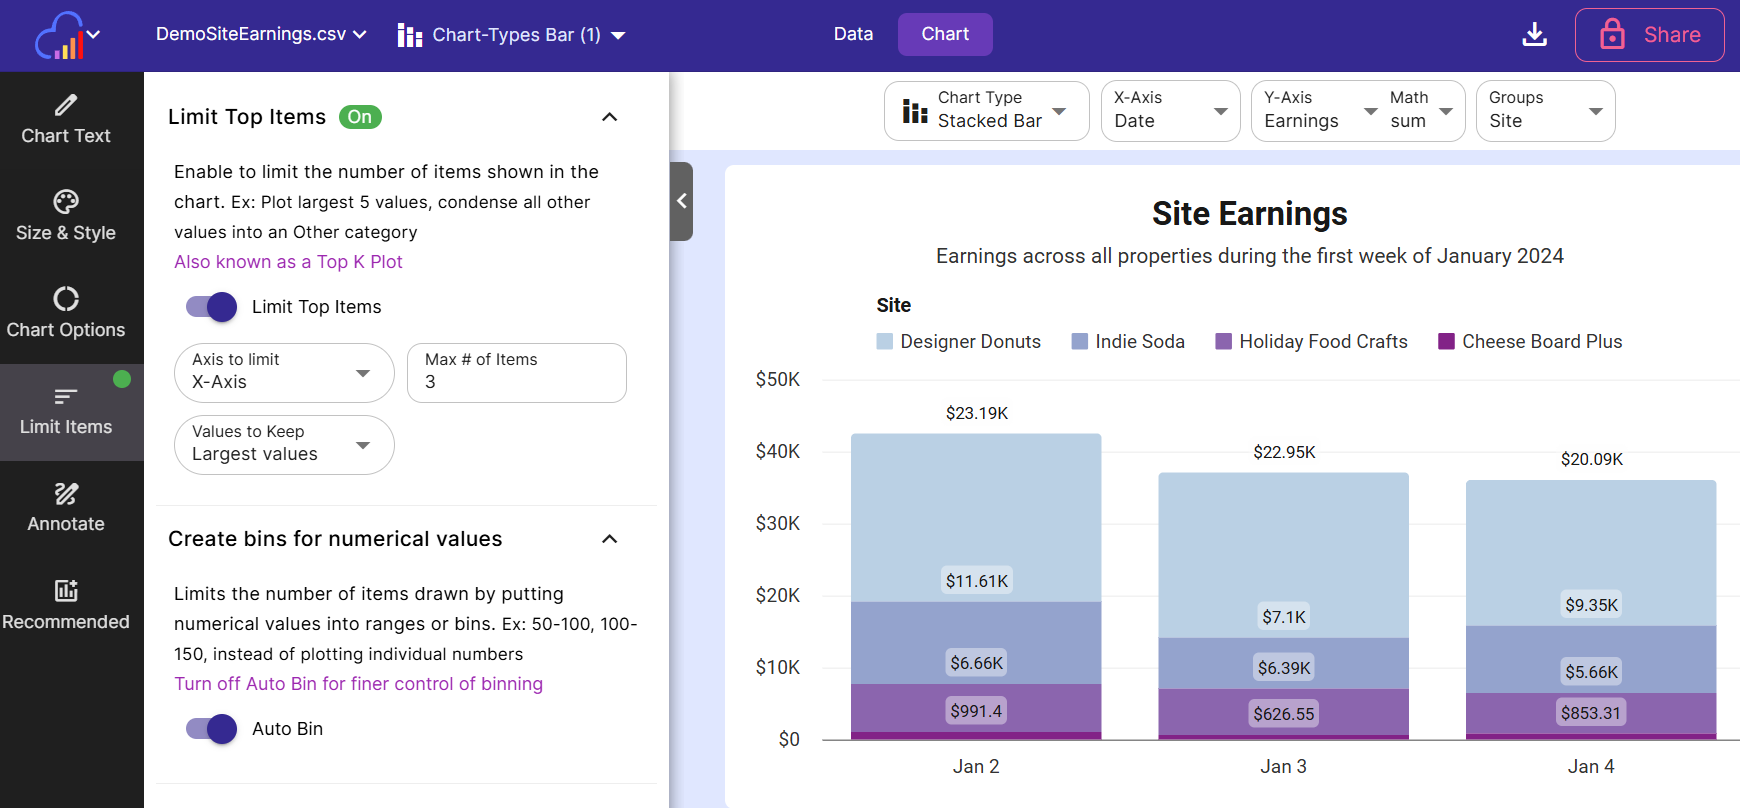
Limit Top Items
Limit the number of items shown to the largest n or smallest n items. You can also pick which axis is filtered and whether to group the remaining items into an Others category.
-
Limit Top Items Toggle this switch on to limit the number of items appearing in the chart
-
Axis to Limit Choose the axis that should have its items limited. The X Axis is chosen by default and may be the only option. If you are using a multi series chart and a single series breakdown, e, you will be able to limit the items in Breakdown.
-
Max # of Items Specify the maximum number of items to show in the chart. For example, if a bar chart with 25 bars was produced, enter 10 in this field to limit it to the top (or bottom) 10 items.
-
Values to Keep Choose to either show the largest n items in the chart, or the smallest n items in the chart.
-
Group the rest into All Others Category Check this checkbox to group any items that were too small (or too large) to pass the limit into an Others category. This option is not available for numeric or date columns.
Create bins for numerical values
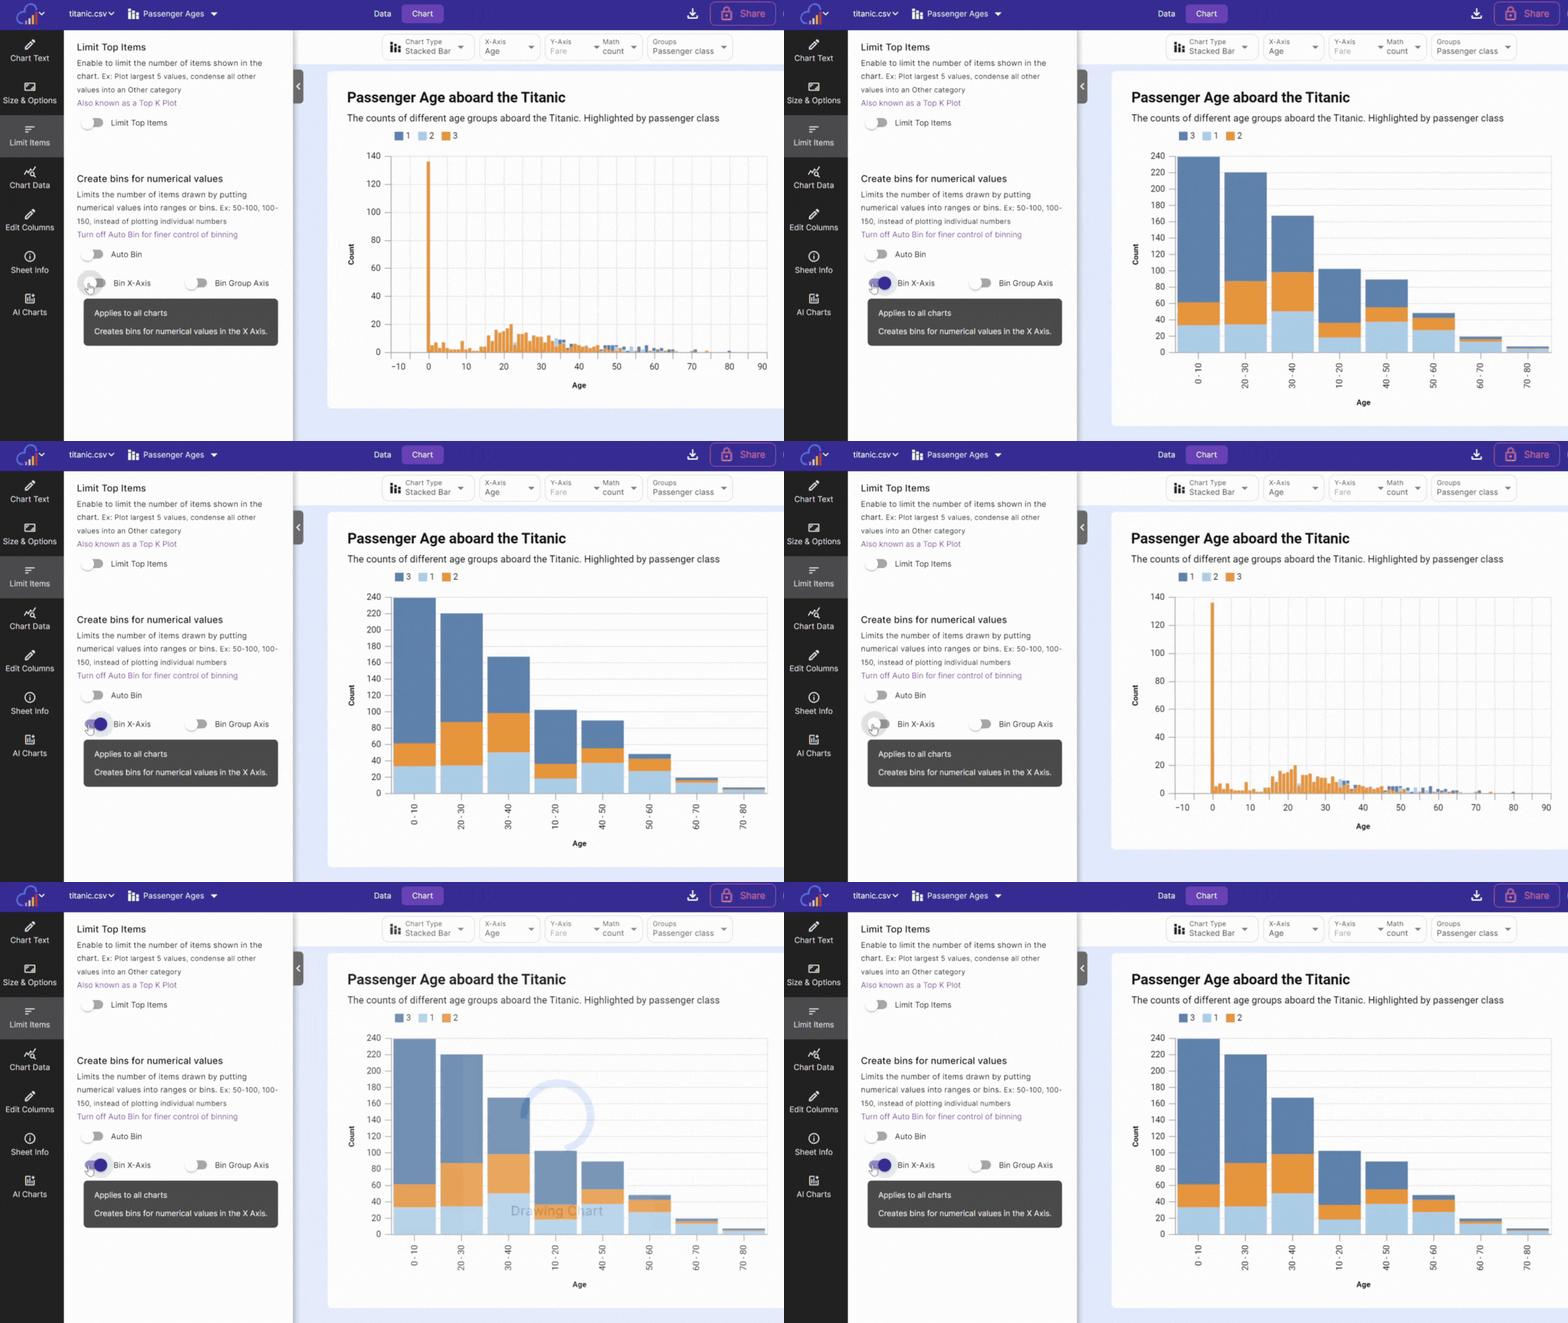
This option is turned on by default, and limits the number of items drawn in the chart by putting numerical values into ranges or bins.
Ex: Instead of plotting individual numbers between 1 and 200, the software will create bins of 0-50, 51-100, 101-150, 151-200. This reduces the amount of data points plotted.
Optionally increase or decrease the amount of bins per axis by setting the # of Bins option per axis. The default value is 6 bins.

-
Auto Bin Turn this off for finer control of binning. By default, most numeric values on non scatterplot charts will be binned.
-
Bin X-Axis Toggle this on or off to control binning on the X-Axis
-
Bin Breakdown Axis Toggle this on or off to control binning on the Breakdown Axis
-
# of Bins When an axis bin is on, choose the number of bins to appear in the axis. This is not an exact number.
Filters
You can set some commonly used filters here. More complex filters (like column filters) can be set on the Full Dataset view of the Data tab.
Filters include:
- Remove blank values from X-Axis
- Remove zeros from Y-Axis/Series
- Remove blank values from Breakdown
- Quick Filter: Enter in quick filter text here to filter the items shown in all rows of the chart.