Generate charts with a template
Need to generate custom charts for multiple clients without writing code?
In this guide, we’ll walk through creating reusable chart templates and customizing them on the fly with URL parameters. These quick and easy custom charts are perfect for agencies and businesses managing multiple client reports.
In this guide, we’ll use an example of creating a quarterly Adwords keywords report for multiple clients.
Understanding the Workflow
The process consists of four main steps:
- Create a base template in InstaCharts
- Enable the template and get its URL
- Modify URL parameters to customize the chart for each client
- Send or share the customized template URL
Using a template allows you to maintain consistent branding and layout among your charts, update multiple charts quickly, and share charts via simple URLs.
Let’s get started!
Creating Your Base Template
Step 1: Prepare Your Default Chart Settings
- Select a dataset to base your template on. The dataset should be representative of the typical client data you want to chart.
- Upload the dataset to InstaCharts.
- Name the active chart something descriptive like “Quarterly Template” to remember which chart you used as a template.
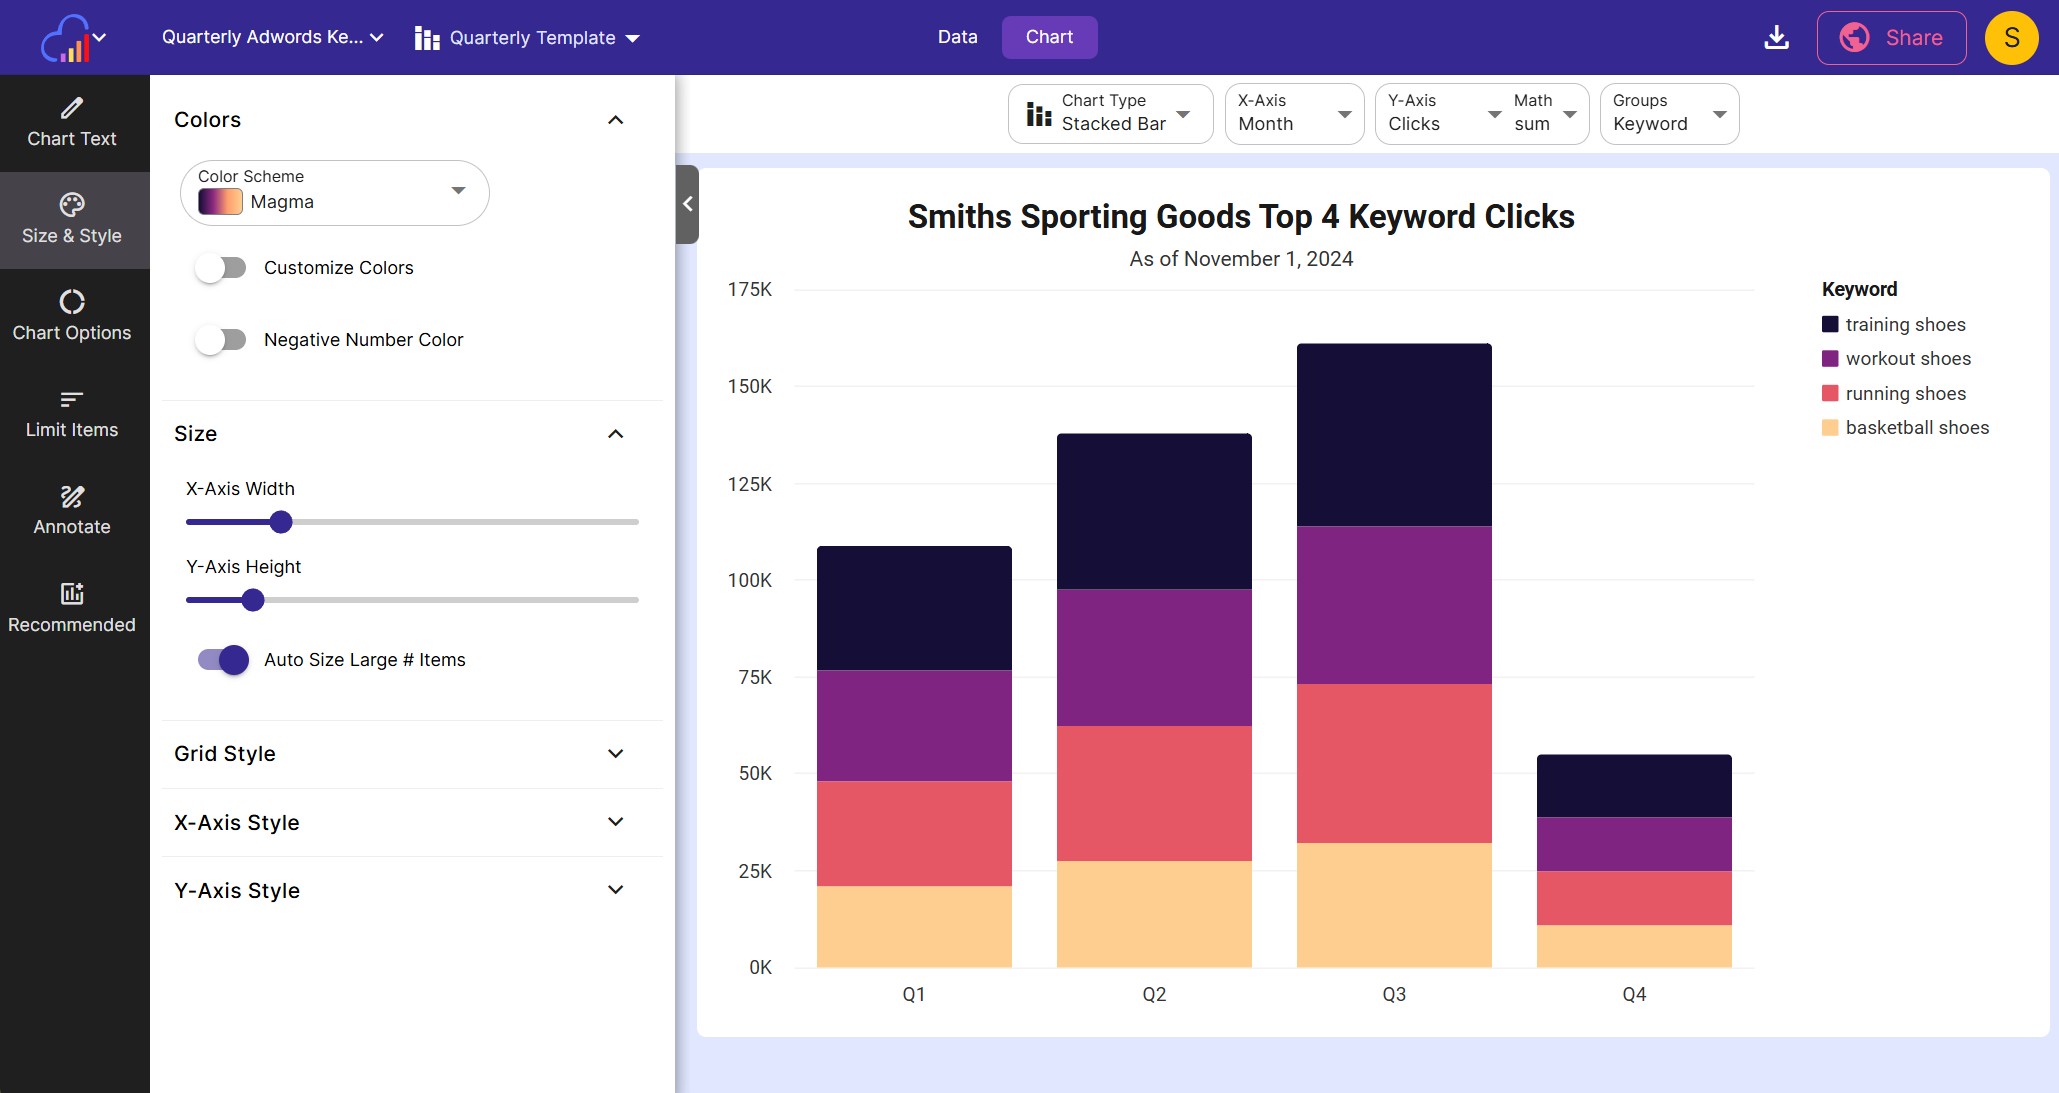
- Edit this chart until it resembles the final chart that you’d like to send to your client. Choose a chart type, columns to plot, set the chart’s text, change the chart’s colors and add trend lines.
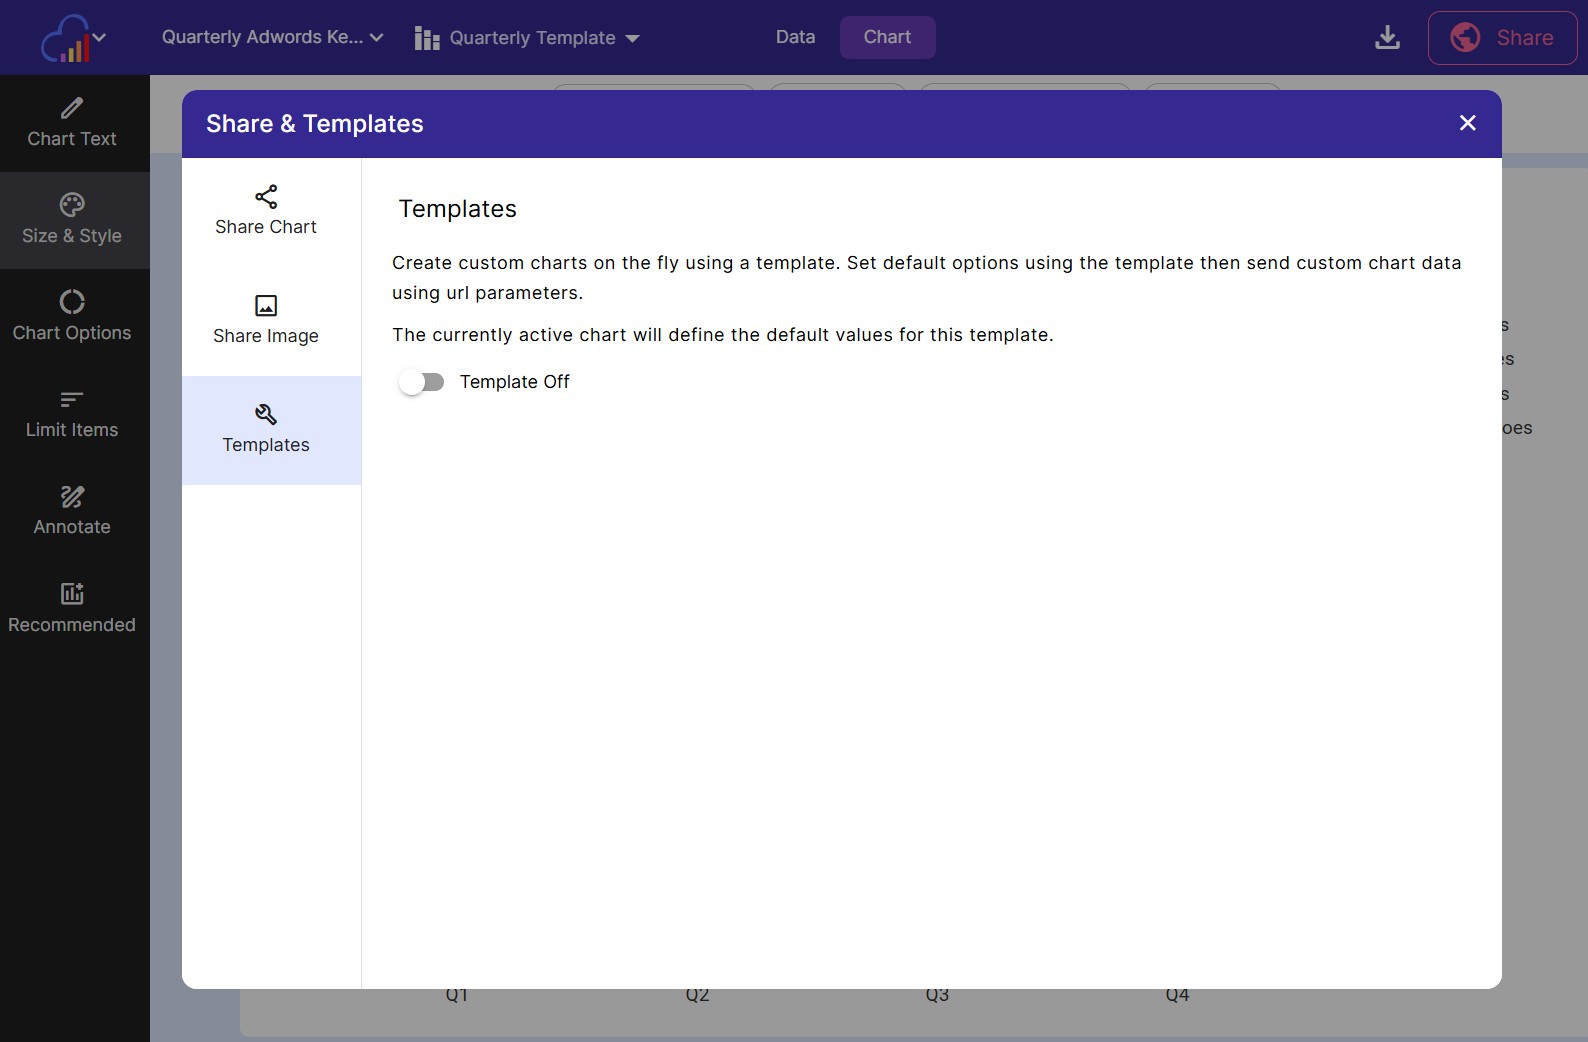
Step 2: Enable Templating
From the main toolbar, open the Share & Template Dialog. Click Template from the left sidebar, and toggle the template to on. This just turned your current chart into a template to use for chart generation.
Any changes made to the chart will be reflected in all the charts generated by this template.
Set up template options
- Choose Views Choose which views to show in your template. You can choose from chart, the full dataset (shown in a data table) or the plotted data (also shown in a data table).
- Enter a Share Title Optionally give your template a title. The title will appear across the top of a shared interactive chart.
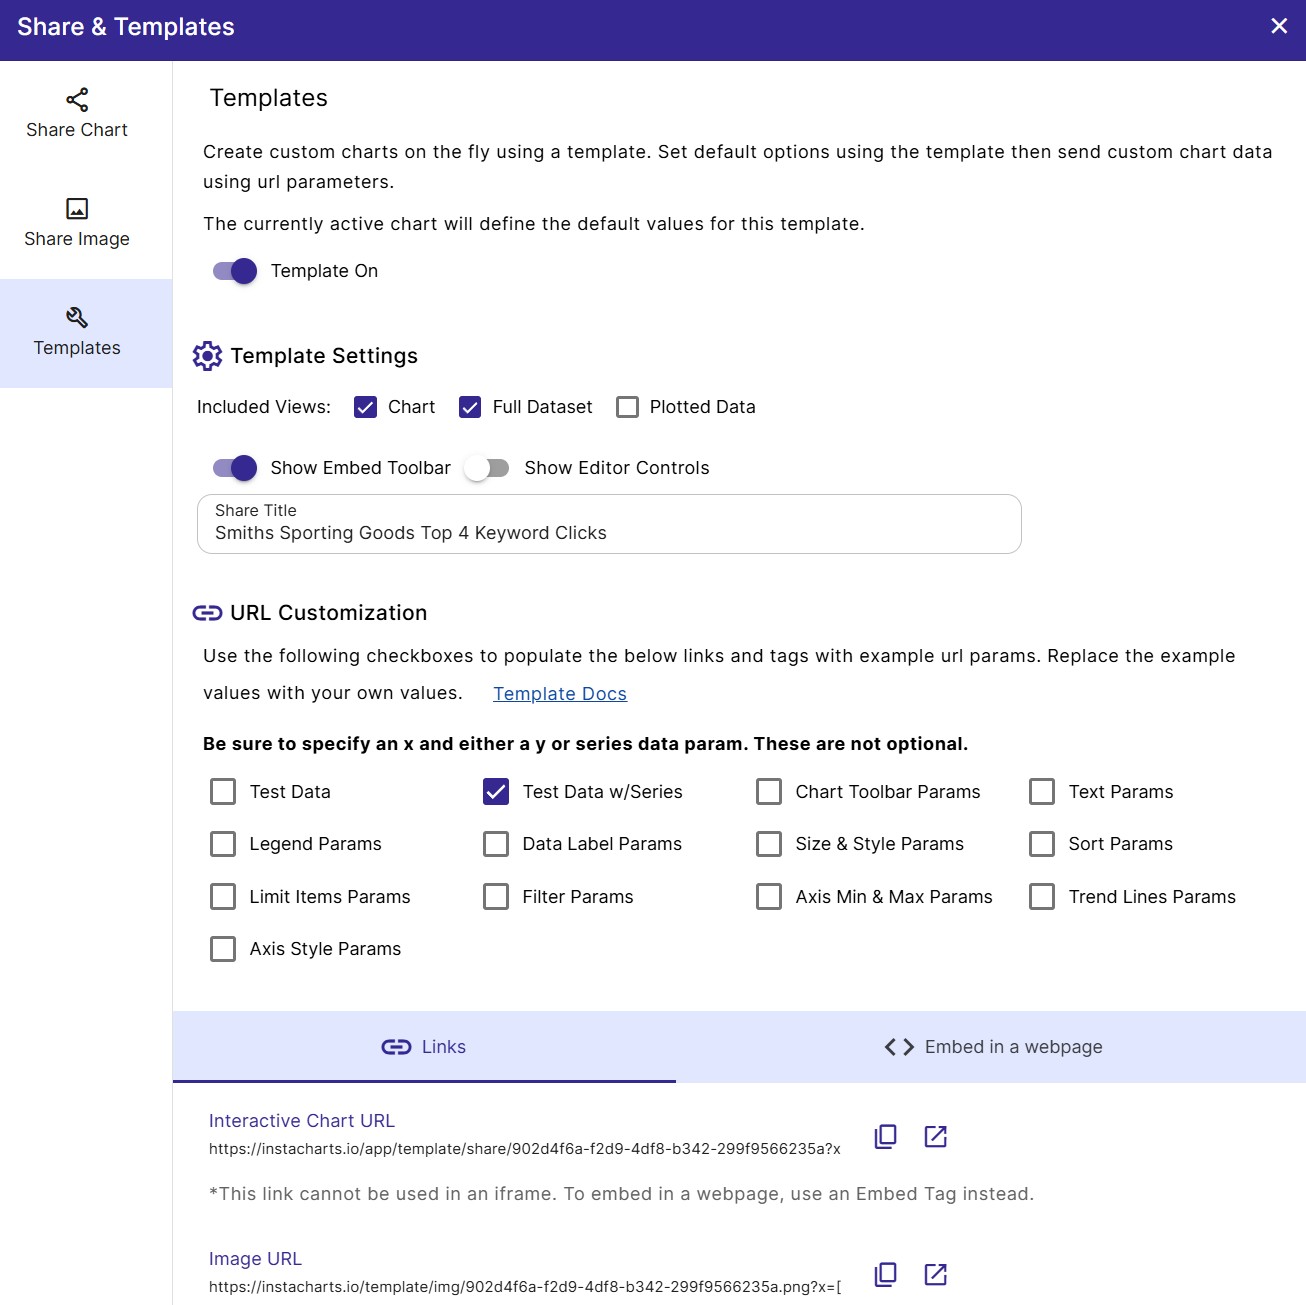
Decide template type
There are 4 template types to choose from, each has a different base URL. To choose one, copy it to your clipboard then paste (and modify it) in the program of your choosing.
Under the Links tab, you can choose from:
- Interactive Chart URL
- Image URL
Under Embed in a webpage, you can choose from:
- Interactive Chart Tag
- Image Tag
You have two decisions to make here.
- Do I want to embed the chart into a webpage or send a link?
- Do I want to send an interactive chart or a static image?
Based on your decisions, copy the appropriate link. In our case, we are going to be sending a link to an interactive chart, so copy the first URL under the Links tab.
https://instacharts.io/app/template/share/902d4f6a-f2d9-4df8-b342-299f9566235a?x=[2023-09,2023-06,2023-03]&series=[{"label":"training shoes","data":[47280,40410,32280]},{"label":"workout shoes","data":[40790,35280,28400]},{"label":"basketball shoes","data":[31950,27340,21050]},{"label":"running shoes","data":[41080,34850,27020]}]Step 3: Modify URL parameters for each client
When we copied our chart template link above, the Test Data checkbox was checked under URL Customizations. This inserts up to 30 rows of data from the chart into the template URL, making it easier to enter in your own values. We’re using the series param to include data series to show in the legend.
This is what’s currently in our URL:
x=[2023-09,2023-06,2023-03]series=[ {"label":"training shoes","data":[47280,40410,32280]}, {"label":"workout shoes","data":[40790,35280,28400]}, {"label":"basketball shoes","data":[31950,27340,21050]}, {"label":"running shoes","data":[41080,34850,27020]} ]Our new numbers for Q4 have come in, and we’ll need to update the params with the new values:
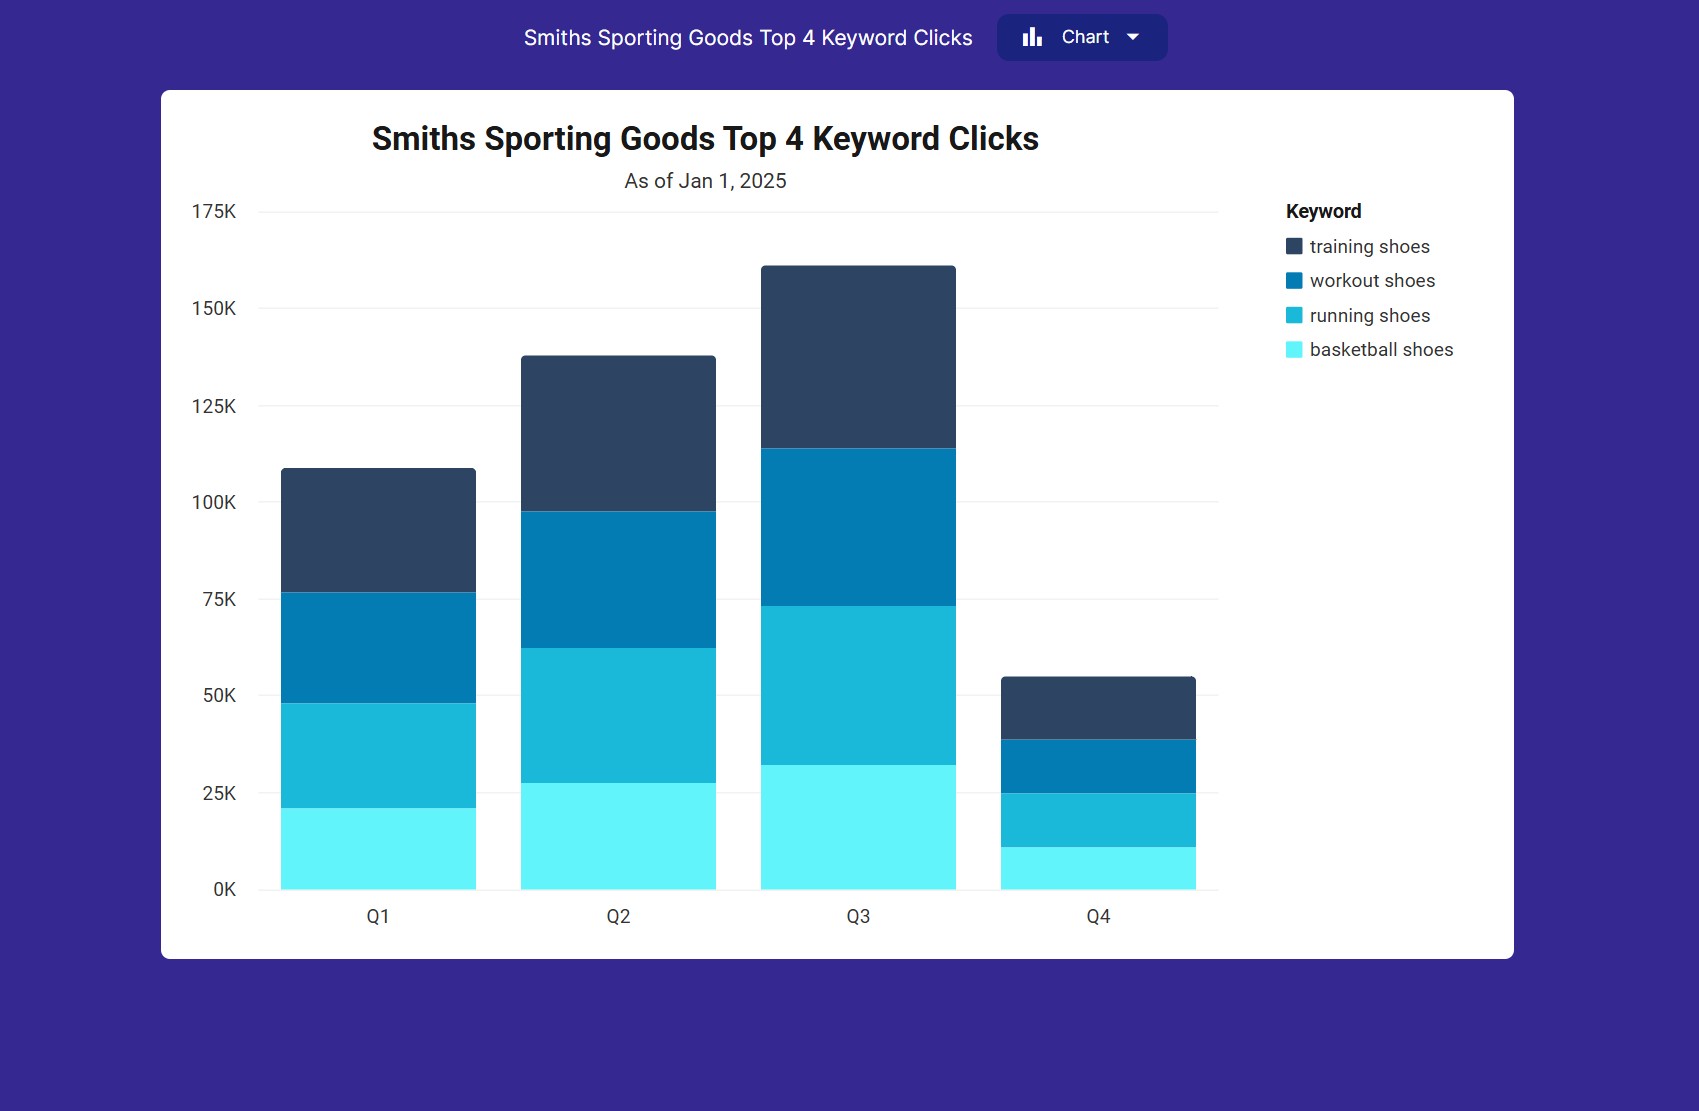
x=[2023-10,2023-09,2023-06,2023-03]series=[ {"label":"training shoes","data":[16280,47280,40410,32280]}, {"label":"workout shoes","data":[13850,40790,35280,28400]}, {"label":"basketball shoes","data":[10850,31950,27340,21050]}, {"label":"running shoes","data":[13850,41080,34850,27020]} ]We need to update the chart’s subtitle to mark that we’ve added new data
subtitle=As of Jan 1, 2025Our client’s branding has a lot of blue in it, so we’ll change the chart colors to blue
colorScheme=darkbluePutting together all of our changed url params (don’t forget to tie each param together with an ’&’), we get this as our shareable URL:
https://instacharts.io/app/template/share/902d4f6a-f2d9-4df8-b342-299f9566235a?x=[2023-10,2023-09,2023-06,2023-03]&series=[{"label":"training shoes","data":[16280,47280,40410,32280]},{"label":"workout shoes","data":[13850,40790,35280,28400]},{"label":"basketball shoes","data":[10850,31950,27340,21050]},{"label":"running shoes","data":[13850,41080,34850,27020]}]&colorScheme=darkblue&subtitle=As of Jan 1, 2025Step 4: Send and Share
Send the completed link to a client, or embed it into an html report.
Next Steps
Now that you have learned how to make a basic template, read on to discover other powerful InstaCharts features:
Automate Chart Images using Zapier and Chart Templates
How to use Data Transformations
How to Import data with Google Sheets
How to Share a Chart via a link