
Edit Data
It is possible to edit your data from the data tab. To add more data to your sheet, type it in directly, use the Add Row and Add Column buttons in the toolbar, use Ctrl+V to paste into the data grid, or right-click and choose Paste Special to paste a larger block of data through a dedicated entry screen.
Any data edits you make will be applied to all charts in the sheet.
Open the Data Tab
Inside a sheet, click Data in the Data and Chart toggle on the main toolbar. Make sure the Full Dataset tab is selected. This tab shows every row and column in the sheet, and it is where all editing happens. The Plotted Data tab shows the data the active chart is drawing, after its filters and aggregation.
The toolbar above the data table holds:
- Fit Screen and Fit Columns Resize the columns to fit the screen, or to fit the text in each column.
- Add Row and Add Column Add new data to the sheet.
- Transform Open the Transform Data dialog.
- Plotting Choose whether the chart uses all rows or only selected rows.
- Quick Filter Search all columns for a word or number. See Filtering.
Click a column header to sort the table by that column. Click once to sort ascending, again to sort descending, and a third time to return to the original order. Sorting changes the order of the table on screen, and the sheet’s data keeps its original order.
Editing Data
Edit mode will automatically turn on if you’ve edited the sheet. Any cells you’ve edited will be highlighted in blue.
A Cancel and Save button will appear, and outside toolbars will become disabled. The edit bar also shows how many rows you have changed.
To leave edit mode, either click Cancel or Save Edits, to save any changes you have made. Clicking Cancel asks you to confirm before your edits are discarded.

Editing Individual Cells
Double click a cell to edit its data. You can also paste from your clipboard using Ctrl + V .
When you paste with Ctrl+V, the data is pasted starting at the selected cell and fills the cells to the right and below it.
Copy, Cut and Paste
Select a range of cells, then right-click to open the data table menu:
- Copy Copies the selected cells.
- Copy with Headers Copies the selected cells along with their column names, ready to paste into another spreadsheet.
- Cut Copies the selected cells and clears them.
- Paste Special Opens a large text box for pasting a block of data. It accepts CSV, TSV, PSV and JSON, and shows a badge when JSON or JSON Lines is detected. If the pasted data has more rows or columns than your plan allows, a warning shows how much of it will be pasted.
Find and Replace
Sometimes it’s useful to replace a value across many cells at once, for example renaming short form data often found in spreadsheets (like “M” for “Male”) with a more descriptive value for charting.
Press Ctrl+F, or right-click a cell and select Find & Replace, to open the Find and Replace dialog. Switch to the Replace tab, enter the value to find and the value to replace it with, then click Replace to update the current match or Replace All to update every match at once.
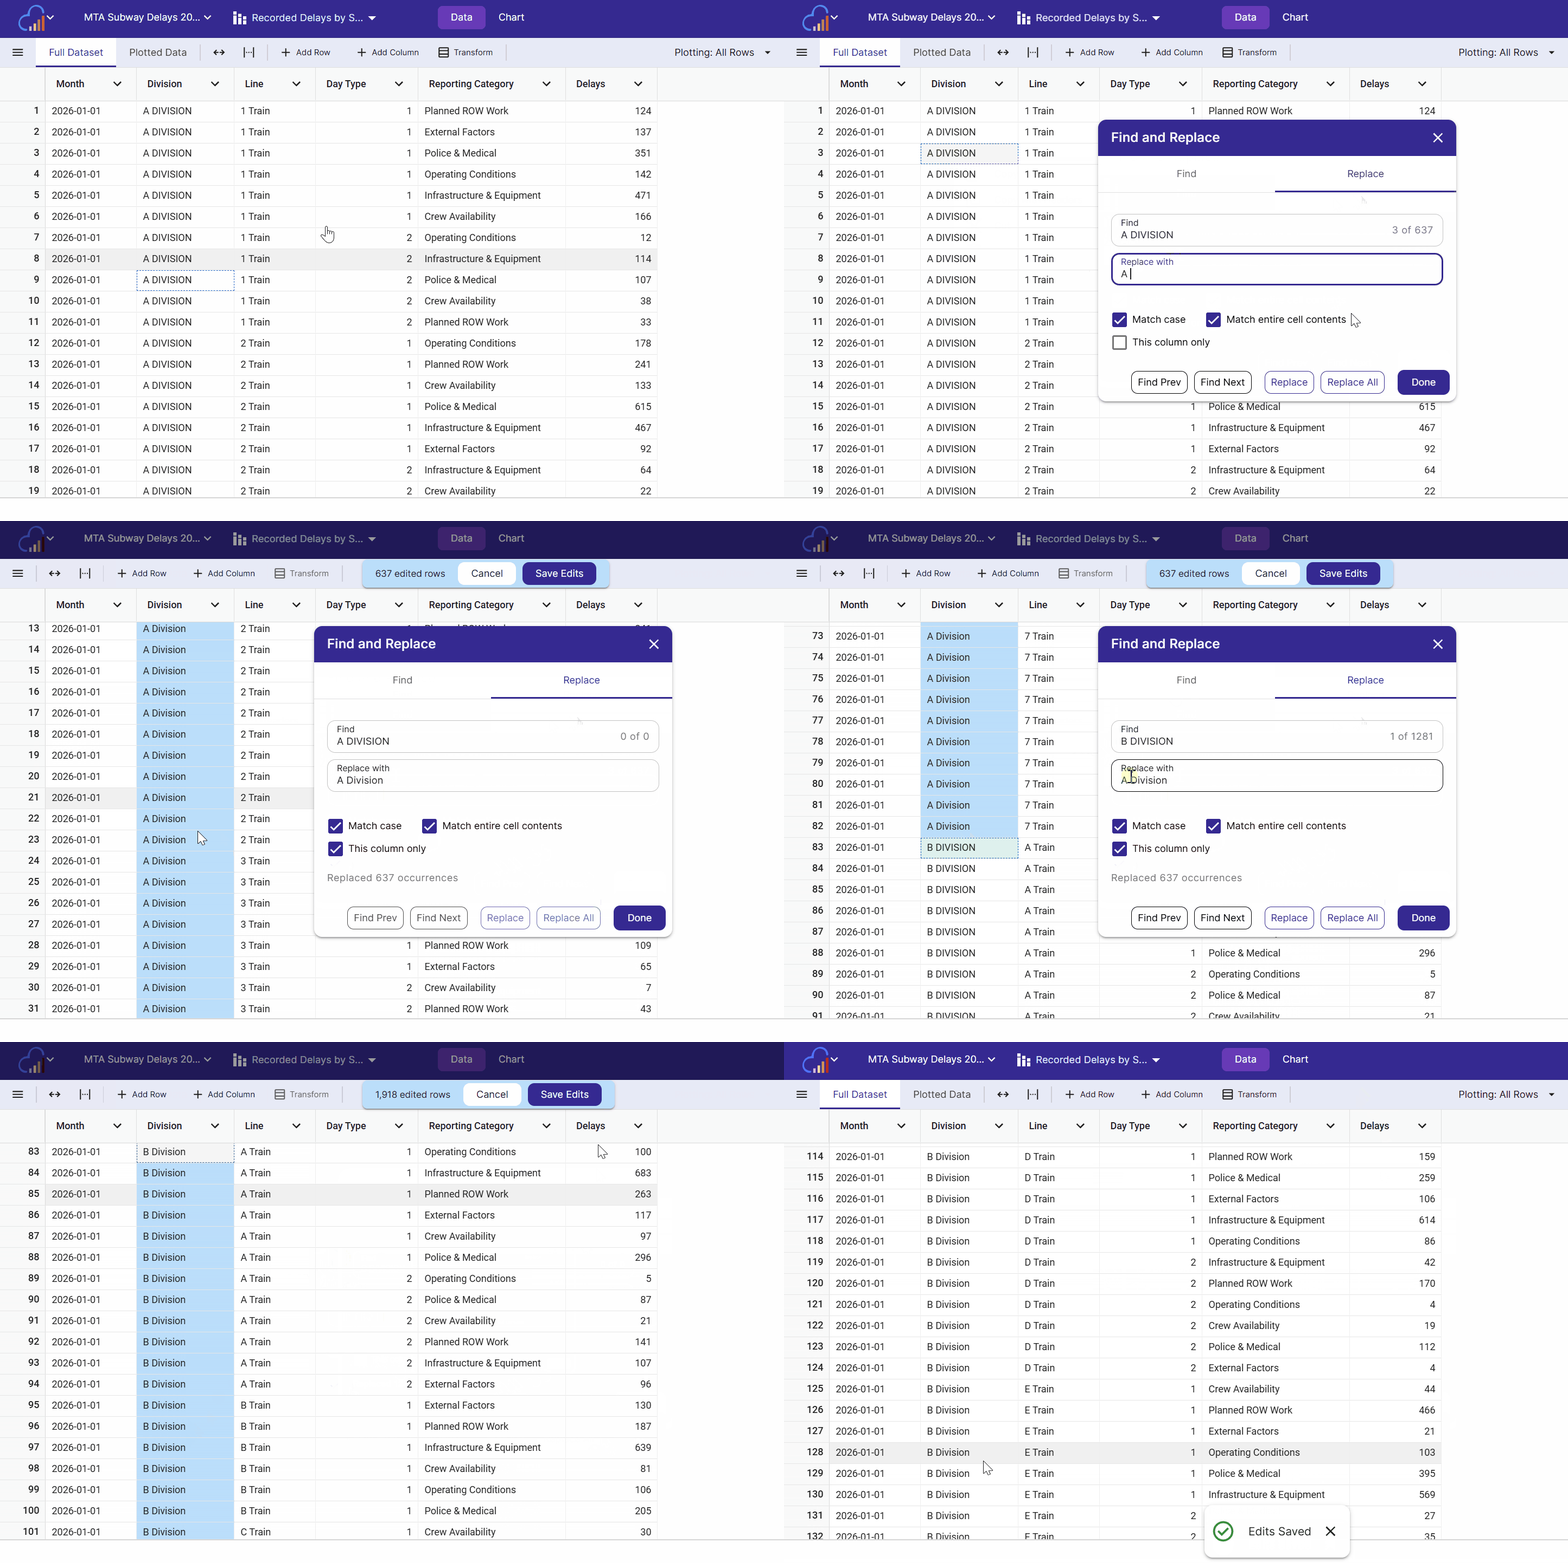
Two checkboxes control how matching works:
- Match case - off by default, so searches ignore capitalization
- Match entire cell contents - off by default, so a search matches partial text inside a cell. Turn this on to only replace cells whose entire value matches exactly, the same behavior the old Replace Values worked with.
Add and Delete Rows
Add a Row
Click Add Row in the toolbar to open the Add New Row dialog. The dialog has one field for each column in the sheet, and each field matches the column’s type: a text box for text, a number box for numbers, and date and time pickers for dates. Fill in the values and click Save to add the row to the table, then click Save Edits to save it to the sheet.
To add many rows at once, paste them with Ctrl+V or Paste Special.
Delete Rows
Select cells in the rows you want to remove, right-click, and choose Delete Selected Rows. Confirm the number of rows in the dialog, and the rows are queued for deletion. Click Save Edits to delete them, or Cancel to keep them.
Edit Columns
To edit a column, open its menu from its top right corner.
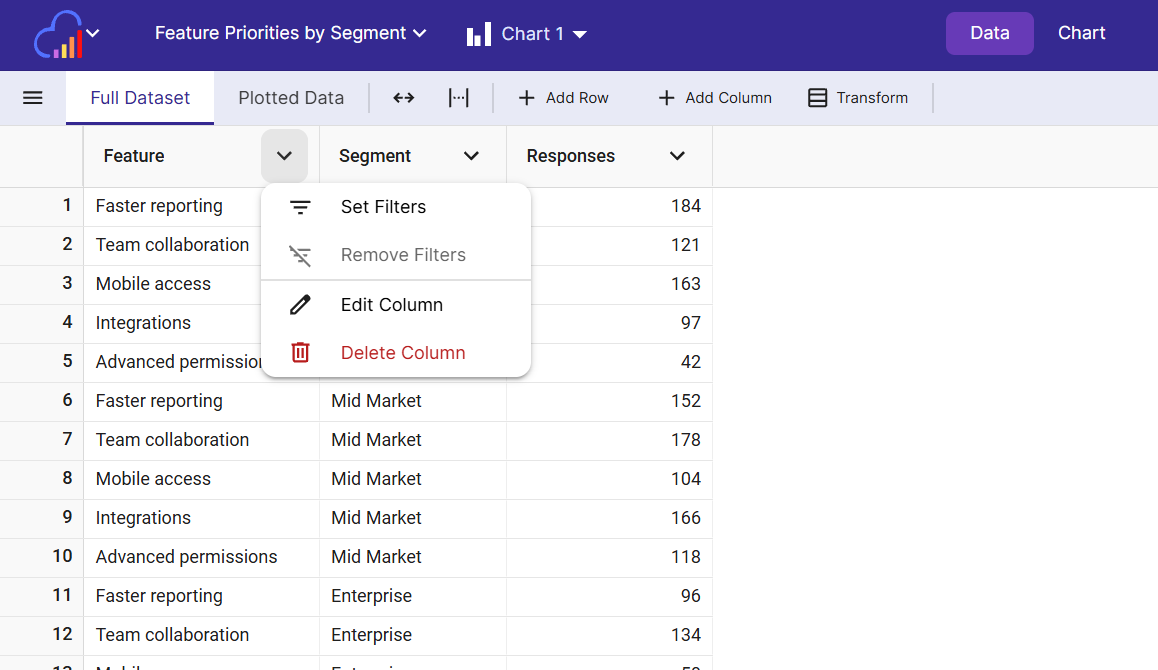
Add Column
Click Add Column in the toolbar, then enter the new column’s name and choose its type. The column is added as a blank column, ready for you to type or paste data into. Click Save Edits to keep it.
Edit Column
Edit the column’s name and type here.
- Column Name The name shown in the data table, in chart dropdowns and in axis titles.
- Column Type InstaCharts recommends a type based on the data in the column. Hover over the info icon beside the recommendation to see the types of values found in the column, its cardinality (number of unique values) and its largest distribution. Leave Use Recommended Type on to keep the recommendation, or turn it off to choose a different type. See Column Types for every type and how each one charts.
Changing a column’s type affects every chart that uses the column.
Set Filters / Remove Filters
Opens the Column Filters dialog for that column, or clears any filters already set on it.
Split Object Column
This option appears on columns that hold JSON objects. It expands the JSON into separate columns. Check the fields to keep, give each new column a name, and click Split Column. The original column is replaced by the new columns, and the change affects all charts in the sheet. Click Save Edits to keep the split.
Delete Column
Will delete the column from the sheet. This cannot be undone.
The column is deleted as soon as you confirm, without waiting for Save Edits.
Saving Data Edits
Click the Save button to save any changes you have made. The saved edits will be applied to the underlying dataset of the sheet, and therefore all charts in the sheet will receive the updated data.
Transform Your Data
Some datasets need to be reshaped before they make good charts. Click Transform on the Full Dataset toolbar to open the Transform Data dialog, then choose a transformation. Each one shows a live preview before you apply it.
| Transformation | What it does |
|---|---|
| Pivot | Turns the unique values of a column into new columns, creating a wider table with fewer rows. |
| Unpivot | Condenses several columns into an item column and a value column, creating a longer table. |
| Merge Columns | Combines two or more columns into one, joined by a comma or a space. |
| Split Columns | Breaks one column into several columns using a delimiter such as a comma, space or pipe. |
Unpivot is the most common fix for spreadsheets that have one column per category or per year, such as “Jan”, “Feb” and “Mar”. Unpivoting them into a Month column and a Value column lets you chart every month at once and use Month as a Breakdown.
To split a column of JSON objects into separate columns, use Split Object Column from the column menu.
See Transform Data for step by step instructions for each transformation.
Export Data
Right-click the data table and choose Export Data to download the whole sheet, or select a range of cells and choose Export Selected to download just those cells. See Export Data for the file types available.
Related
- Transform Data - pivot, unpivot, merge and split columns
- Column Types - how each column type charts
- Formatting Data for Import - structure your data before you upload
- Update Sheet Data - refresh the sheet from a newer file
- Filtering - hide rows from a chart without editing the data
- Export Data - download the sheet as CSV, Excel or JSON