Dashboard Overview
A dashboard is a single page that combines widgets - charts, data tables, KPI metrics and text notes - built from the sheets in your workspace. Use a dashboard to put your key numbers, trends and context in one live view that your whole team can see.
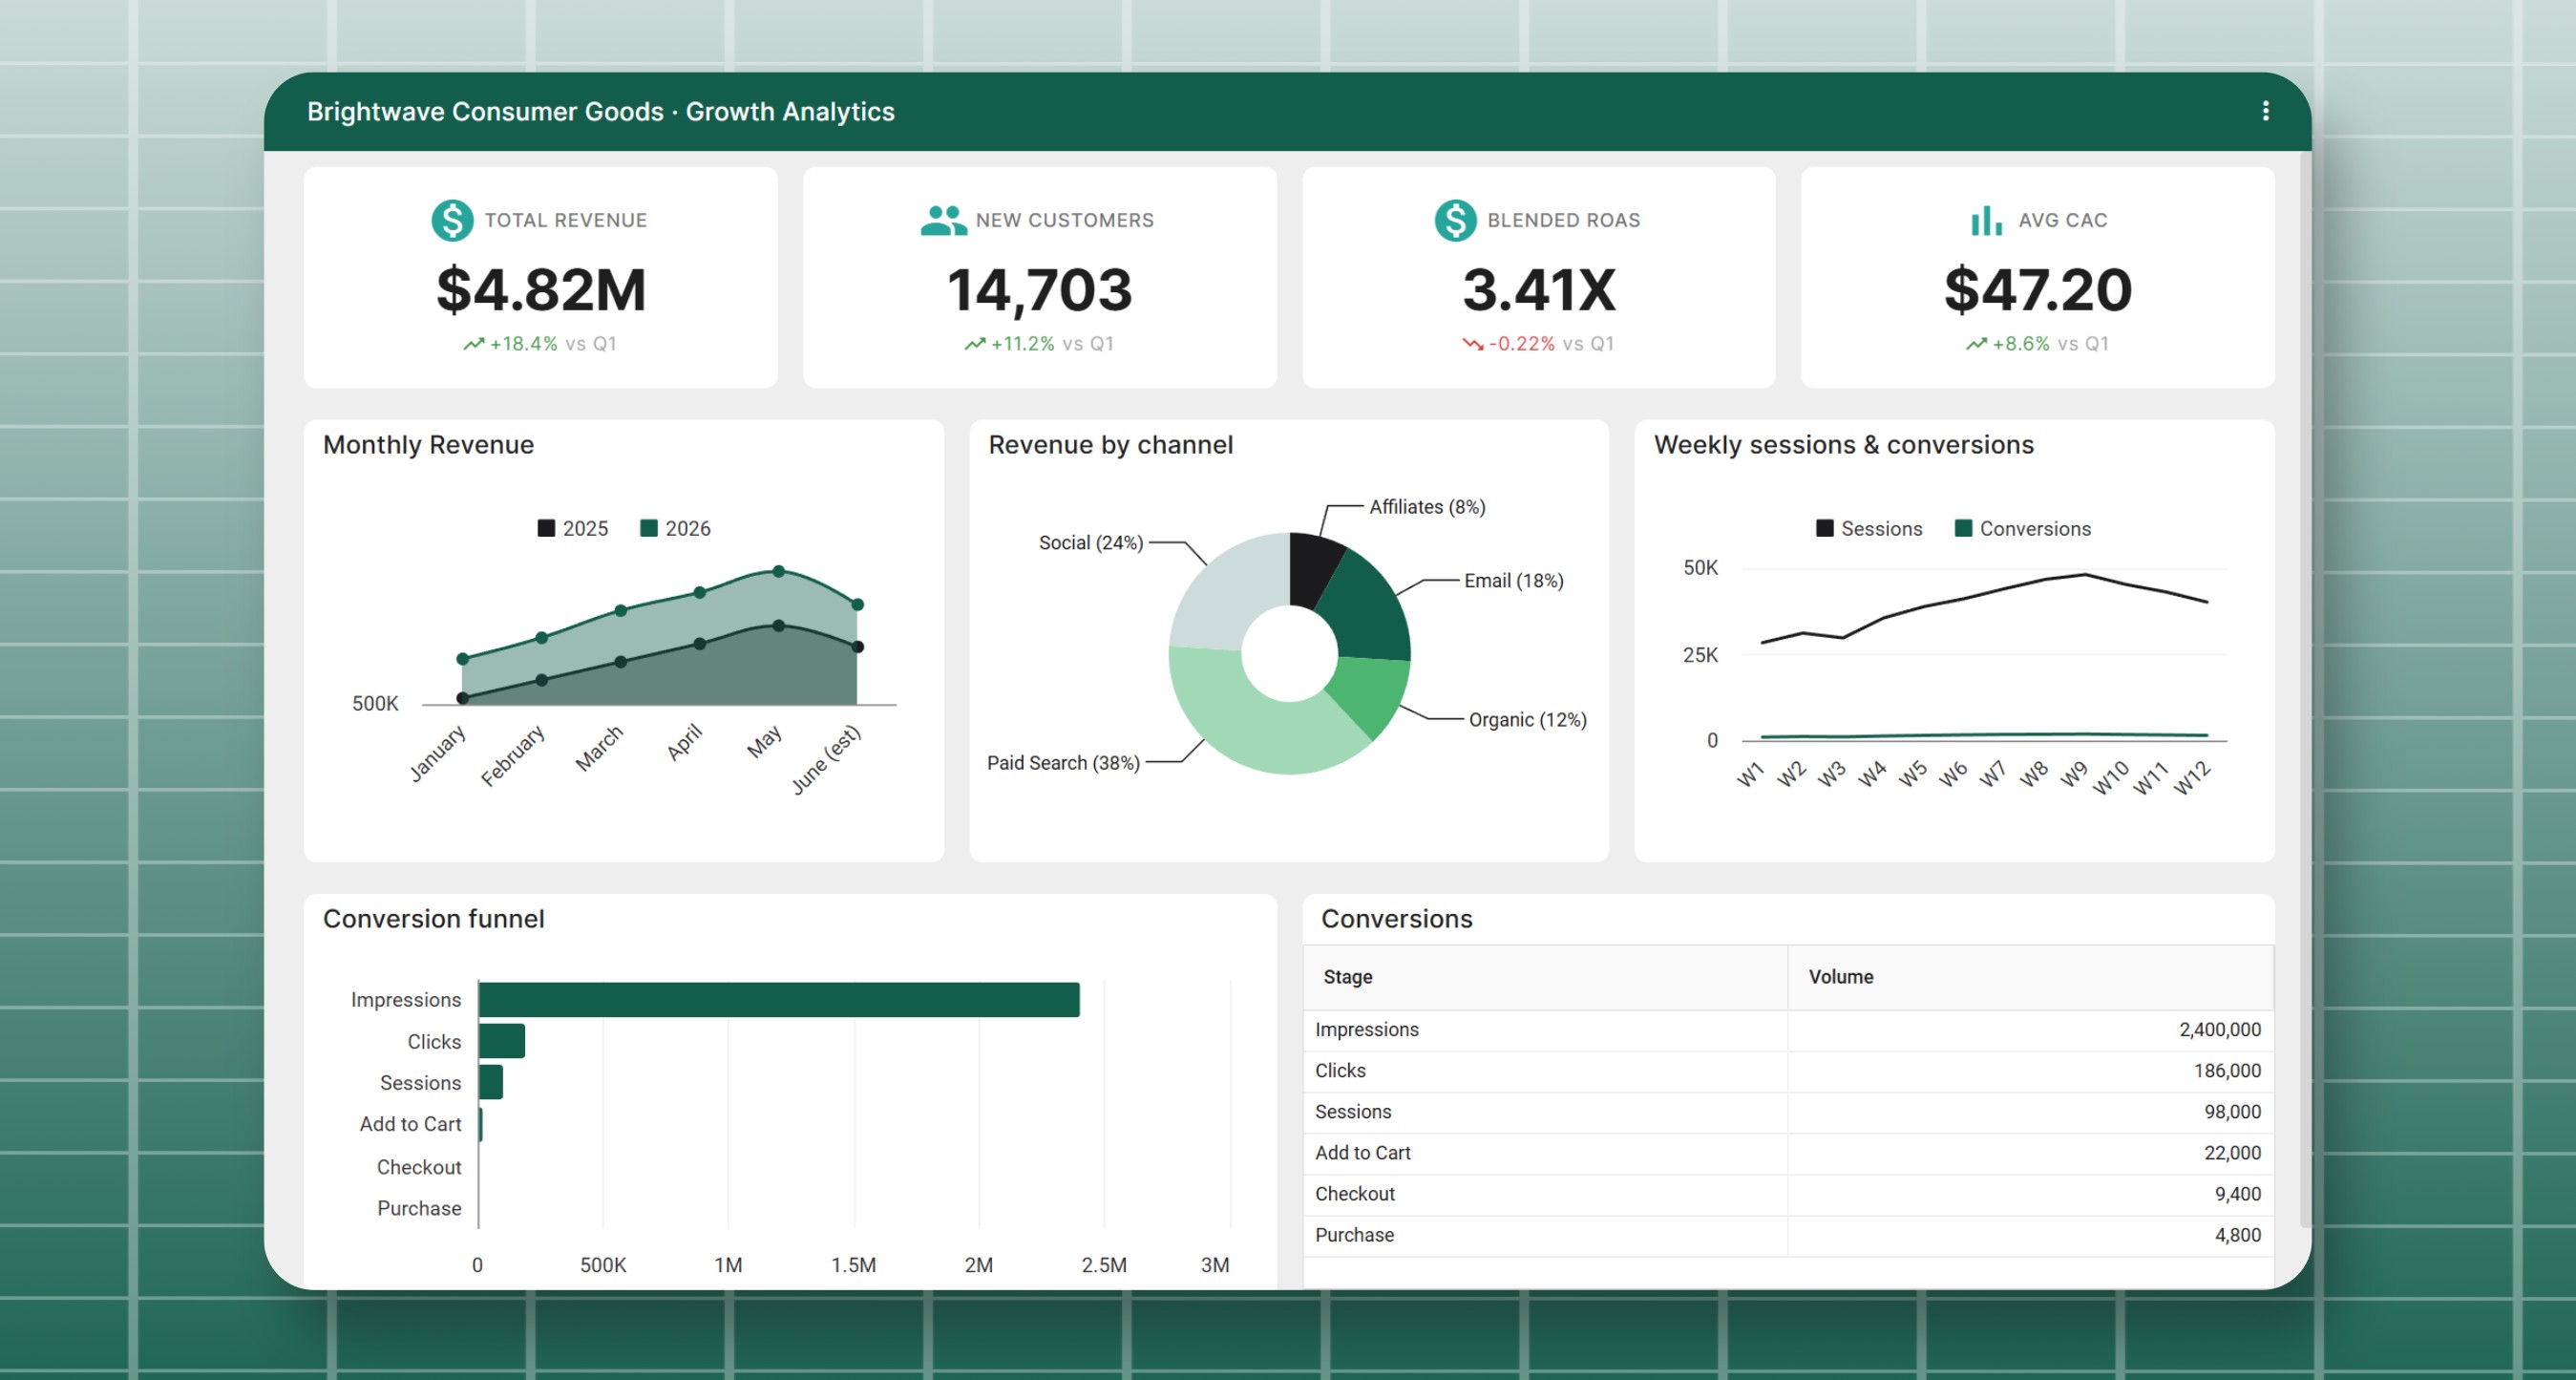
Dashboards are part of a workspace. They live alongside your sheets, can pull data from any sheet in the workspace, and are visible to your workspace members.
Creating a Dashboard
From your workspace, click New -> New Dashboard.
In the New Dashboard dialog:
- Enter a Dashboard Name
- Pick a Theme (ex: Minimal, Executive, Studio)
- Click Create
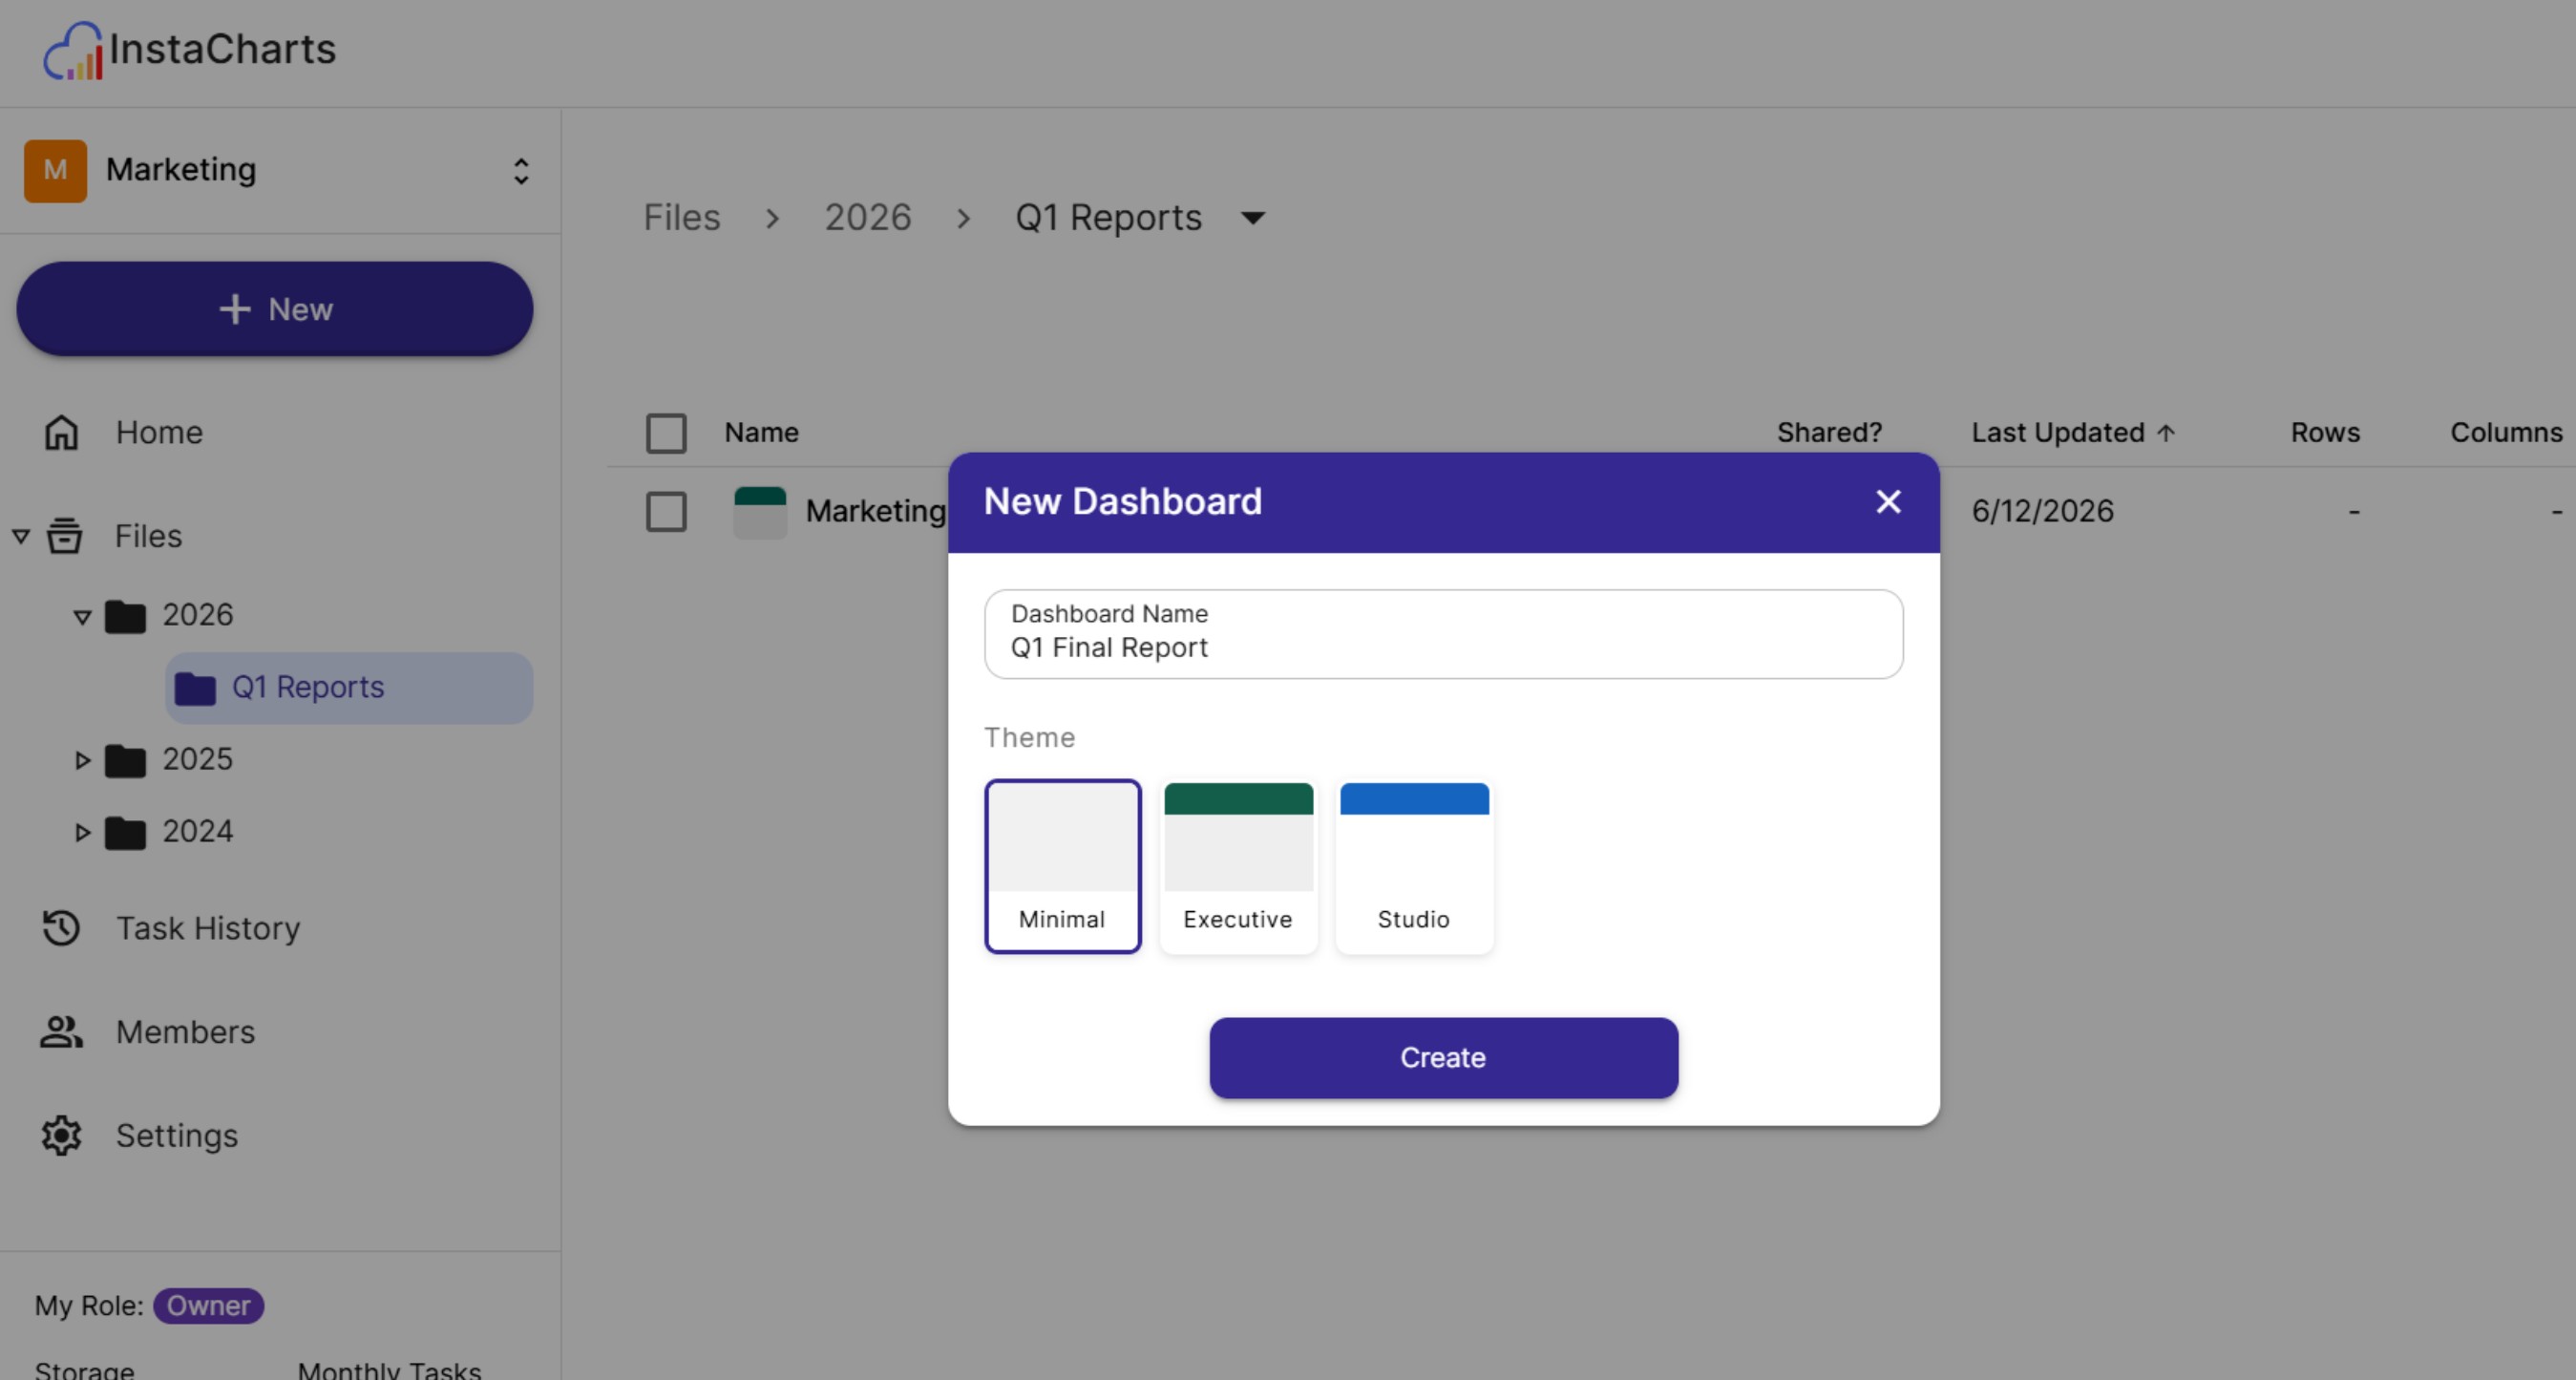
The new dashboard opens immediately, ready for sheets and widgets. Don’t worry about the theme choice; you can change it at any time from Dashboard Settings, and even restyle every widget in one click.
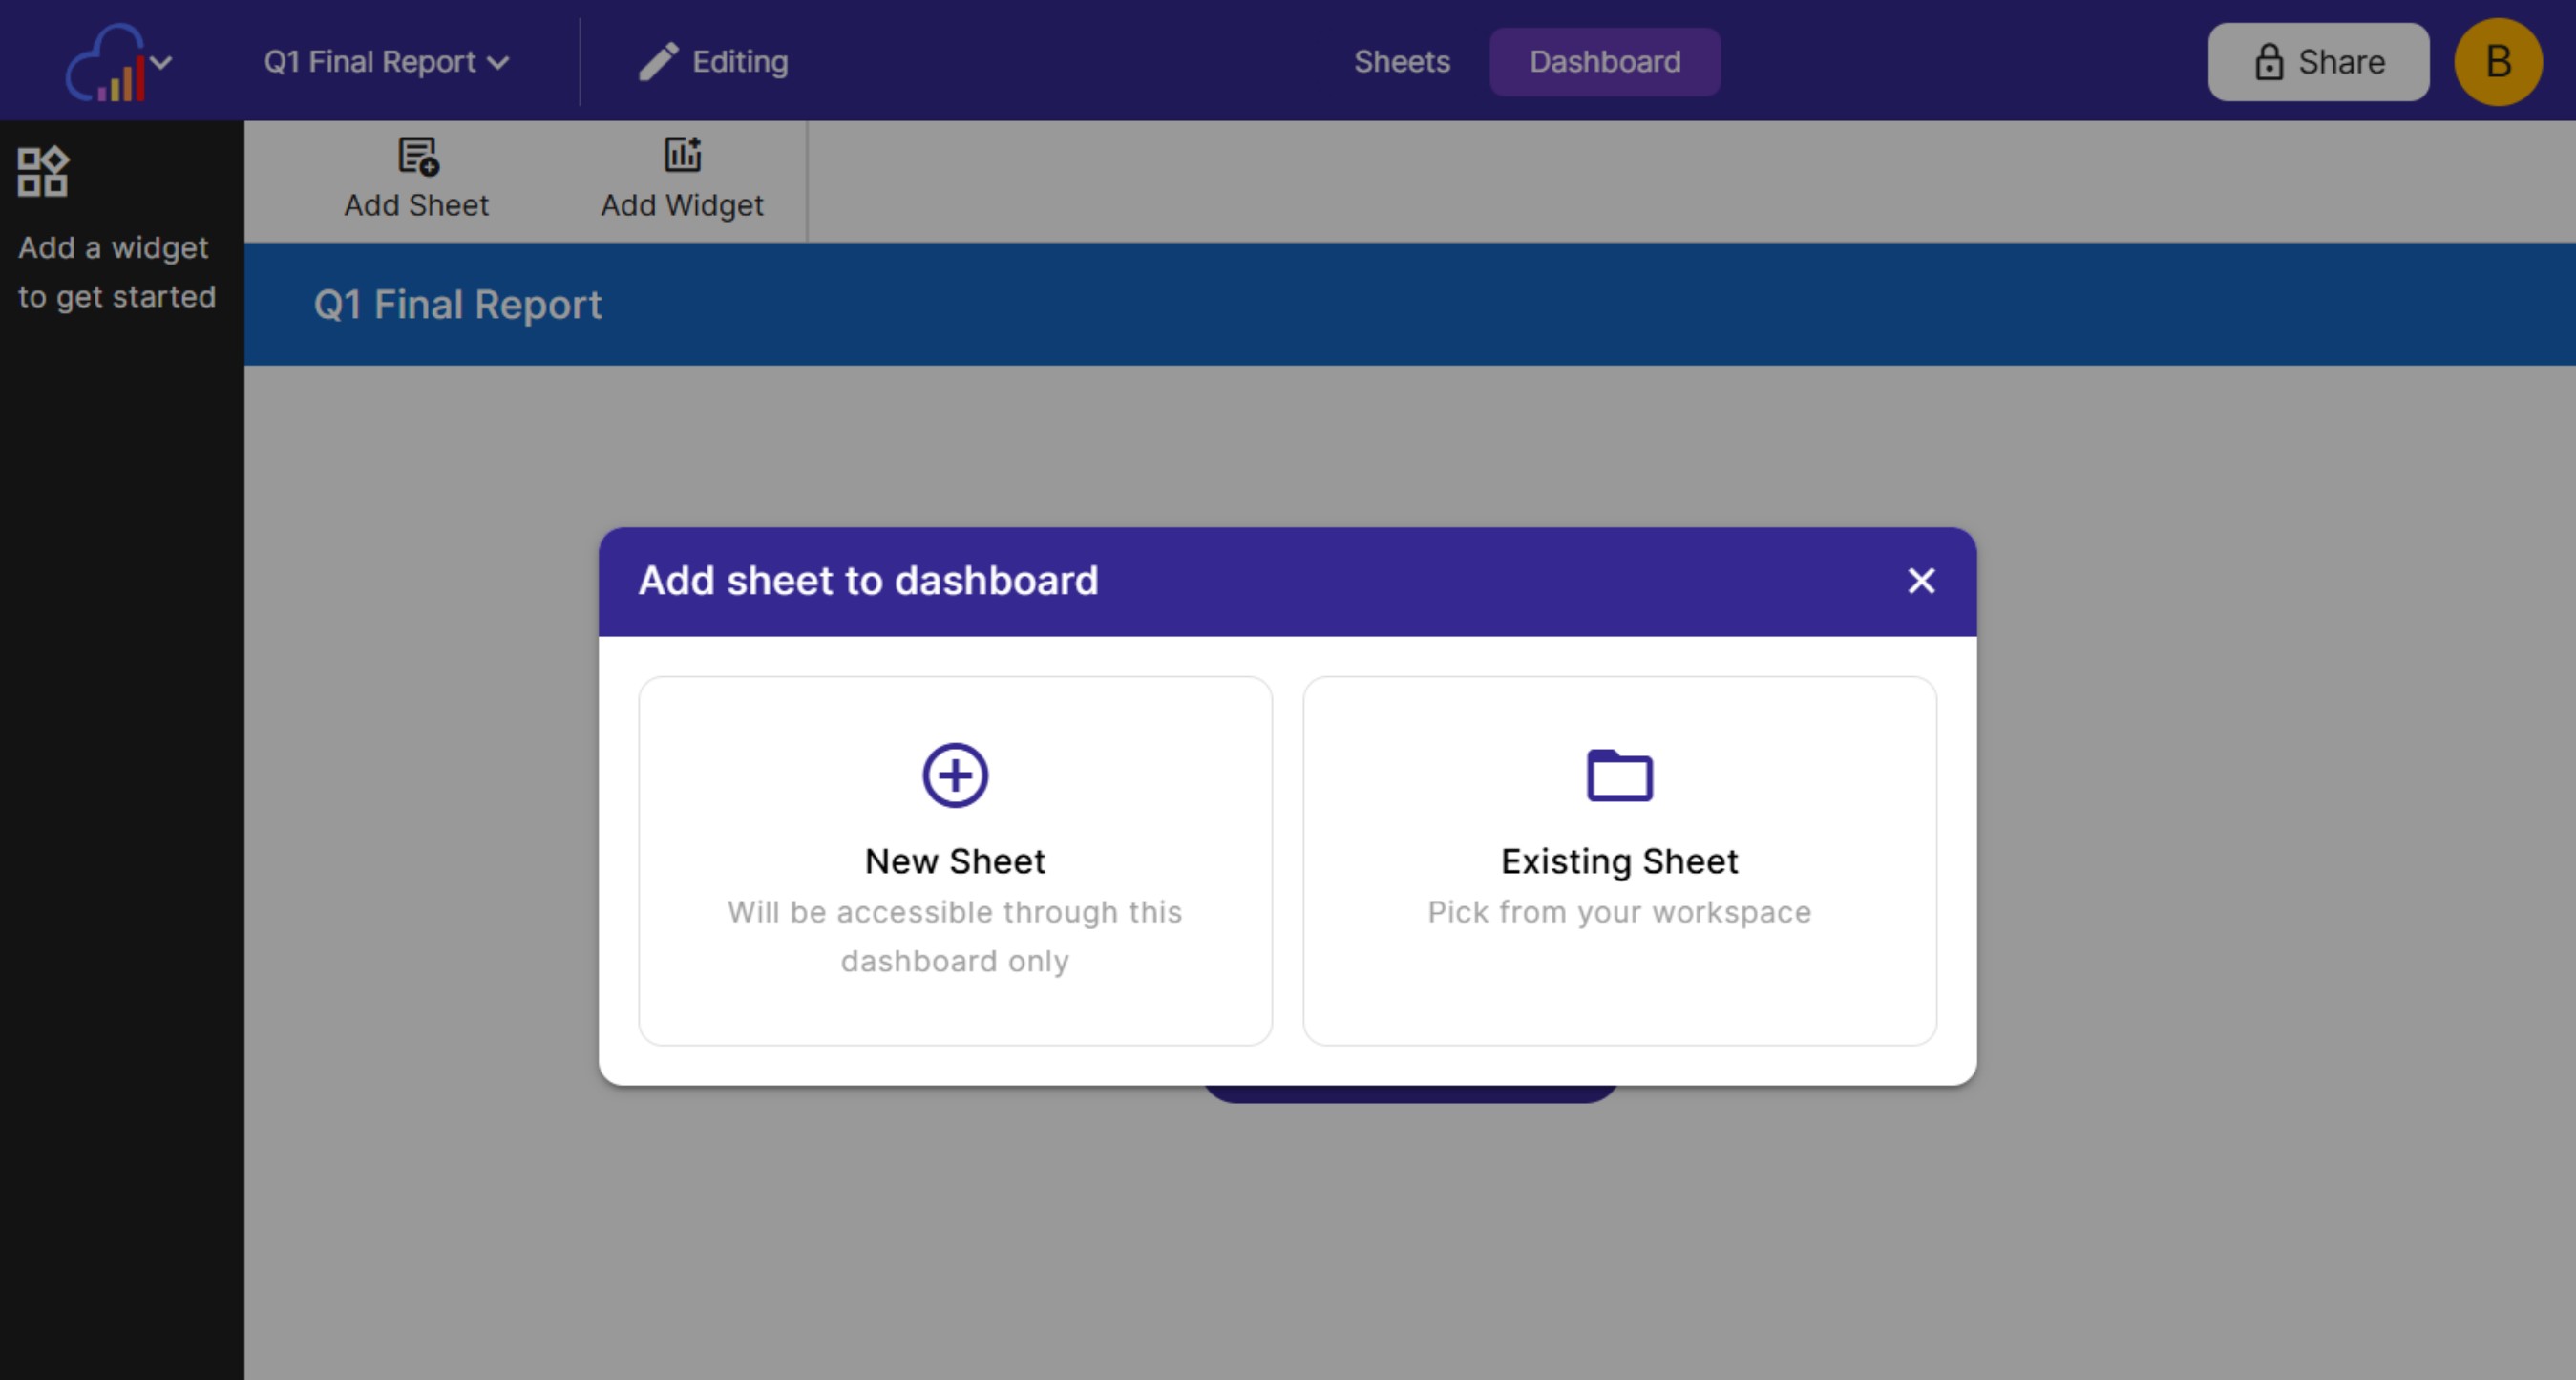
Adding Sheets to a Dashboard
Every chart and data table widget is backed by a sheet. When you add a sheet to a dashboard, you choose between:
- New Sheet - upload a new spreadsheet file. This sheet will be accessible through this dashboard only.
- Existing Sheet - pick any sheet from your workspace.
A dashboard can use multiple sheets. Each widget selects which sheet it reads from, so one dashboard can summarize several spreadsheets (ex: a sales sheet, an expenses sheet and an inventory sheet) without merging files.
Because widgets stay connected to their sheets, the dashboard always reflects the latest data. Sheets that sync with Google Sheets keep the dashboard current automatically.
Managing Dashboards
Dashboards are listed in your workspace next to your sheets. From the workspace you can open, rename, or delete a dashboard.
Next Steps
- Add widgets to build out your dashboard
- Adjust the theme and layout in Dashboard Settings
- Share your dashboard with a public link or embed it in a website