Embed Charts in a Website
Embedding lets you display a live InstaCharts chart directly inside your own website, blog, dashboard, or web app. The chart is loaded inside an iframe - no coding required on your end beyond pasting a snippet.
Embedded charts stay in sync with their source data. When you update the chart or sync new data in InstaCharts, the embedded version updates automatically.
To embed a chart, you must first share it. Make sure you are logged into your InstaCharts account - sign up here if you don’t have one yet.
Getting Your Embed Code
Open the Share & Templates dialog by clicking the Share button on the main toolbar (also accessible from the File menu).
From the left sidebar, select Share Chart. Set the share mode to Public, then look for the Embed in a webpage section.
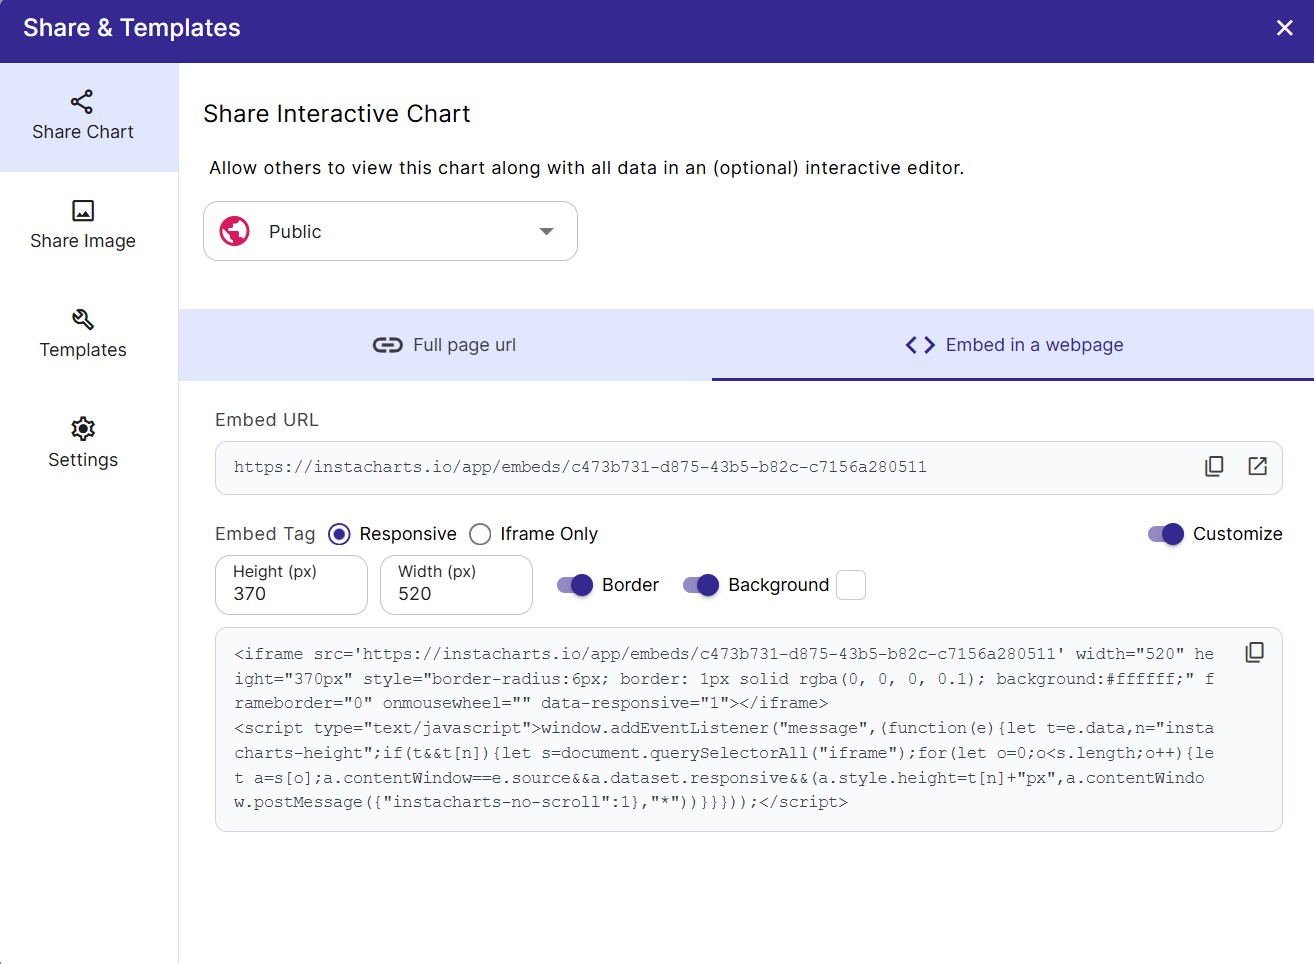
Two embed options are listed:
- Embed URL - a plain link you paste into tools that have their own embed block (ex: Notion, Wix)
- Embed Tag - a complete HTML
<iframe>tag you paste directly into HTML or a code block (ex: Webflow, WordPress, Ghost)
Copy whichever one your platform needs and paste it into your site.
What You Can Embed
Beyond the interactive chart, there are three things you can embed from the Share dialog:
| Item | Description | Share location |
|---|---|---|
| Interactive Chart | Live chart with hover tooltips and optional editor controls | Share Chart tab |
| Data Table | The full dataset or plotted data as a sortable table | Share Chart tab (enable Full Dataset or Plotted Data views) |
| Static Chart Image | An auto-updating PNG of the chart | Share Image tab |
To include a data table alongside the chart, open the Settings tab inside the Share dialog and check Full Dataset or Plotted Data under Included Views. When more than one view is enabled, a dropdown appears in the embed so viewers can switch between them.
The Embed Toolbar
By default, embedded charts include a toolbar along the bottom edge. You can control this from the Settings tab inside the Share dialog using the Show Embed Toolbar toggle.
The embed toolbar contains:
- A view picker dropdown to switch between Chart, Full Dataset, and Plotted Data views (only shown if more than one view is enabled)
- An Export button so viewers can download the chart image or data
- A View Larger button that opens the full interactive chart in a new tab
Sizing Your Embed
The embed tag InstaCharts generates includes a default width and height. You can change these values directly to fit your layout.
Fixed size example:
<iframe src="https://instacharts.io/app/embeds/YOUR_CHART_ID" width="800" height="500" frameborder="0"></iframe>Responsive example - choose a width, the height will be updated to fit the chart:
<iframe src="https://instacharts.io/app/embeds/YOUR_CHART_ID" width="500" height="500" frameborder="0" style="max-width:1200px;"></iframe>Embed in a Website Builder
Below is how to embed in popular platforms as of April 2026:
Webflow
Add a Code Embed element to your page, then paste in the Embed Tag.
WordPress
In the block editor, add a Custom HTML block and paste in the Embed Tag.
Wix
Add an HTML Embed element. Choose Website address and paste the Embed URL, or choose Code and paste the Embed Tag.
Squarespace
Add an Embed Block, select Code Snippet, then paste in the Embed Tag.
Bubble
Drag an HTML Element onto your page, then paste the Embed Tag into the HTML field under Appearance.
Ghost
Add a Raw HTML card to your post or page and paste in the Embed Tag.
Notion
Add an Embed block (type /embed) and paste in the Embed URL.
Shopify
Add a Custom Liquid section and paste the Embed Tag into the Liquid code area.
Medium and Substack
Neither platform supports third-party iFrame embeds by design. Instead, export your chart as a PNG or SVG and upload the image directly to your article.
Embedding a Static Chart Image
If you only need a chart image that auto-updates - without any interactive controls - use a shared image instead.
From the Share & Templates dialog, select Share Image from the left sidebar. Enable sharing and copy the embed tag or image URL.
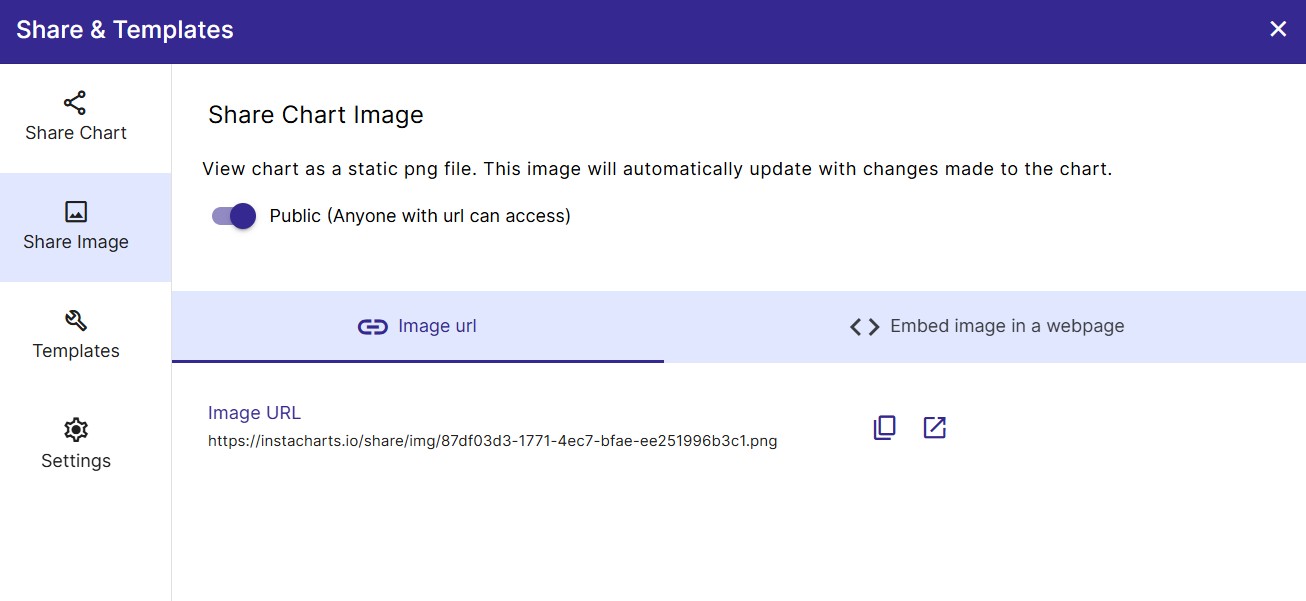
Shared images are PNG format and work anywhere a standard <img> tag or image URL is accepted, including email newsletters and platforms that block iframes.
Restrict Embedding to Specific Domains
By default, your embedded chart can be loaded on any website. If you want to prevent it from being copied and embedded elsewhere, use Domain Whitelisting under the Settings tab of the Share dialog (paid feature).
Enter each domain where the chart is allowed to display. You must use the exact domain or subdomain - wildcards are not supported.
| Input | Allows embedding on |
|---|---|
example.com | https://example.com/any-page |
blog.example.com | https://blog.example.com/any-page |
If someone tries to embed a whitelisted chart on a domain not in the list, the iframe will be blank.
Turn off Allow Top Level Loading to also block the embed URL from being opened directly in a browser address bar.
See Share Charts for full details on domain whitelisting.
Troubleshooting
The iframe is blank on my website. The most common cause is that the chart is not set to Public. Open the Share dialog and confirm the share mode is Public, not Private.
The chart shows but on the wrong domain. If you have domain whitelisting enabled, make sure the domain where the chart is embedded is in the whitelist exactly as it appears (no trailing slash, no path).
The chart looks too small or too large.
Edit the width and height attributes on the <iframe> tag directly. Use width="100%" for a fluid layout that fills its container.
The embed toolbar is not showing. In the Share dialog, open the Settings tab and make sure Show Embed Toolbar is toggled on.
I need to embed on Medium or Substack. Those platforms do not support iframes. Export the chart as a PNG and upload the image file instead.