AI Chart Recommendations
InstaCharts can analyze the columns in your sheet and recommend the best charts to build from your data. Each recommendation includes a suggested chart type, axis configuration, title, and description - so you can go from raw data to a meaningful chart in seconds.
Opening the AI Chart Recommendations Dialog
From within any sheet, click AI Charts in the left sidebar.
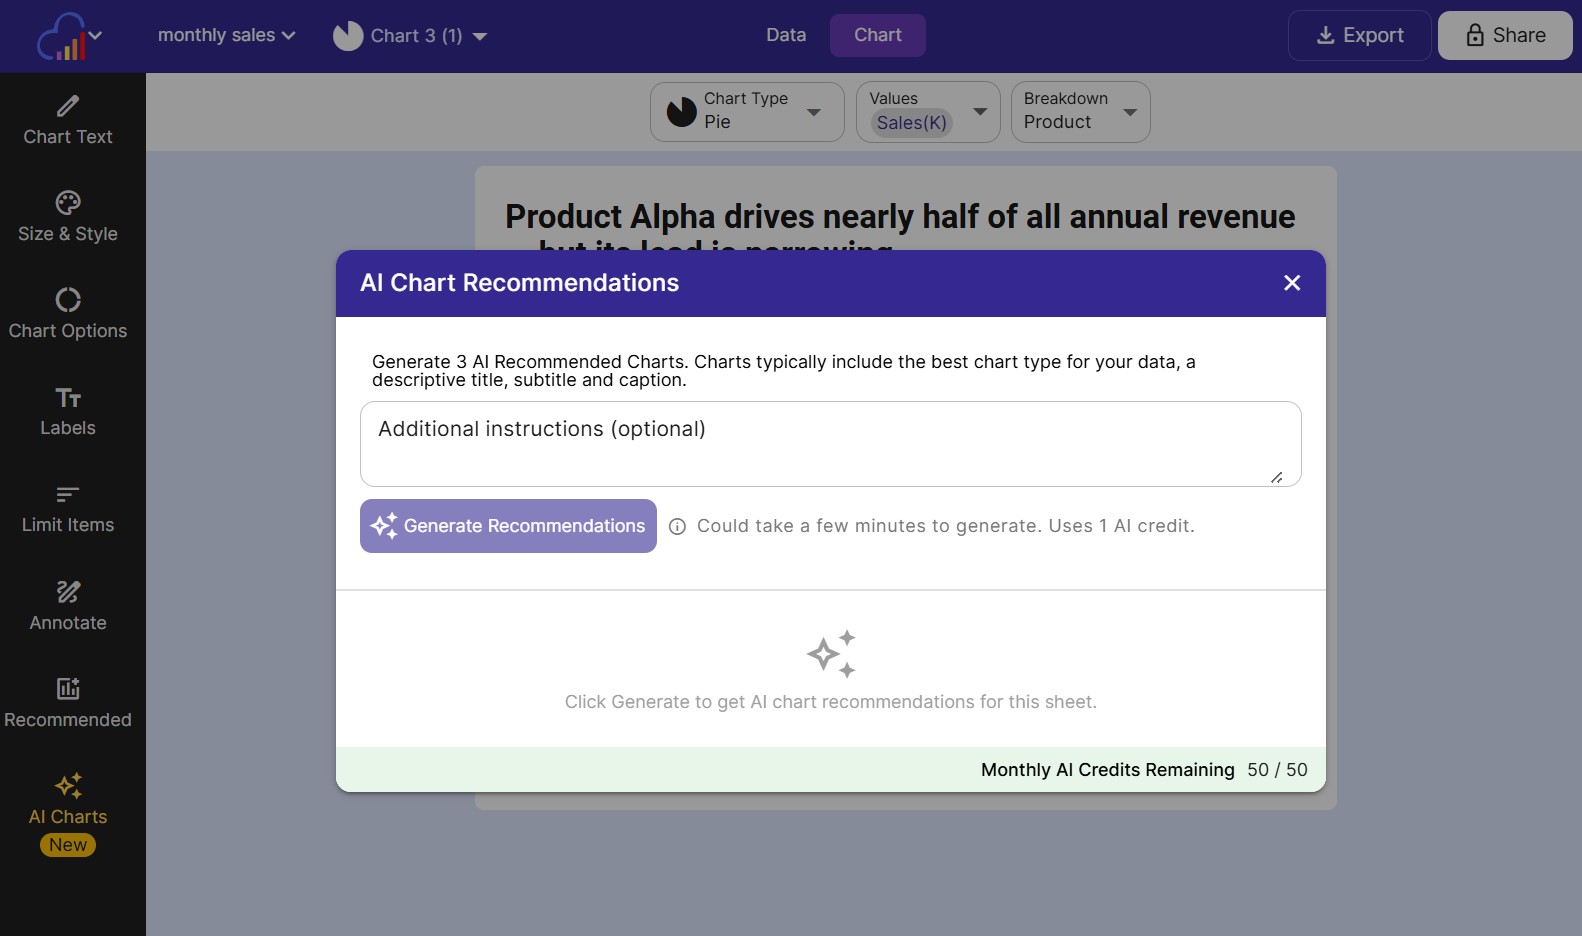
The AI Chart Recommendations dialog will open over your sheet.
Additional Instructions
Before generating, you can give the AI extra context about what you are trying to communicate. This is optional but can meaningfully improve the relevance of the recommendations.
Examples of useful instructions:
- “Focus on trends over time”
- “I want to compare revenue across product categories”
- “Highlight the relationship between budget and gross profit”
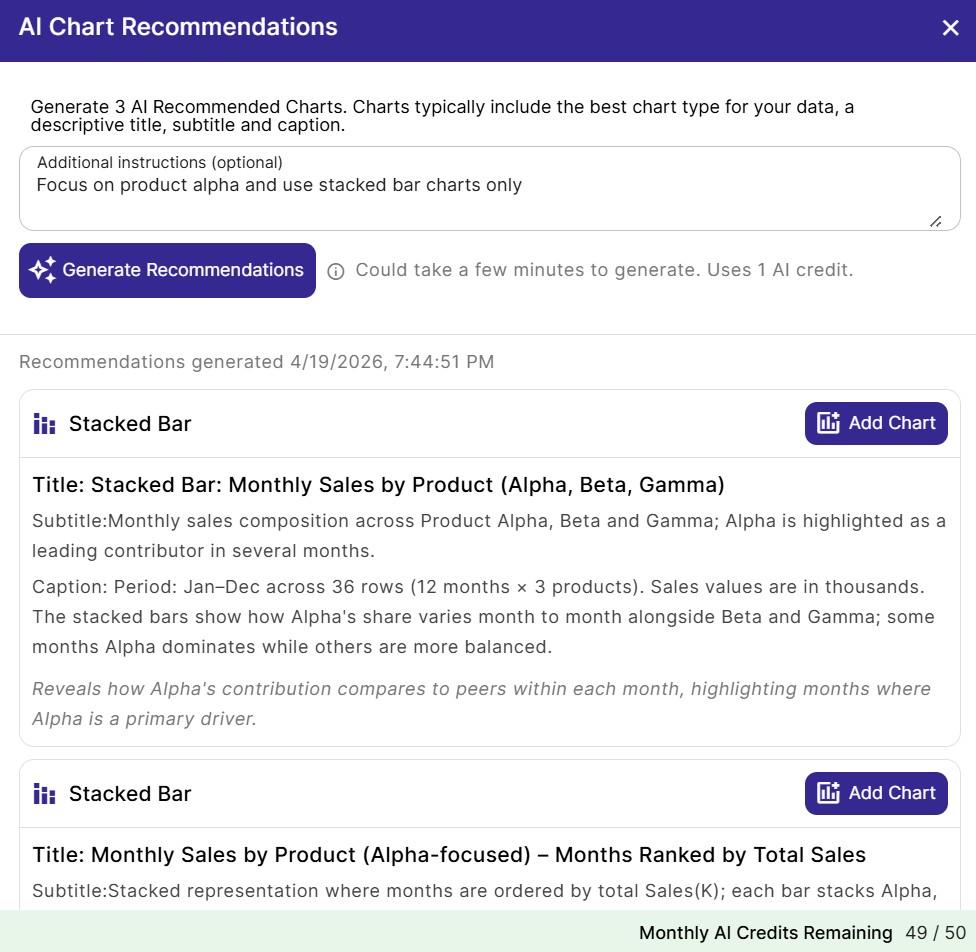
- “Only show me stacked bar charts”
Type your instructions into the Additional Instructions text box, then click Generate Recommendations.
Generating Recommendations
Click Generate Recommendations to send your data and any additional instructions to the AI. This will consume 1 AI credit.
The AI examines your sheet’s column names and data types to determine which chart types and axis combinations are most appropriate for your data.
Reading the Recommendations
Once generation is complete, the dialog displays 3 chart recommendations. Each recommendation includes:
- Title - a suggested chart title based on your data
- Subtitle - a short subtitle to complement the title
- Caption - a brief description of what the chart shows and why it is useful for your data
- Chart type - the recommended chart type (e.g., Line Chart, Bar Chart, Scatterplot)
- Axis configuration - which columns should be mapped to the X-axis, Y-axis, and breakdown axis
Adding a Chart from a Recommendation
Click Add Chart on any recommendation card to instantly create a new chart in your sheet using the suggested settings.
The new chart will appear as an additional chart in your sheet, pre-configured with the recommended chart type, axes, title, subtitle, and caption. You can then edit any of these settings as you would with any chart.
Related
- Chart Management - add, rename, and delete charts in a sheet
- Chart Text - edit the title, subtitle, and caption of a chart after it has been created
- Tasks - understand how AI credits and task quotas work