
Workspace Settings
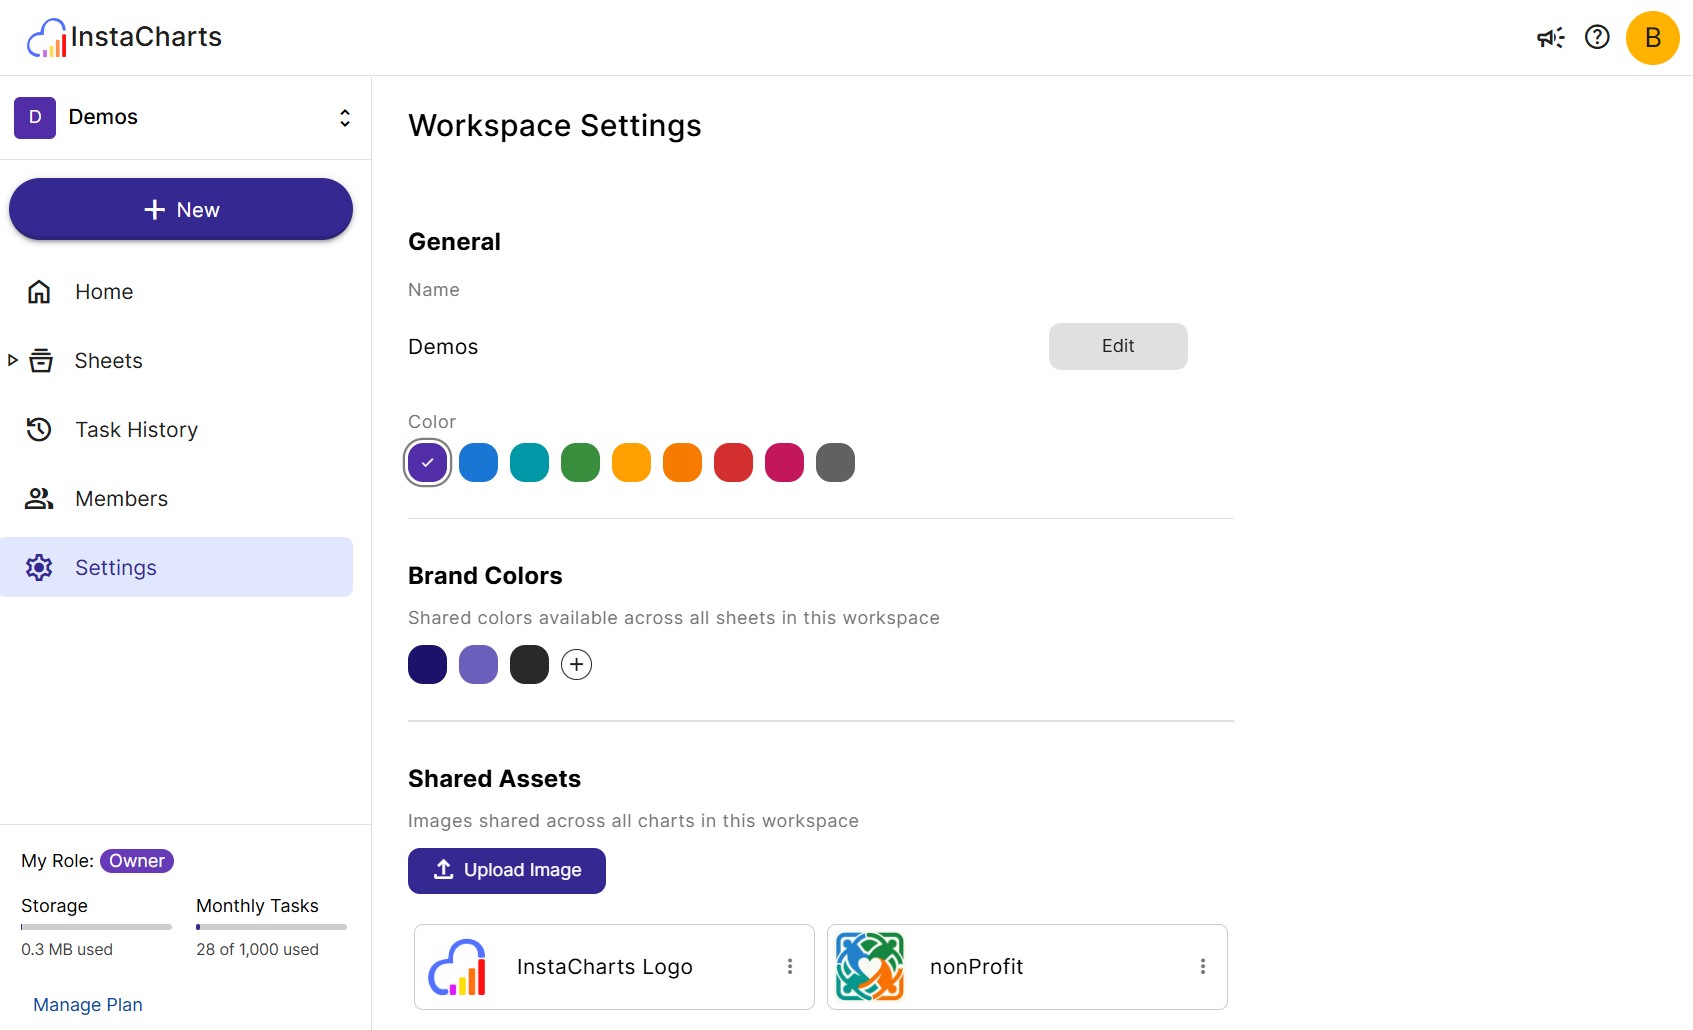
Workspace Settings is where owners and admins control the identity and shared resources of a workspace. From here you can rename the workspace, set its color, build a shared brand color palette for charts, upload images that all members can use, and permanently delete the workspace if it is no longer needed.
To open Workspace Settings, click Settings in the left sidebar of your workspace.
General
Workspace Name
Click Edit to change the workspace name.
Workspace Color
Select a color from the palette to set the color used to identify this workspace on the workspace selector. This is useful for telling workspaces apart at a glance when you have several.
Brand Colors
Brand Colors are a shared color palette available to everyone in the workspace when designing charts. Instead of entering hex codes manually, members can pick from the workspace palette when choosing chart colors.
To add a color, click Add Color and pick a color from the color picker dialog, then confirm. To remove a color, select it (a checkmark appears) and click Delete.
Shared Assets
Shared Assets are uploaded files - logos, icons, or other graphics - that all workspace members can use in their charts as image annotations. Uploads appear as a scrollable gallery with a thumbnail preview and the asset name.
To upload an image, click Upload Image and select a file from your device. Supported types are standard image formats (PNG, JPG, SVG, etc.).
To rename an asset, open its row menu and select Rename. To delete one, open the row menu and select Delete - you will be asked to confirm before the file is removed.
Chart Defaults
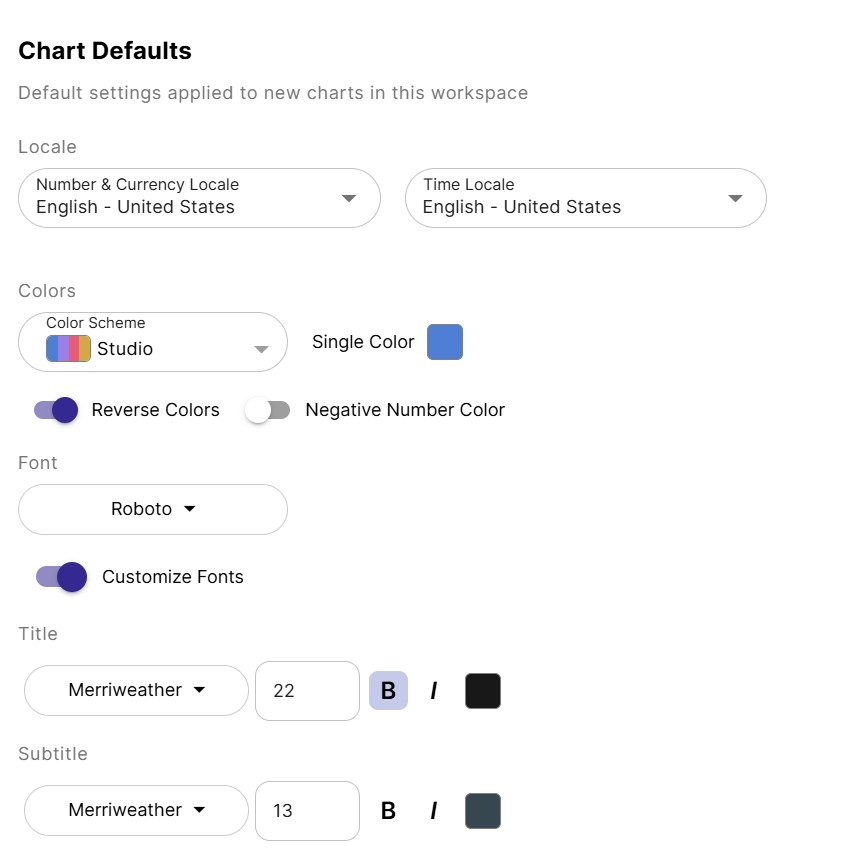
Chart Defaults control the starting look of new charts created in this workspace, so every chart begins on-brand without anyone having to style it by hand. Changing a default only affects charts created afterward - it does not restyle existing charts.
Theme
Pick a chart theme to use as the starting point for new charts. Picking a theme here immediately updates every other default on this page - colors, background, fonts, and grid & axis style - to match, the same way picking a theme on an individual chart does. You can still override any of those defaults afterward.
Locale
Set how numbers, currency, and dates are formatted in new charts. See Number Formatting for the full list of formats.
- Number & Currency Locale - controls digit grouping, decimal separators, and currency symbols, so
values render the way your audience expects (for example
1,000.50versus1.000,50). - Time Locale - controls how dates and times are formatted.
Colors
Set the default color styling applied to new charts.
- Color Scheme - the palette new charts use to color their data series.
- Single Color - the color used when a chart is shown in a single color.
- Background Color - the default chart background color. Leave it unset for a transparent background, so dashboards and embeds show their own background through the chart.
- Reverse Colors - reverses the order the scheme’s colors are applied in.
- Negative Number Color - when turned on, negative values are drawn in a separate color you choose, making drops and losses easy to spot at a glance.
Font
Set the default typography for new charts, using the same font options available on the Fonts card in a chart’s Size & Style panel, including the full Google Fonts library and custom Google Font URLs.
- Font - all text in new charts uses this font by default.
- Font Color - the default font color for all chart text. Leave it unset to use InstaCharts’ built-in colors.
- Customize Fonts - turn this on to style the chart Title, Subtitle, and Axis Titles independently. For each, you can set its own font, size, bold, italic, and color to make it stand out from the rest of the chart text.
Grid & Plot Style
Set the default plot style for new charts.
- Show Plot Border and Border Color - draw a border around the plot area in the chosen color.
- Border Width and Border Radius - the thickness and corner rounding of the plot border.
- Plot Lines Opacity - the opacity of the grid lines that connect to the Y-Axis.
- Plot Background Color - a background color that fills the plot area, behind the data. Leave it unset for a transparent plot background.
- Plot Shadow - adds a drop shadow under the plot area.
Axis Style
Set the default axis style for the X-Axis and Y-Axis of new charts.
- Show X-Axis / Show Y-Axis - turn the entire axis on or off.
- Tick Mark Opacity, Label Opacity, Axis Line Opacity, Title Opacity - each from 0-100; set to 0 to hide that element.
Text Annotation Style
Set the default appearance for new text annotations.
- Type and Text Color - the default connector line type and text color for new text annotations.
- Line Color, Connector End, End Color - the default connector line color and end style (None, Circle, or Arrow).
- Show Background, Background Color, Opacity - whether new text annotations start with a background, and its color and opacity.
- Label Font Size and Title Font Size - the default font sizes for a text annotation’s label and title.
Deleting a Workspace
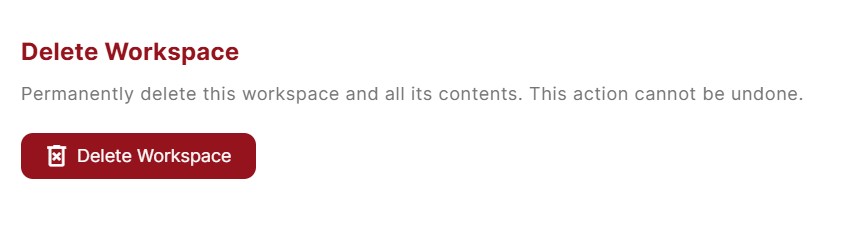
Scroll to the bottom of the settings page and click Delete Workspace. A confirmation dialog will show you how many sheets and charts will be permanently deleted along with the workspace. Click Delete to confirm.
Deleting a workspace removes all sheets, charts, shares, and uploaded assets inside it. Members are also removed, but their InstaCharts accounts are not affected.
Related
- Workspaces - switch between and manage your workspaces
- Workspace Members - invite teammates and set roles
- Size and Style - chart themes, color schemes, fonts and style these defaults feed into
- Text Annotations - the annotation style these defaults feed into
- Number Formatting - the formats behind your default locale