
Axes and Legend
The Axes & Legend panel holds the settings for a chart’s axes and legend. Open it from the Axes & Legend button in the left sidebar of the chart editor. The panel is split into five cards, listed here in the same order they appear in the panel:
- Axis Titles to show and rename the X-Axis and Y-Axis titles
- Legend to show, title and arrange the legend
- Axis Labels to set the axis type, rotation, spacing and width of the labels along each axis
- Numeric Axis Min & Max to set the smallest and largest values shown on each axis
- Number Formatting to choose how numbers are written on each numeric axis
Axis Titles
Axis titles are the names written along the X-Axis and Y-Axis. Pie charts and gauge charts have no axis titles, so this card is hidden for those chart types.
- Show Axis Titles Turn this toggle on to show the X-Axis and Y-Axis titles on the chart.
- X-Axis Title The text shown along the X-Axis. Keep Use Column Name checked to use the name of the column plotted on the X-Axis. Uncheck it to type your own title.
- Y-Axis Title The text shown along the Y-Axis. Keep Use Column Name checked to use the name of the column plotted on the Y-Axis. When the chart plots more than one series, the checkbox is labeled Auto and InstaCharts sets the title for you.
Legend
Charts that color their data by item, such as grouped charts and pie charts, draw a legend automatically. Chart types without a legend show the message “This chart type does not have a legend” in this card.
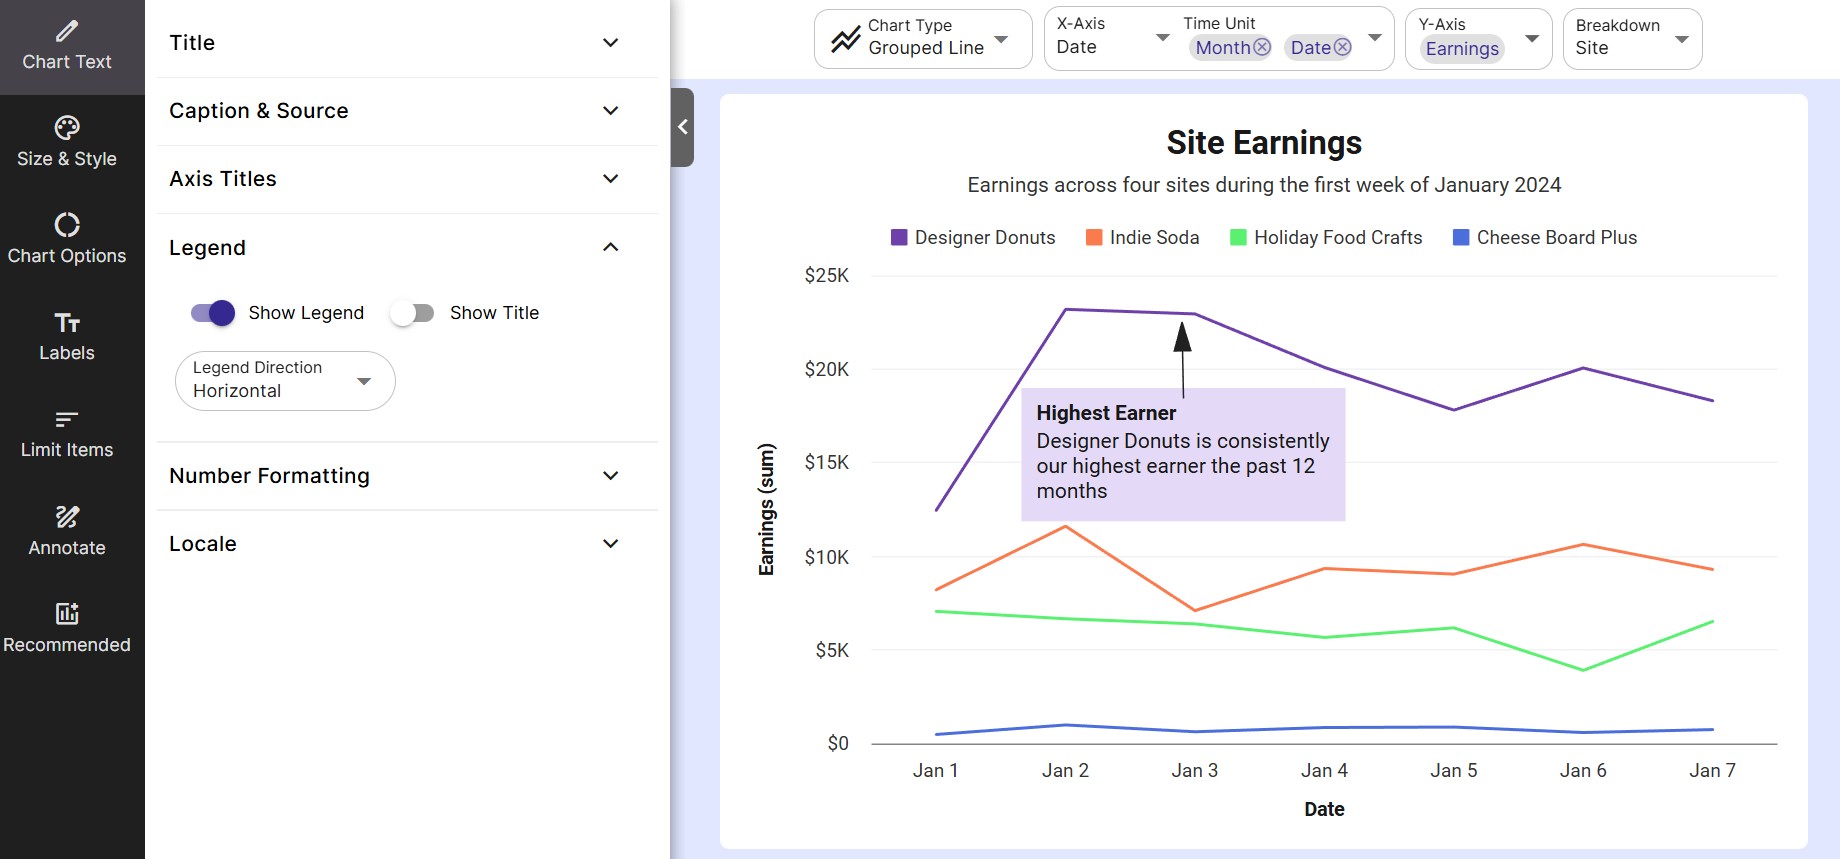
- Show Legend Turn this toggle on to show the legend.
- Show Title Turn this toggle on to show a title above the legend items.
- Legend Title The text used as the legend’s title. Keep Use Column Name checked to use the name of the column the legend describes, such as the Breakdown column, or the X-Axis column on a pie chart. Uncheck it to type your own title. When the chart plots more than one series, the checkbox is labeled Auto.
- Legend Direction Choose Horizontal to lay the legend items out in rows across the chart, or Vertical to place the legend in columns on the right side of the chart.
Horizontal Legend Options
- Item Distance How far apart the legend items sit from each other.
- Margin How far the legend sits from the plot area.
Vertical Legend Options
- # Columns The number of columns the legend items are split into.
- Auto Column Width Expands each legend column to fit the full text of its items. Turn this toggle off to set your own Column Width.
- Show Full Item Shows the full name of each legend item, wrapping long names onto more lines as needed. Turn this toggle off to set Max Item Lines. Names that need more lines than this end with ”…”.
Axis Labels
Axis labels are the values written along each axis, such as category names, dates or numbers. Pie charts and gauge charts have no axis labels, so this card shows “This chart type does not have axis labels” for those chart types.
The card has an X-Axis tab and a Y-Axis tab. On a horizontal bar chart the tabs follow the axes as they are drawn, so the X-Axis tab controls the labels along the bottom of the chart and the Y-Axis tab controls the labels up the side.
Axis Type
Choose how InstaCharts treats the values on the axis. Auto is selected by default and picks a type from the column type and the chart type.
| Axis Type | Description |
|---|---|
| Auto | InstaCharts picks the axis type based on the plotted column and the chart type. |
| Linear | A numeric scale where each step on the axis adds the same amount. |
| Logarithmic | A numeric scale where each step multiplies the value. Useful for data with a very wide range. |
| Date/Time | Spaces the labels out as dates and times. |
| Category | Places each value on the axis as its own label, in order. |
Align Labels
Choose Auto, Left or Right to align the labels. On the X-Axis this option appears on horizontal bar charts, where the X-Axis labels run up the side of the chart and often hold long category names.
Label Rotation
Rotate the X-Axis labels in the direction specified. Label rotation is available on the X-Axis tab and is disabled on chart types where it does not apply.
| Label Rotation Direction | Description |
|---|---|
| Auto | Based on the chart type, and the available space for chart labels, the software will pick a direction. |
| Horizontal | The label text will be written horizontally. Best used for labels with a short length. |
| Vertical | The label text will be written vertically. |
| 45 degree angle | The label text will be written at a 45 degree angle. Useful for very long labels. |
Label Interval
Label Interval controls how many labels a numeric axis shows, and appears when the axis plots numbers. Bar, radar, heatmap and Mekko charts use their own label spacing on the X-Axis, and heatmap and Mekko charts use their own spacing on the Y-Axis.
- Auto InstaCharts chooses how many labels to show.
- Number of Labels Enter how many labels the axis should show in # of Labels, from 2 to 100.
- Interval Enter the gap between each label in Interval. For example, an interval of 5 on a numeric axis shows labels at 0, 5, 10, 15 and so on.
Label Width
- Auto Width Lets each label take up as much room as it needs. Turn this toggle off to set the width yourself.
- Label Width The maximum width of each label on the axis, in pixels.
- Max Lines The maximum number of lines a long label can wrap onto. Labels that need more lines than this end with ”…”.
Numeric Axis Min & Max
Use this card to set the smallest and largest values shown on each axis. By default InstaCharts fits the axis to the plotted data. Setting your own values is helpful when you want several charts to share the same scale, or when you want an axis to start at 0.
- Use Default Values Turn this toggle off to enter your own min and max values. Turn it back on to clear your values and return every axis to its default range.
- X-Axis Min & Max The smallest and largest values plotted on the X-Axis. These boxes are available when the X-Axis column is numeric.
- Y-Axis Min & Max The smallest and largest values plotted on the Y-Axis. These boxes are disabled on heatmaps.
- Breakdown Min & Max The smallest and largest values plotted on the Breakdown axis. These boxes appear when the chart has a Breakdown set, and are available when the Breakdown column is numeric.
Leave a box blank to use the default for that end of the axis. Pie charts have no numeric axis, and gauge charts set their own range in Chart Options.
Number Formatting
Number formatting controls how the numbers on each numeric axis are written, such as with a currency symbol, as a percentage or abbreviated to 1.5M. The card appears for any chart with a numeric axis.
- Auto Format This toggle is on by default, and InstaCharts picks a format for each axis. Turn it off to choose a format for each numeric axis yourself.
- X-Axis, Y-Axis and Breakdown Format Choose a format from the dropdown for each numeric axis.
- Custom Format Choose Custom in a format dropdown to type your own format into the box beside it.
A full list of formats and examples of custom formats is on the Number Formatting page. To change how numbers are separated, such as 1,200.50 or 1.200,50, set the chart’s locale.
Related
- Number Formatting - every number format with examples
- Chart Text - titles, captions and locale
- Labels - series, data and total labels and tooltips
- Size and Style - axis line, tick mark and grid styling
- Chart Options - sorting and chart-specific settings