
Chart Management
Sometimes a dataset is better modeled by multiple different charts. Additional charts can be added to a Sheet in order to accommodate this. Each chart saves its own set of options and its own filters on the data. Different charts can filter the underlying dataset in different ways without affecting the other charts.
Charts are managed from three places:
- The Sheet Menu, the button with the sheet’s name in the main toolbar. It holds Add Chart, Duplicate Chart, Rename Active Chart and Delete Active Chart.
- The chart’s right-click menu. Right-click the chart to find Add Chart and Duplicate Chart.
- The Charts view of your workspace, covered in Manage Charts from the Workspace.
Add Chart
Add a new chart to your sheet with the Add Chart option in the Sheet Menu, or right-click the chart and choose Add Chart.
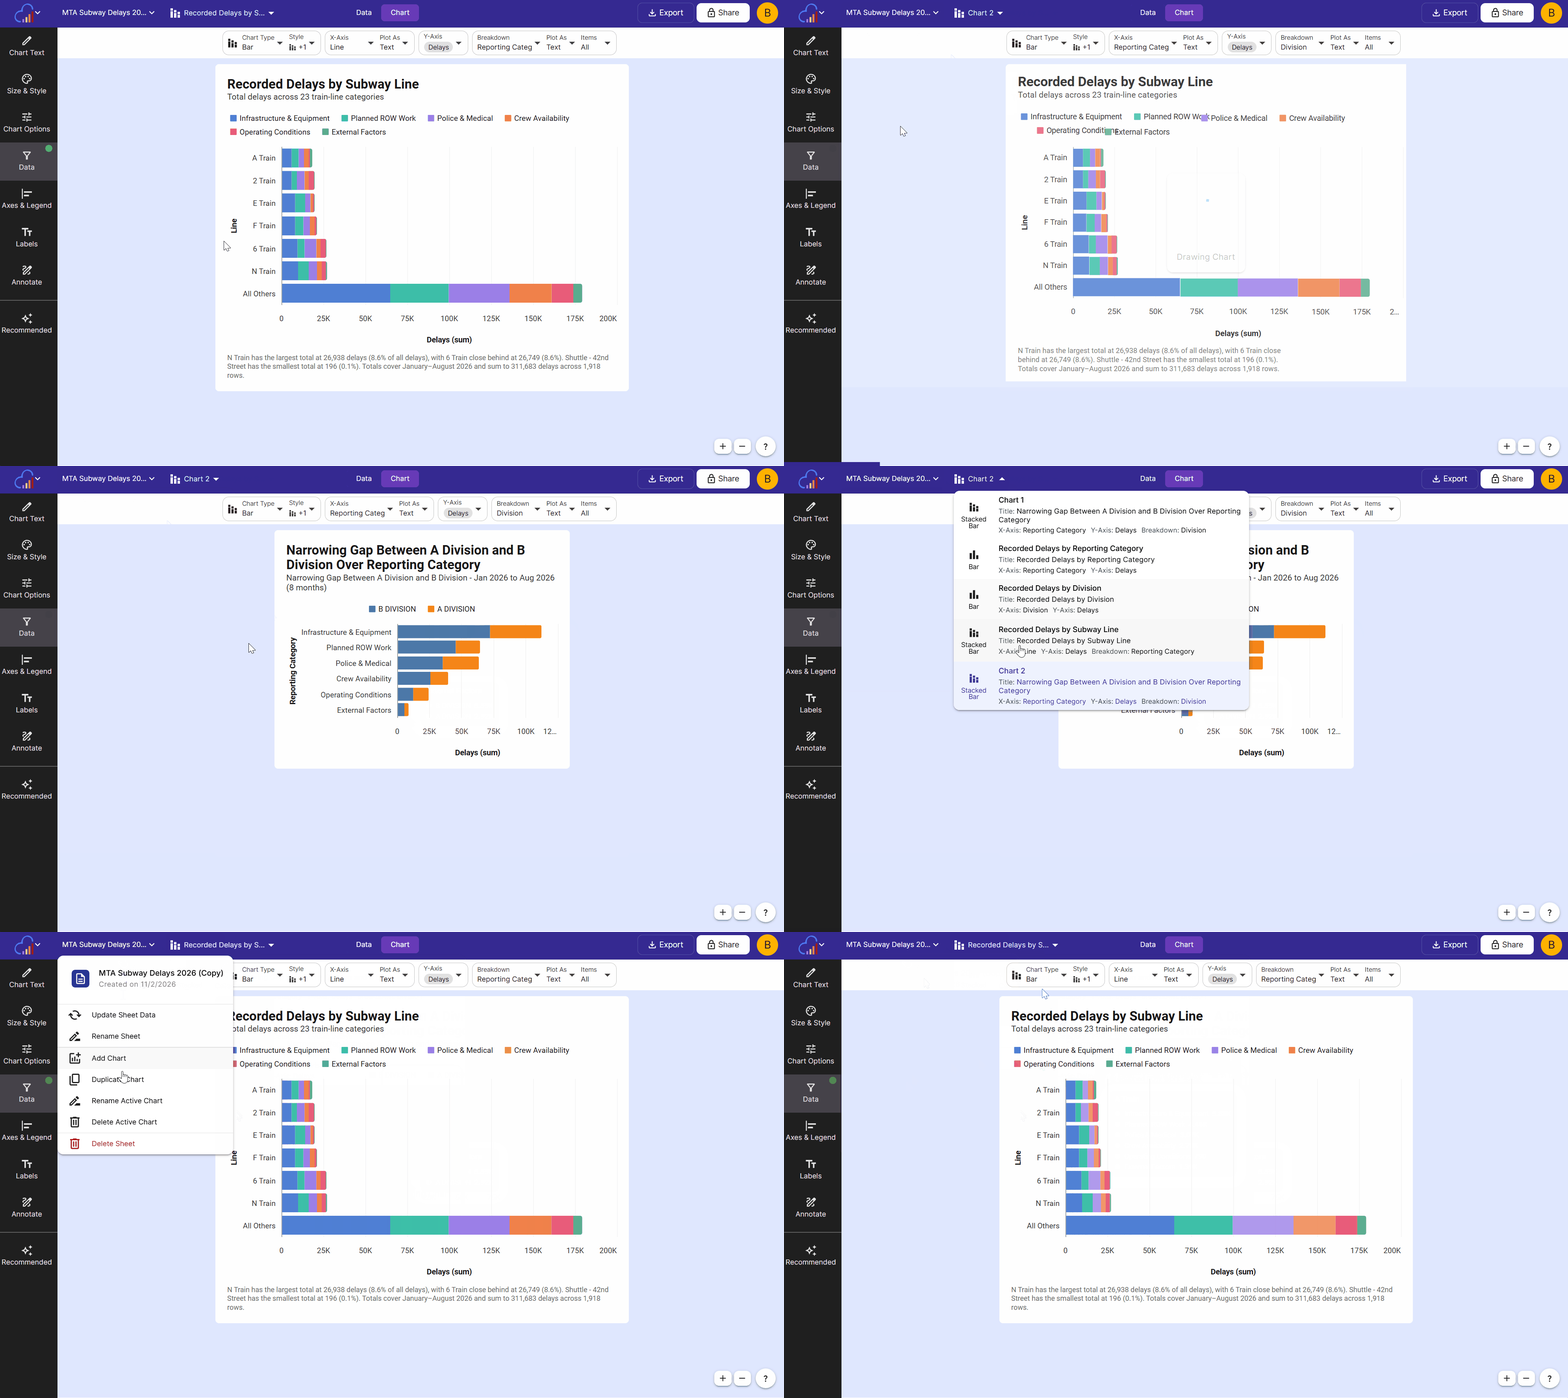
New charts are named in order, such as “Chart 2” and “Chart 3”, take their title from the sheet’s name, and start with your workspace’s chart defaults. Rename the chart once you know what it shows.
Duplicate Chart
To copy the current chart as a new chart, click Duplicate Chart in the Sheet Menu, or right-click the chart and choose Duplicate Chart.
The copy keeps every setting of the original chart, including its chart type, columns, styles, labels, filters and selected rows.
Duplicating is a quick way to try a different chart type or filter while keeping the original chart as it is.
Rename Chart
Rename the currently selected chart through the Rename Active Chart option in the Sheet Menu.
If a sheet contains many charts, renaming each chart is helpful for keeping track of them. The chart name is used in the chart select dropdown and in your workspace, and is separate from the title shown on the chart. Change the title in the Chart Text panel.
Select Active Chart
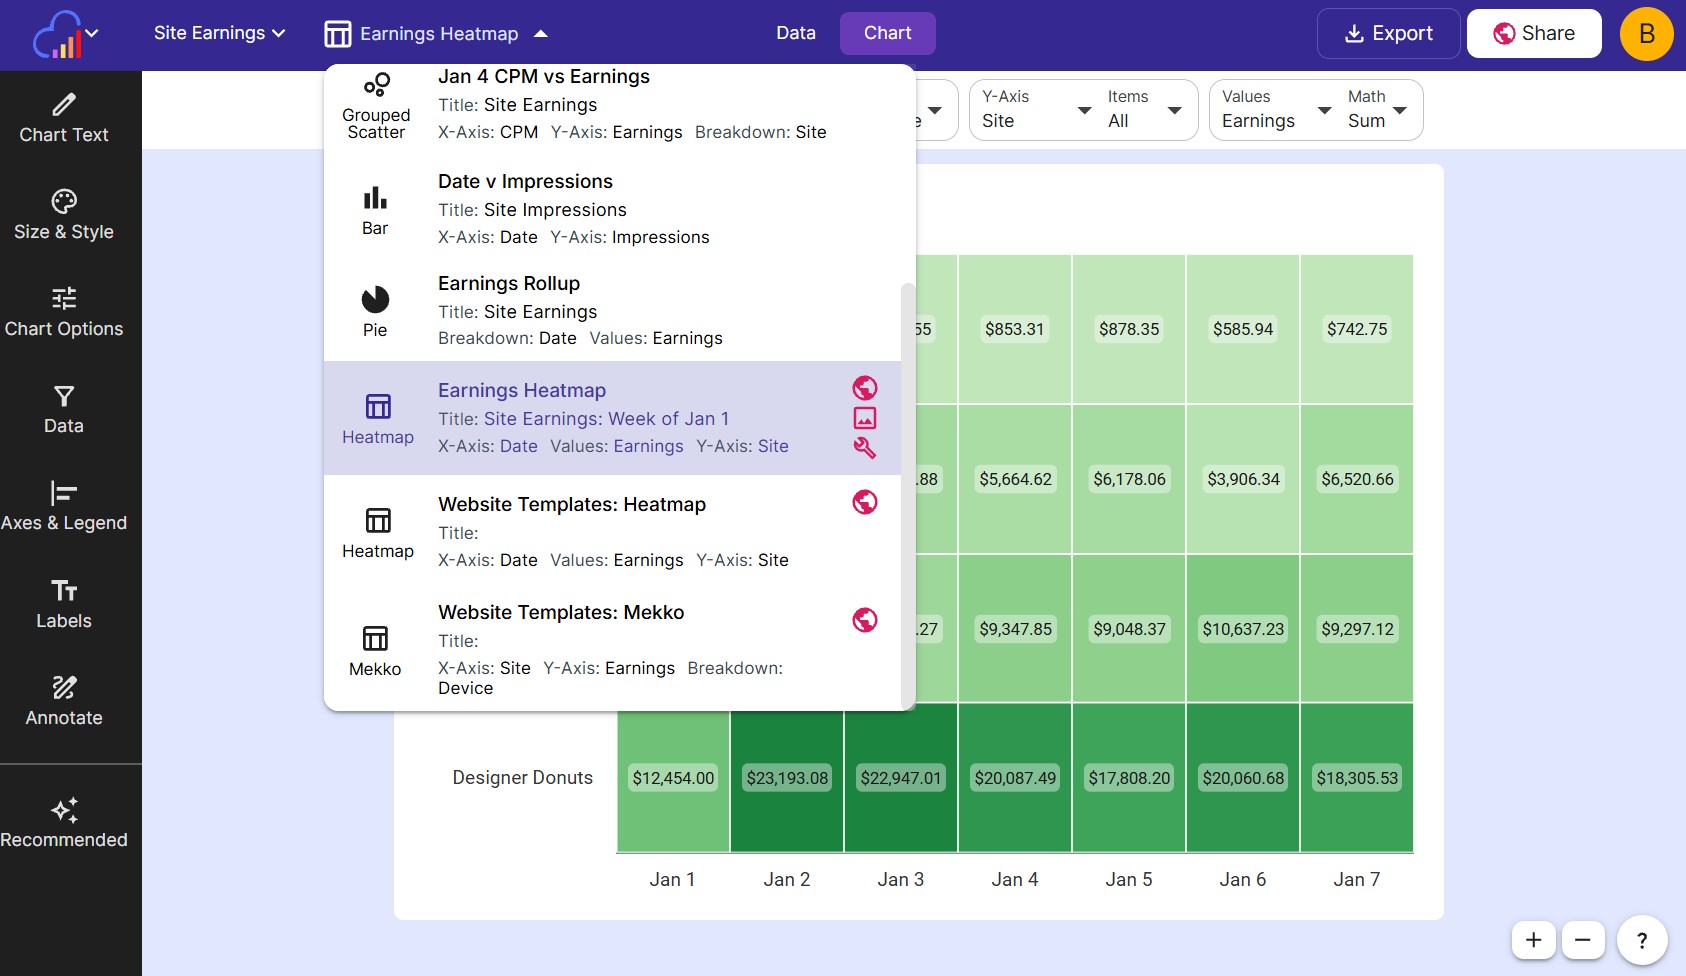
Use the chart select dropdown to choose the active chart shown in the sheet. Selecting a different chart changes both the Chart view and the Plotted Data view under Data.
The chart select dropdown is located in the main toolbar, to the right of the Sheet Menu. Each chart in the list shows:
- The chart type icon and chart type name
- The chart’s name and Title
- The columns plotted on the X-Axis, Y-Axis and Breakdown. When a chart plots more than one series, the Y-Axis shows the first series followed by “+2 more” (with the number of extra series).
- Share icons on the right for any chart that is shared. Hover over an icon to see what it means.
| Icon | Meaning |
|---|---|
| Globe | The chart is shared publicly as an interactive chart. |
| People | The chart is shared with other users as an interactive chart. |
| Image | The chart’s image is shared publicly. |
| Wrench | The chart’s template is enabled. |
Delete Chart
Delete the active chart through the Delete Active Chart option in the Sheet Menu. A confirmation dialog shows the chart’s name and title, along with any shares that will be removed, before the chart is deleted.
Share Charts
Each chart in a sheet is shared on its own, so one sheet can hold a public chart, a chart shared with a few coworkers, and a chart that stays private. Click the Share button on the main toolbar to open the Share & Templates dialog for the active chart. The dialog has a tab for each way to share, listed down its left side: Share Chart, Share Image, Templates, Settings and Analytics.
Viewers of a shared chart need no InstaCharts account. Charts that are shared show a share icon in the chart select dropdown.
| Way to share | What viewers get | Learn more |
|---|---|---|
| Full page interactive chart | A link to a full screen page where viewers hover over and explore the chart | Share Publicly |
| Share with specific users | The same interactive chart, open only to the email addresses you add | Share with Specific Users |
| Embedded chart | The interactive chart inside your own website, blog or app | Embed Charts in a Website |
| Shared chart image | A PNG image link that updates when the chart changes | Share Chart Image |
| Chart template | New charts made from this chart’s settings by changing the URL | Generate Charts with a Template |
| Exported file | A PNG, JPG, SVG, WebP, PDF or PowerPoint file you download and send yourself | Export Images |
Full Page Interactive Chart
Set the share mode to Public under Share Chart, then copy the full page URL and send it to anyone. Viewers can hover over data points and switch between views, and any changes they make to the chart are discarded when they leave. Set the share mode back to Private at any time to turn the link off. See Share Publicly.
Share with Specific Users
Set the share mode to Share with specific users and add the email addresses of the people who should see the chart. You can send each person an email with the link, and remove their access later. This is a paid feature. See Share with Specific Users.
Embed in a Website
Every shared chart also has an Embed Url and an Embed Tag for placing the chart inside a webpage, Notion page or website builder. Embeds can show a toolbar for switching views and exporting, and can be limited to your own domains. See Embed Charts in a Website and Restrict Embedding to Specific Domains.
Share Images
The Share Image tab shares the chart as a PNG image with its own link and embed code. The image updates automatically when you change the chart, which makes it a good fit for emails, slide decks and sites that only accept images. See Share Chart Image.
Share Templates
The Templates tab turns the chart into a template. Change the URL parameters to send in new data, columns or styles, and InstaCharts draws a new chart from the template’s settings. Templates are useful for making the same chart for many clients or from another app. See Generate Charts with a Template and Chart Templates.
Share Settings
The Settings tab controls what viewers see once a chart is shared:
- Included views Choose any of Chart, Full Dataset and Plotted Data. Viewers switch between them from a dropdown. See Included Views.
- Show Editor Controls Lets viewers of the full page chart change the chart type, axes and other settings to explore the data. Their changes are discarded when they leave. See Show Editor Controls.
- Page title, chart sizing and page theme Set how the full page chart looks. See Share Settings.
- Show Embed Toolbar Shows the toolbar along the bottom of embedded charts. See Show Embed Toolbar.
Share Analytics
The Analytics tab shows how many people view the chart as a full page share and as an embed, and which pages embed it. This is a paid feature. See Share Analytics.
Other Ways to Share
- Dashboards Add the sheet to a dashboard and build chart widgets from it to share several charts, KPIs and tables on one page.
- Workspace members Everyone in the workspace can open the sheet and its charts. Add teammates from Workspace Members.
Manage Charts from the Workspace
Every chart in a workspace can also be managed without opening its sheet. On the workspace Home page, open the file type dropdown above the table and choose Charts. The table lists each chart with its name, title and the sheet it belongs to.
Right-click a chart, or click its three-dot menu, to choose from:
- Open in new tab Opens the chart’s sheet in a new browser tab.
- Rename Renames the chart.
- Delete Deletes the chart after a confirmation.
To delete several charts at once, check the box beside each chart. A selection toolbar appears above the table with a Delete button, and the confirmation dialog shows how many charts will be deleted.
Related
- Sheets Overview - how sheets and charts fit together
- AI Chart Recommendations - add suggested charts to a sheet
- Filtering - give each chart its own filters and selected rows
- Share Charts - every way to share a chart as a link, embed, image or template
- Workspace - find sheets and charts in your workspace