
Share Charts
InstaCharts charts can be shared as a full page interactive chart, embedded in a website, shared as an image, or turned into a template that creates new charts from a URL. Viewers need no InstaCharts account to see a public share. This page covers every option in the Share & Templates dialog.
For a short walkthrough of sharing your first chart, see the Share a Chart guide.
Share & Templates Dialog
To open the Share & Templates dialog, click the Share button on the main toolbar. The Share dialog is also accessible through the File Menu. Each chart is shared on its own, so the dialog always applies to the active chart.
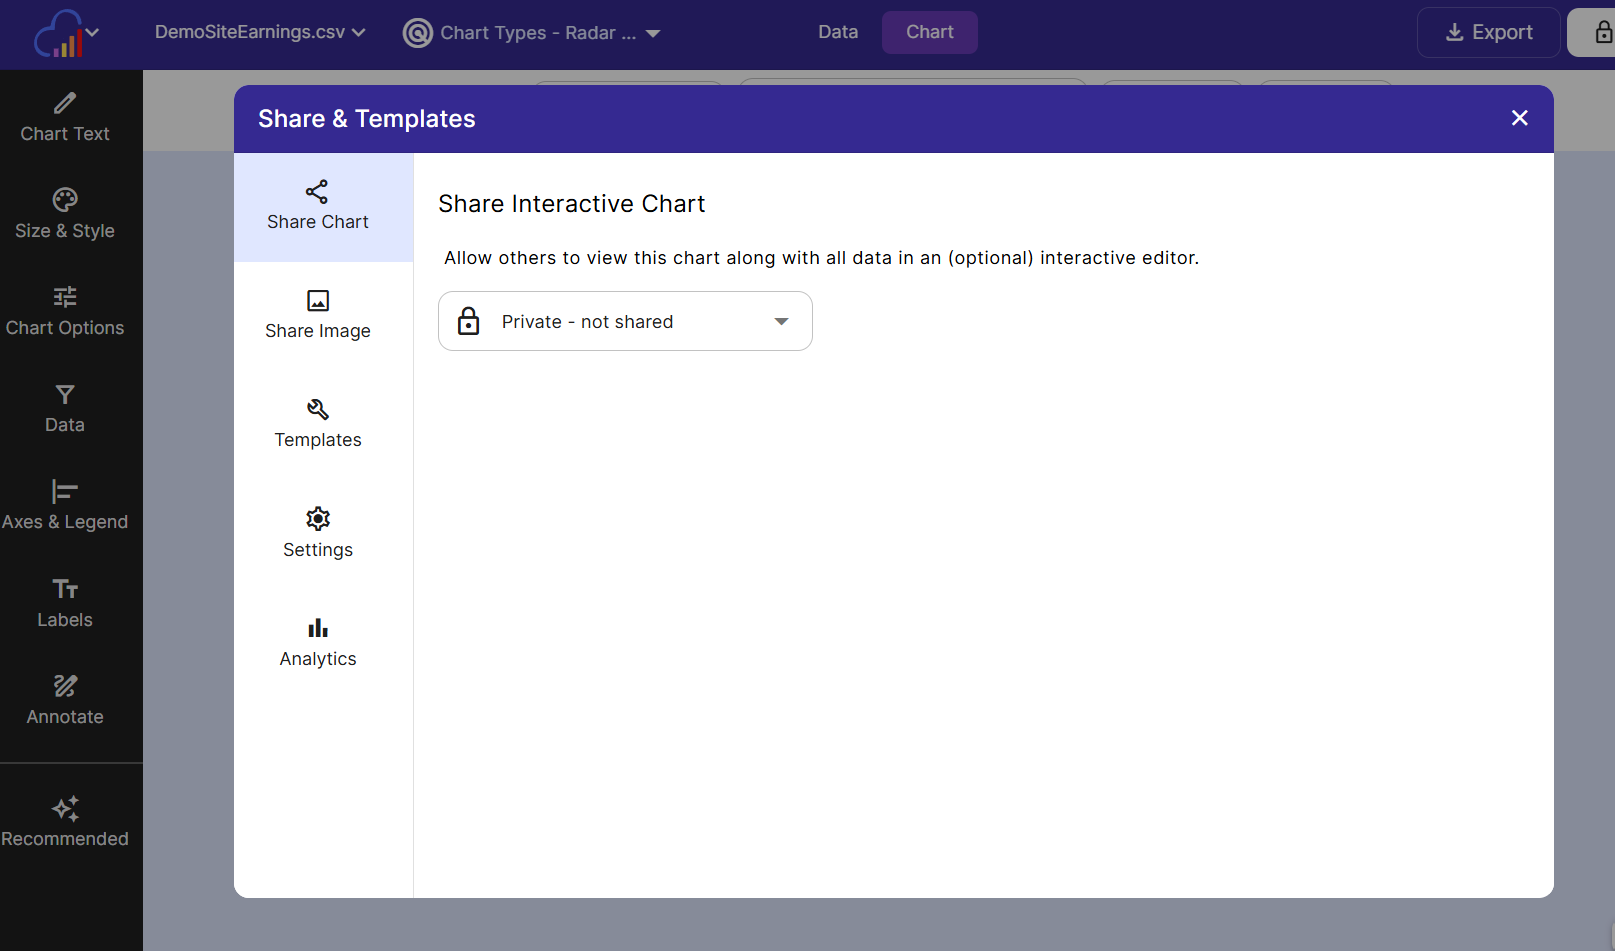
The left side of the dialog has five tabs:
| Tab | What it does |
|---|---|
| Share Chart | Share the interactive chart publicly or with specific users, and get its link and embed code |
| Share Image | Share a PNG image of the chart that updates when the chart changes |
| Templates | Turn the chart into a template that creates new charts from URL parameters |
| Settings | Choose the views, page title, sizing, theme, embed toolbar and allowed domains |
| Analytics | See how many people view the chart and which pages embed it |
Share Interactive Chart
On the left side menu of the Share dialog, make sure Share Chart is selected. A shared interactive chart lets viewers hover over data points, switch between views, and, when turned on, explore the data with the editor controls.
Share Mode
There are three share modes in the share type dropdown:
| Share mode | Who can view | Plan |
|---|---|---|
| Private - not shared | Members of your workspace, from inside InstaCharts | All plans |
| Share with specific users | Only the people you add by email | Paid plans |
| Public | Anyone with the link | All plans |
Once a chart is shared, the Full page url and Embed in a webpage tabs appear below the share mode.
Share Publicly
To share your chart, change the share mode to Public. Anyone with the URL will be able to view your interactive chart (no account needed).
If you no longer wish to share this chart, set it to Private. The link stops working right away.
Share with Specific Users
This is a paid feature. Free workspaces see an Upgrade Plan to share privately link next to the dropdown.
To share your chart with specific people, change the share mode to Share with specific users.
- Click Add User.
- Leave Send Email checked to email each person a link to the chart, or uncheck it to add them quietly.
- Type an email address into Add email addresses, then press Enter or click the plus button. People you have shared with before are suggested as you type.
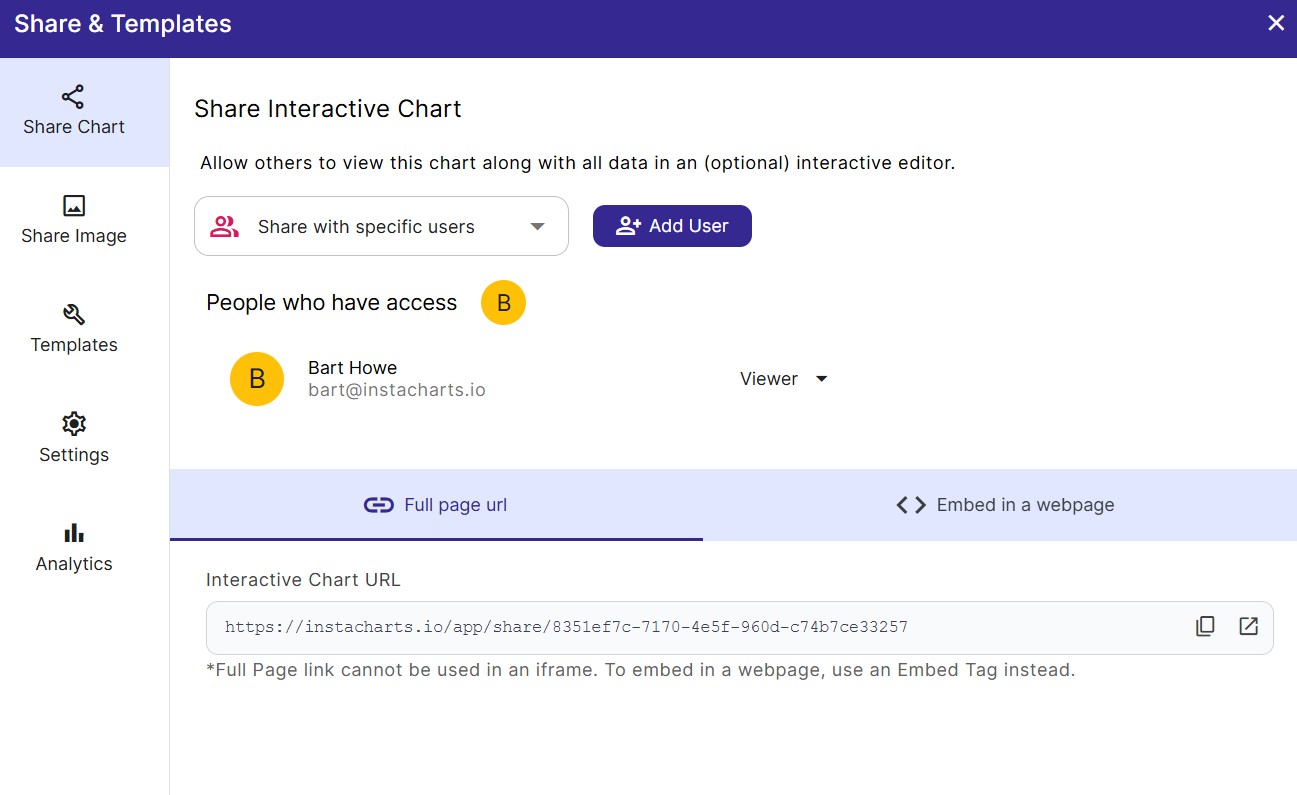
Everyone with access is listed under People who have access. The avatars beside the heading are the members of your workspace, who can always open the chart. To remove someone, click Viewer next to their name, then Remove Access.
Full Page URL
The Full page url tab holds the Interactive Chart URL. Send this link to open the chart on its own full page. Customize the page with the Page Title, Page Theme and Show Editor Controls settings.
The full page link cannot be placed inside an iframe. To show the chart inside a webpage, use the embed code below.
Embed in a Webpage
The Embed in a webpage tab holds two ways to place the chart inside a webpage:
- Embed URL Copy this URL and paste it into services that take an embed URL, like Notion.
- Embed Tag Copy this HTML tag and paste it directly into an HTML webpage or a service that accepts HTML.
Options for the Embed Tag:
| Option | What it does |
|---|---|
| Responsive | The default. Adds a small script with the iframe so the frame’s height grows and shrinks to fit the chart. |
| Iframe Only | Just the iframe tag with a fixed height, with no script. |
| SEO data | Adds JSON-LD structured data with the chart’s title, columns and source. |
| SEO caption | Adds a visible caption below the chart with its title and a description of the data, styled by your website. |
| Customize | Sets the embed’s Height (px), Width (px), Border, and Background color. |
Every Embed Tag includes a title attribute with the chart’s title and subtitle. See
Embed Charts in a Website for sizing, SEO and troubleshooting, and
Improve SEO for Embedded Charts for the SEO options.
Embed in a Website Builder
Below is how to integrate with different website builders as of Jan 2026:
- Bubble Drag an HTML Element onto your page, then paste in the Embed Tag under Appearance.
- Webflow Add a Code Embed Element to your page, then paste in the Embed Tag.
- WordPress Use the Embed Tag and paste it into a Custom HTML block
- Ghost Add a raw HTML card and paste in the Embed Tag
- Notion Add an Embed Block, and paste in the Embed URL
- Medium Medium limits third party embeds. Download your chart image to svg or png, and upload the image to your Medium article.
- Substack Substack also limits third party embeds. Download your chart image to svg or png, and upload the image to your Substack article.
- Wix Add an HTML Embed Element. Choose Website address and paste in the Embed URL or choose Code and paste in the Embed Tag.
- Squarespace Add an Embed Block. Embed as a Code Snippet, then paste in the Embed Tag.
- Shopify Add a Custom Liquid Section. Paste the Embed Tag into the Liquid code text area.
Share Chart Image
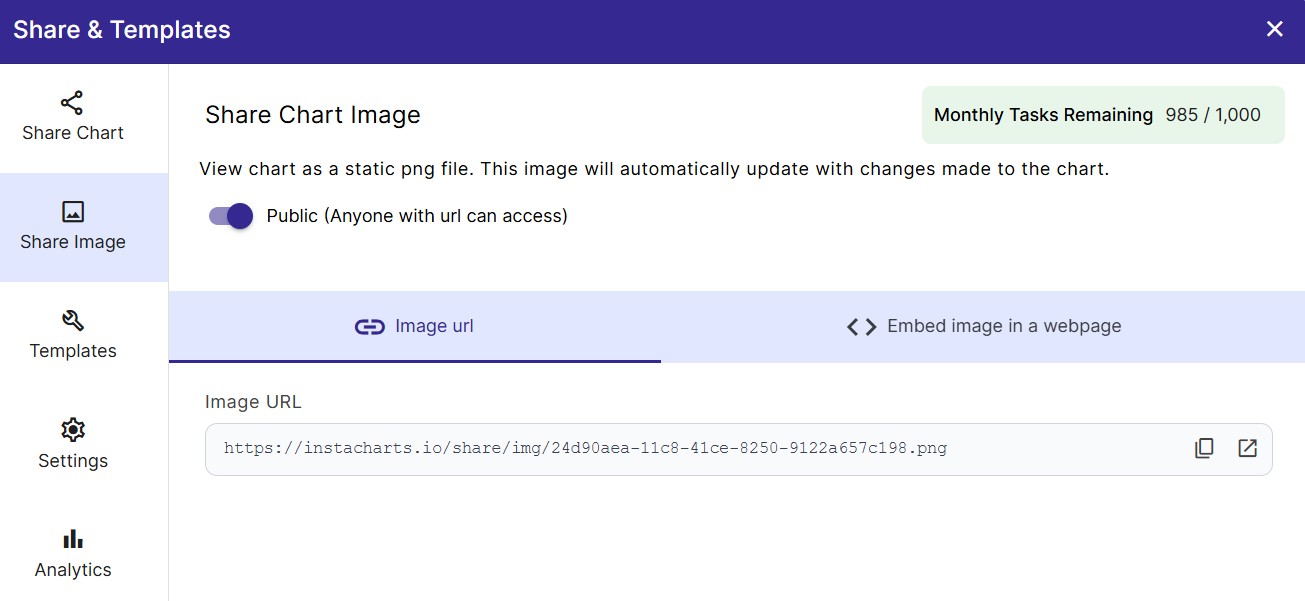
You can also share static chart images with others. These images will automatically update with any changes made to the underlying chart.
Select Share Image on the left side of the Share dialog and turn on the toggle. It changes from Not Shared to Public (Anyone with url can access). Two tabs then appear:
- Image url The Image URL to send to others or use anywhere an image link is accepted.
- Embed image in a webpage The Image Tag, an HTML image tag ready to paste into a webpage. It uses the chart’s
title and subtitle as the image’s
alttext.
Currently shared images are only available in .png format. Shared images are a good fit for emails, slide decks, and sites that only accept images.
Templates
The Templates tab turns the chart into a template. A template creates new charts on the fly: the active chart sets the default options, and you send the chart data and any changes through URL parameters.
Turn the toggle from Template Off to Template On to enable the template. The URL Customization checkboxes then fill the template links with example parameters, which you replace with your own values:
- Test Data
- Test Data w/Series
- Chart Toolbar Params
- Text Params
- Legend Params
- Label Params
- Style Params
- Sort Params
- Limit Items Params
- Filter Params
- Axis Min & Max Params
- Trend Lines Params
- Axis Style Params
- Chart Type Options
Every template URL needs an x parameter and either a y or a series data parameter.
The template links come in four forms: a Full page url, an Image url, an Embed in a webpage tag, and an Embed image in a webpage tag. Templates use the same share settings as the chart.
See Chart Templates for every URL parameter, and Generate Charts with a Template for a step by step guide.
Share Settings
If the chart is currently shared, options appear under the Settings tab that allow you to customize the share. The settings apply to the interactive chart, the embed and the template. Until something is shared, the tab shows “Share a chart, image or enable templates to view settings.”
Share & Template Settings
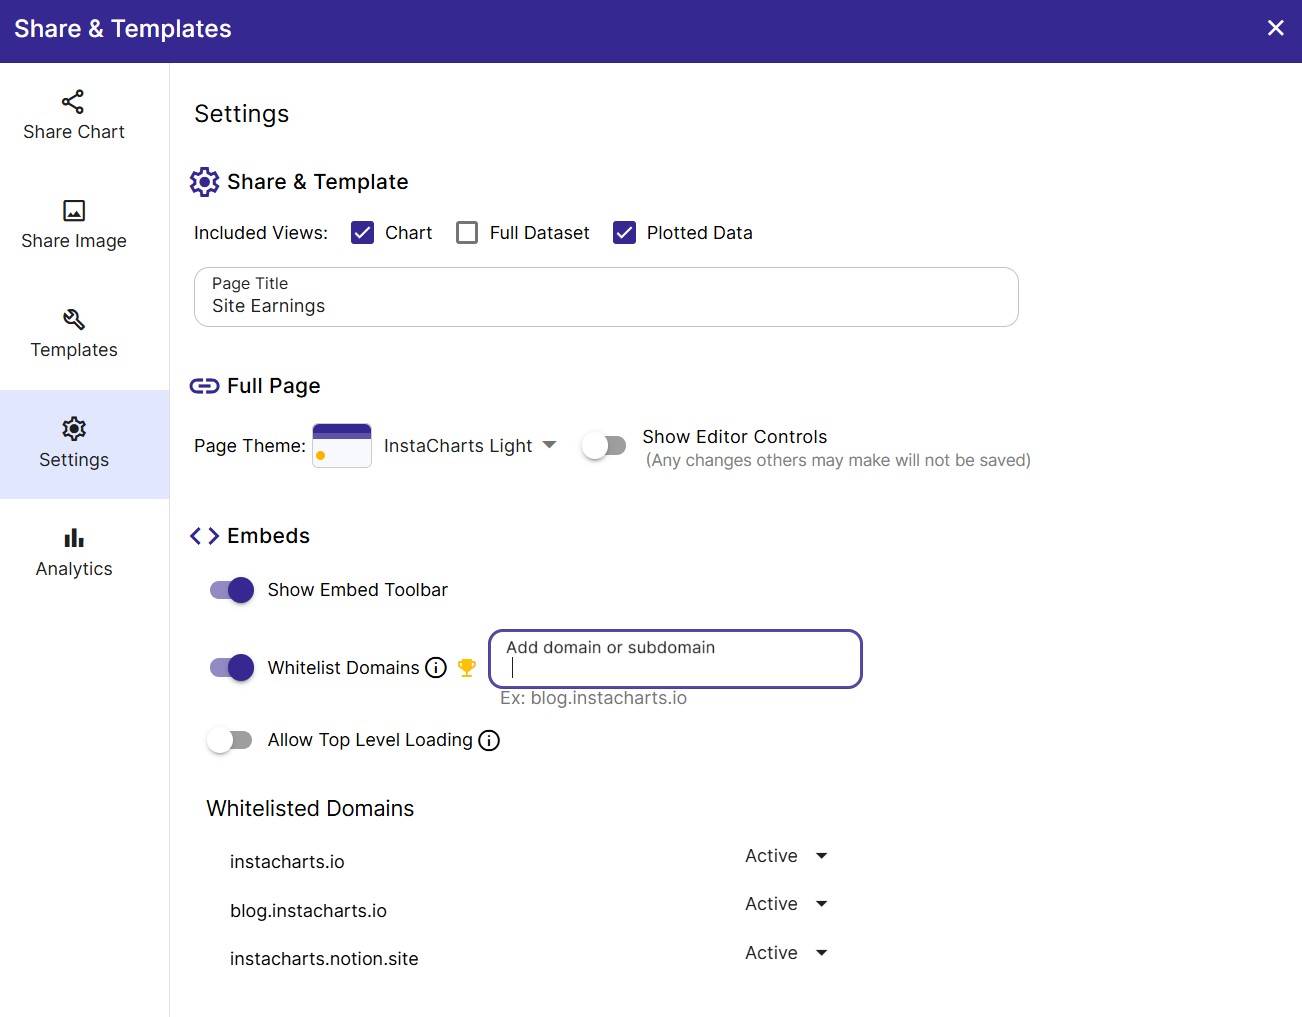
Included Views
Each shared chart can have up to 3 different views enabled. Use the checkboxes to select which views should be included in the share.
Views:
- Chart : Show the chart
- Full Dataset : Show the full dataset as a data table.
- Plotted Data : Show the data plotted in the chart as a data table.
If more than one view is selected, a dropdown will appear in the share that allows you to switch views.
DataTable Colors
When Full Dataset or Plotted Data is selected, the DataTable Colors dropdown appears next to the views. It sets the color scheme of the data tables in the full page interactive chart and in embeds.
- Light: Data tables use a white background with dark text.
- Dark: Data tables use a dark background with light text.
- Match Chart: Data tables follow the chart’s background color. A dark chart background gives dark tables, and a light or transparent chart background gives light tables.
Match Chart keeps an embed looking consistent when viewers switch between the chart and its data, since the tables pick up the same light or dark look as the chart.
Page Title
Optionally change the page title of the shared chart.
Chart Sizing
Chart Sizing controls how the chart fills a browser window or embed frame that is smaller than the size you built the chart at.
- Responsive: The chart redraws itself to fit the space it has. Text stays full size, and the layout adjusts for small screens. Embeds fill the height of the frame on your website.
- Scale chart to fit screen: The chart is drawn at the size you built it and then shrunk to fit, so it looks the same as it does in the editor. Text shrinks along with the chart. Embeds resize their frame to the height of the chart.
Choose Responsive for charts that need to stay readable on phones. Choose Scale chart to fit screen when the chart has to keep the exact layout you designed.
Full Page Settings
Page Theme
Change the page theme of full page interactive charts. There are currently 12 themes to choose from.
Themes apply to full page interactive charts only.
Show Editor Controls
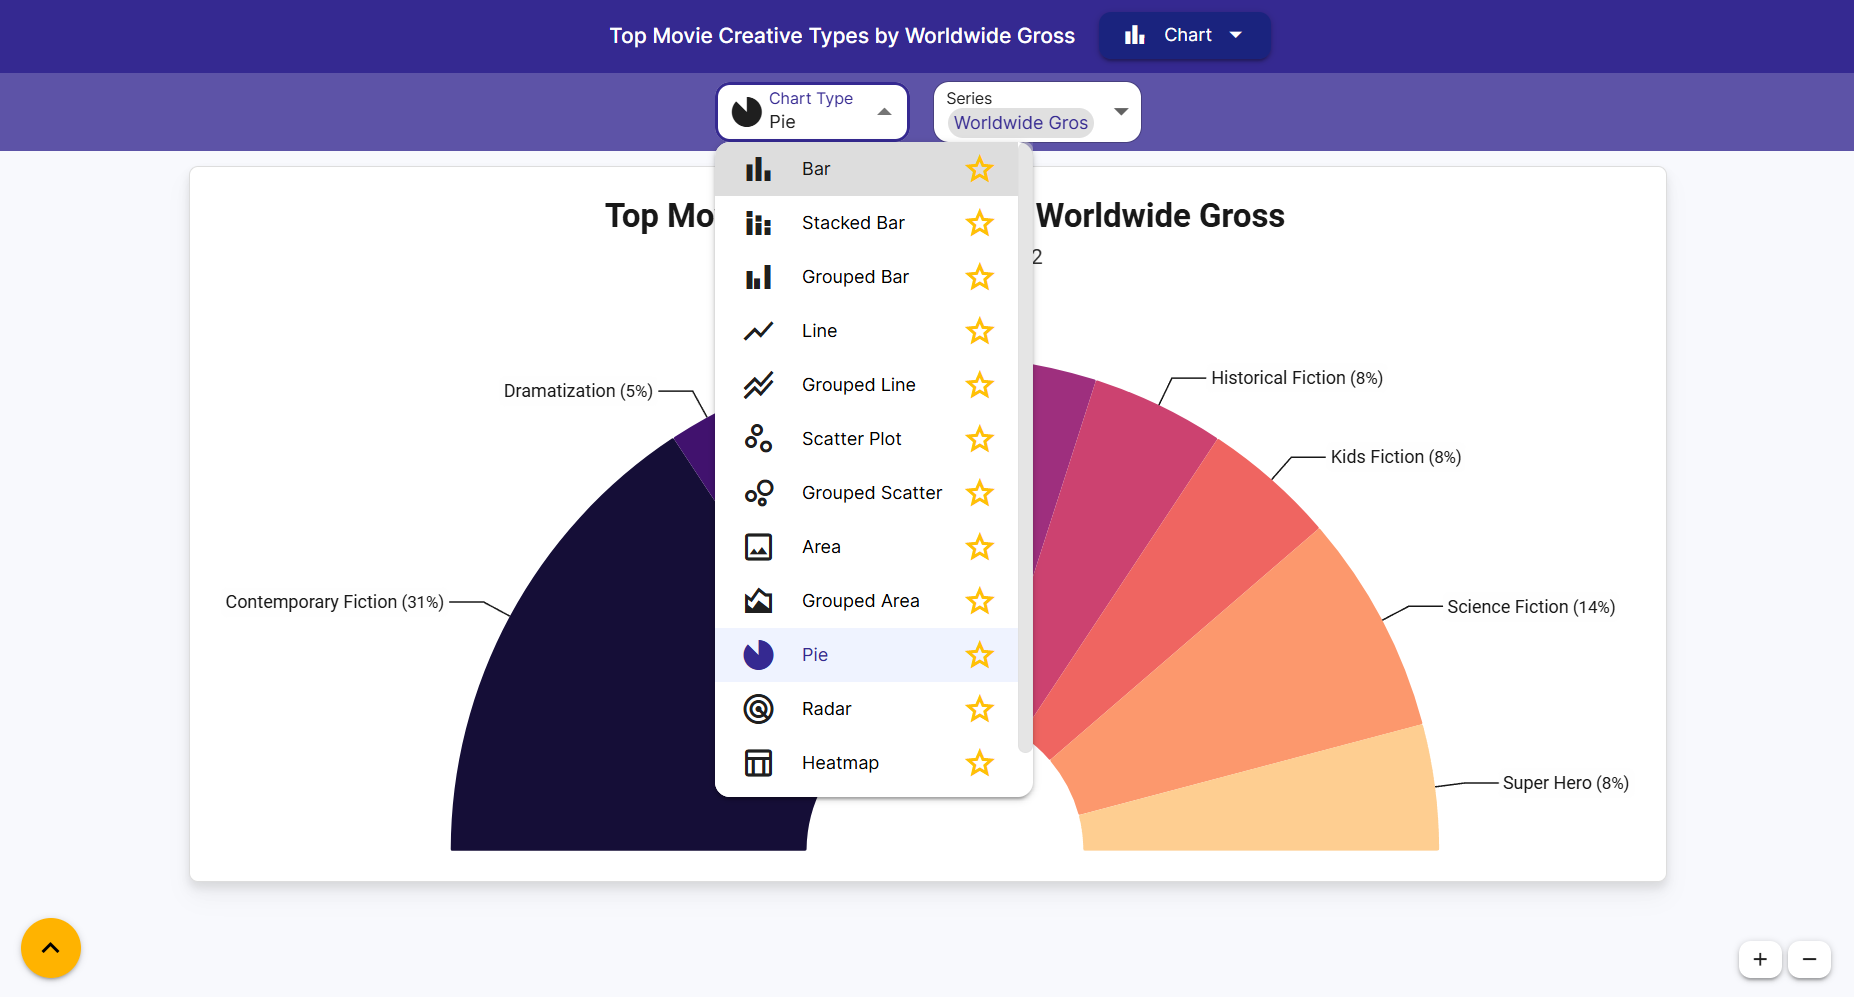
Sometimes a dataset is best represented by multiple charts instead of just one. Enable the editor controls to allow a viewer to change chart axis, chart type and many other chart settings to change the chart that is displayed.
The editor controls add a menu to the full page chart, so viewers can export the chart and adjust its data, axes and legends, labels, text, size and style, chart options, and annotations. Changes viewers make are not saved to your chart.
Embed Settings
Show Embed Toolbar
This controls whether the bottom toolbar is shown on embedded charts and data tables. The embed toolbar contains:
- A dropdown to switch between views
- An Export button to export the chart image or download data
- A View Larger button to open the embedded chart into a new tab. This button is hidden when Allow Top Level Loading is off.
Match Toolbar to Chart
When Show Embed Toolbar is on, the Match Toolbar to Chart toggle appears next to it. Turn it on to color the embed toolbar with the chart’s background color, so the toolbar blends into the chart. Text and buttons switch to light or dark so they stay readable. Charts without a background color keep the default toolbar.
Whitelist Domains
This is a paid feature. Free workspaces see an Upgrade Plan to whitelist domains link.
Domain Whitelisting is a security feature that keeps your charts from being embedded and displayed on unauthorized websites. By default, charts are embeddable anywhere. To turn on this restriction, specify the exact domains and subdomains allowed to display the chart content.
Turn on Whitelist Domains, then type each domain into Add domain or subdomain and press Enter. Added domains are listed under Whitelisted Domains.
You must enter the full domain or subdomain where the chart will be embedded. Wildcards are not supported.
| Domain Type | Input Example | Chart Display Location |
|---|---|---|
| Main Domain | example.com | https://example.com/page |
| Standard Subdomain | blog.example.com | https://blog.example.com/post |
| Specific Path (Not supported) | example.com/page | The system ignores paths and only uses the domain. |
Example: If you only add reports.clientportal.com to the whitelist, the chart will not load on
www.clientportal.com or any other site.
The whitelist applies to everything shared from the chart: the interactive chart, its embed, the shared chart image and the chart template.
Allow Top Level Loading
When Whitelist Domains is turned on, the Allow Top Level Loading toggle appears next to it. Top level loading means opening a chart URL directly in the browser address bar, such as the full page interactive chart link or the full page template link. The toggle is on by default, and the caption under it shows what viewers can currently open.
- On (Embeds & Full Screen Shares are viewable): Embeds load on your whitelisted domains, and anyone with the link can open the full page interactive chart.
- Off (Only embeds are viewable): Embeds load on your whitelisted domains, and full page views of the chart are turned off.
Turning Allow Top Level Loading off changes the share in these ways:
- The full page interactive chart link and the full page template link show a “This chart is private or no longer shared” page in place of the chart.
- The Full page url tab is hidden under Share Chart and under Templates in the Share dialog.
- The View Larger button is removed from the embed toolbar, and from the menu on small embeds.
- Shared image URLs and template image URLs load only inside an
<img>tag on a whitelisted domain. Opening them directly in the browser address bar is blocked.
Turn it off when a chart should only be viewable inside your own website or web app.
Analytics
This is a paid feature. Free workspaces see an Upgrade Plan to view analytics link.
The Analytics tab of the Share & Templates window shows how many people are viewing the chart. View counts are split between Shares (the full page interactive chart) and Embeds (the chart loaded inside another website), with an all time summary, daily and monthly view trends, and the top referring pages for the last 30 days and for all time. Every table can be exported to CSV.
Analytics start once the chart is shared. Until then, the tab shows “Share this chart to start tracking embed views.”
See Share Analytics for what each metric means and how views are counted.
Stop Sharing
- Interactive chart and embeds Set the share mode back to Private. The link and every embed stop working right away.
- Chart image Turn the Share Image toggle back to Not Shared.
- Template Turn the template toggle back to Template Off.
Deleting a chart also removes all of its shares. See Delete Chart.
Charts that are shared show a share icon in the chart select dropdown, so you can see at a glance which charts in a sheet are shared. See Select Active Chart.
Frequently Asked Questions
Do viewers need an InstaCharts account to see a shared chart? No. Anyone with the link can view a publicly shared chart or embedded chart without an account.
Can viewers edit my chart or change my data? Viewers can change chart display options (axis, chart type, colors) to explore the data, but their changes are not saved and do not affect the original chart.
What is the difference between sharing a link and embedding? Sharing a link sends the viewer to a standalone InstaCharts page. Embedding displays the chart inside your own webpage using an iframe, so the chart appears as part of your site.
What is the difference between an interactive chart and a shared image? An interactive chart lets viewers hover over data points, switch views, and explore the data. A shared image is a static PNG that automatically updates when the underlying chart changes, with no interactive controls.
Can I stop sharing a chart at any time? Yes. Set the share mode back to Private at any time, and the link will stop working immediately.
Why is my embedded chart not showing on my website? If you have Domain Whitelisting enabled, make sure your site’s domain is listed exactly as it appears. A whitelist with no domains blocks the embed on every site. If whitelisting is not configured, the chart should embed on any site.
Why does my share link say “This chart is private or no longer shared”? Check the share mode first, since a Private chart shows this page. If the chart is Public, check whether Domain Whitelisting is on with Allow Top Level Loading turned off. That combination turns off the full page interactive chart and the full page template link, so the chart can only be viewed as an embed on a whitelisted domain.
Related
- Share a Chart - a short guide to sharing your first chart
- Embed Charts in a Website - embed sizing, SEO and website builders
- Chart Templates - every template URL parameter
- Share Analytics - views for every chart and dashboard
- Share a Dashboard - share several charts on one page
- Chart Management - an overview of every way to share