
Workspace
Your workspace is your personal hub inside InstaCharts. Everything you create - sheets, charts, dashboards, and shares - lives here, and all your account settings and usage details are managed from this area.
Workspace
When you log in, your workspace is the first thing you see. It lists all your sheets and dashboards, and gives you quick access to create new ones.
Selecting a Workspace
In the upper left corner of the workspace you’ll find the workspace selector. Workspaces let you organize your sheets into separate groups - for example, by project, client, or team.
Clicking the workspace selector opens a dropdown where you can:
- Switch workspaces - select any workspace to load its sheets in the workspace
- Set a workspace color - click the palette icon next to a workspace to color-code it, useful for telling workspaces apart at a glance
- Add a new workspace - create a fresh workspace with its own set of sheets
When you switch workspaces, it will reload to show only the sheets in the selected workspace.
Each account can own a set number of free workspaces. When you reach that number, the Add Workspace dialog offers Continue to Checkout, which takes you to the upgrade page to buy the new workspace on the Starter or Pro plan. The workspace is created as soon as the payment goes through. Only free workspaces count toward that number.
Members, Analytics, Settings, and Task History
Below the sheet table, the left sidebar has its own links to Workspace Members, Share Analytics, Workspace Settings, and Task History - a log of every automated task run in the workspace (data syncs, template renders, API calls, and more), showing the item name, date, task type, and which app triggered it. These are separate from the workspace selector dropdown described above.
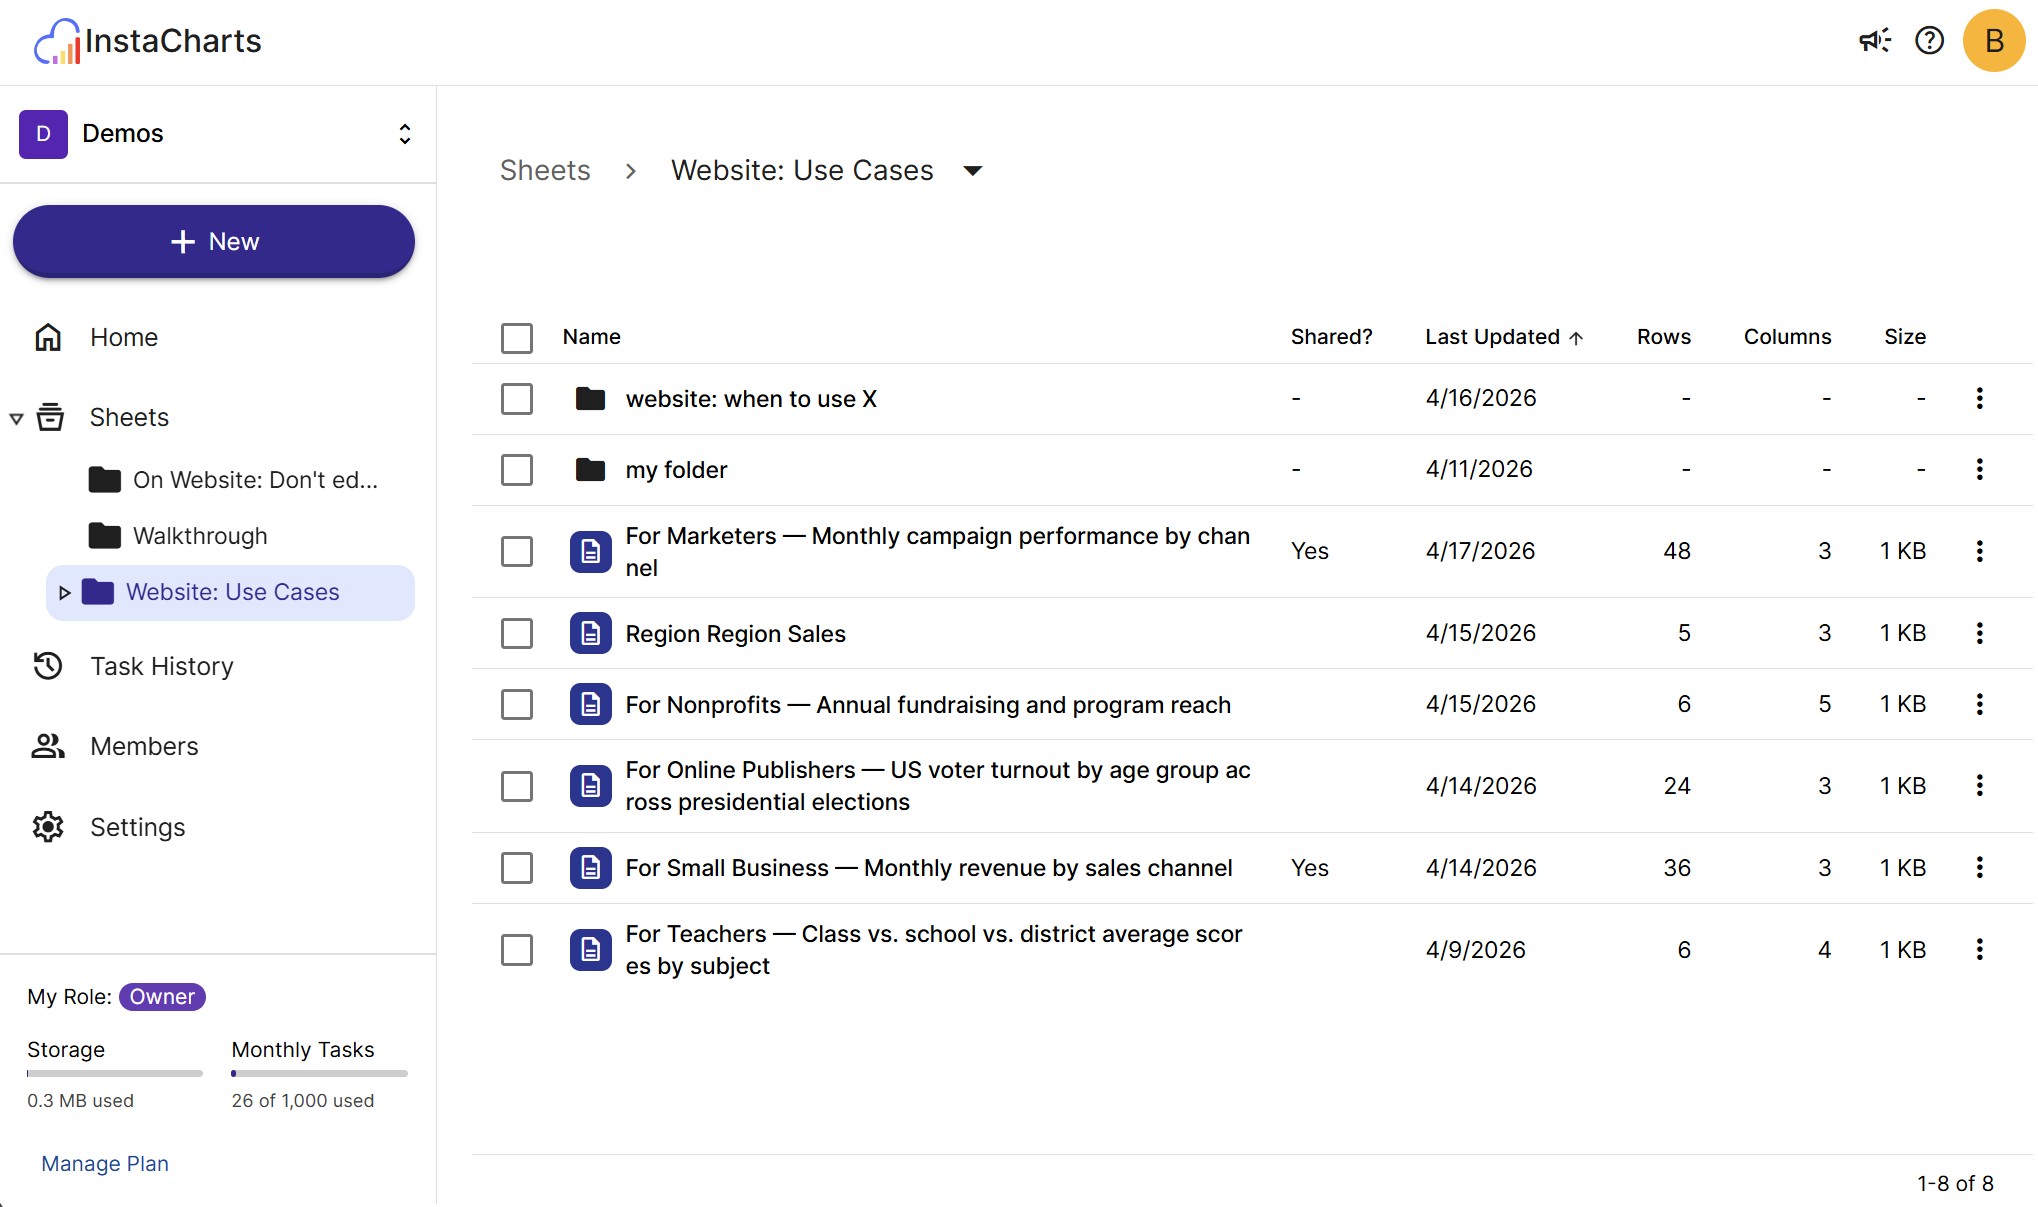
From the sheet table you can:
- Open a sheet - double-click any row to open it
- Rename a sheet - open the row menu (the three-dot icon) and select Rename
- Update a sheet’s data - open the row menu, or right click the sheet, and select Update Data to update it with a newer file from your device
- Delete a sheet - open the row menu and select Delete
Creating a new sheet
There are two ways to create a new sheet from your workspace:
- Click the New -> New Sheet button in the upper left corner and follow the upload prompts
- Drag and drop a spreadsheet file directly onto the workspace
For a full walkthrough, see Import Data from File or Import from Google Sheets.
Creating a new dashboard
Click New -> New Dashboard to create a dashboard; a single page that combines charts, data tables, KPI metrics and text notes built from the sheets in your workspace. Dashboards appear in the workspace alongside your sheets and are visible to your workspace members.
Usage & Plan
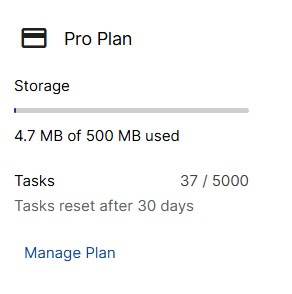
Every workspace has its own plan, and its limits apply to everyone working in it. Tasks and AI credits are one pool per workspace that grows with its seats: each seat adds the plan’s tasks and AI credits, and the work done by every member counts against the pool. Storage is counted per workspace, and share views are counted per share. Your current usage is always visible at a glance on the sidebar.
Tasks
Tasks are consumed whenever InstaCharts runs an automated action on your behalf - such as a data sync or a template-generated chart. The task counter is a rolling 30-day total.
See Tasks for a full breakdown of what counts as a task.
Shares
Each public view of a shared chart counts toward your monthly share quota. Views are counted per share, so every share has its own allowance.
See Share Charts for more detail on share types and settings, and Share Analytics to see the view counts behind that quota, per chart and per dashboard.
Account Settings
Account settings are accessible from the user menu in the top-right corner of any page.
From account settings you can:
- Change your email or password
- Manage a workspace’s plan - on the Plan & Billing page, pick a workspace you own to see its limits and seats, upgrade it, or open the billing portal to change or cancel its subscription
Workspace Limits by Plan
The table below summarizes the key limits for each plan tier. Each workspace gets the limits of its own plan. Limits reset on a rolling 30-day basis unless noted otherwise.
| Feature | Free | Starter | Pro |
|---|---|---|---|
| Rows of data | 500 | 25,000 | 100,000 |
| Tasks / month | 100 | 1,000 | 5,000 |
| Share views / month | 200 | 1,000 | 100,000 |
| File upload size | 2 MB | 10 MB | 20 MB |
| Private shares | - | ✓ | ✓ |
| Domain whitelisting | - | ✓ | ✓ |
To upgrade a workspace, open Plan & Billing in account settings, pick the workspace, and choose Upgrade Plan. Only the workspace owner can upgrade it.