
Share Analytics
Analytics shows you how many people are actually looking at the charts and dashboards you publish. Once a chart, embed, or dashboard is shared, InstaCharts counts every view and reports it back to you as a daily and monthly total, along with the pages that are embedding your charts.
Analytics answers three questions:
- Is anyone viewing this? Total views for all time and for the last 30 days
- When are they viewing it? A day-by-day or month-by-month view count over time
- Where are they viewing it? The top pages on the web that embed your chart
Where to Find Analytics
There are three places to open analytics, and they all show the same numbers.
| Location | What it covers | How to get there |
|---|---|---|
| Workspace Analytics page | Every shared chart and dashboard in the workspace | Click Analytics in the workspace left sidebar |
| Share & Templates dialog | The one chart you have open | Open the Share dialog, then click Analytics in the left sidebar of the dialog |
| Dashboard Share dialog | The one dashboard you have open | Open the dashboard Share dialog, then click Analytics |
The workspace page is the fastest way to compare items, since it lists everything shared in the workspace in a single dropdown. Any workspace member who can view the workspace can open it, so a team sees the same numbers for shares created by anyone in that workspace.
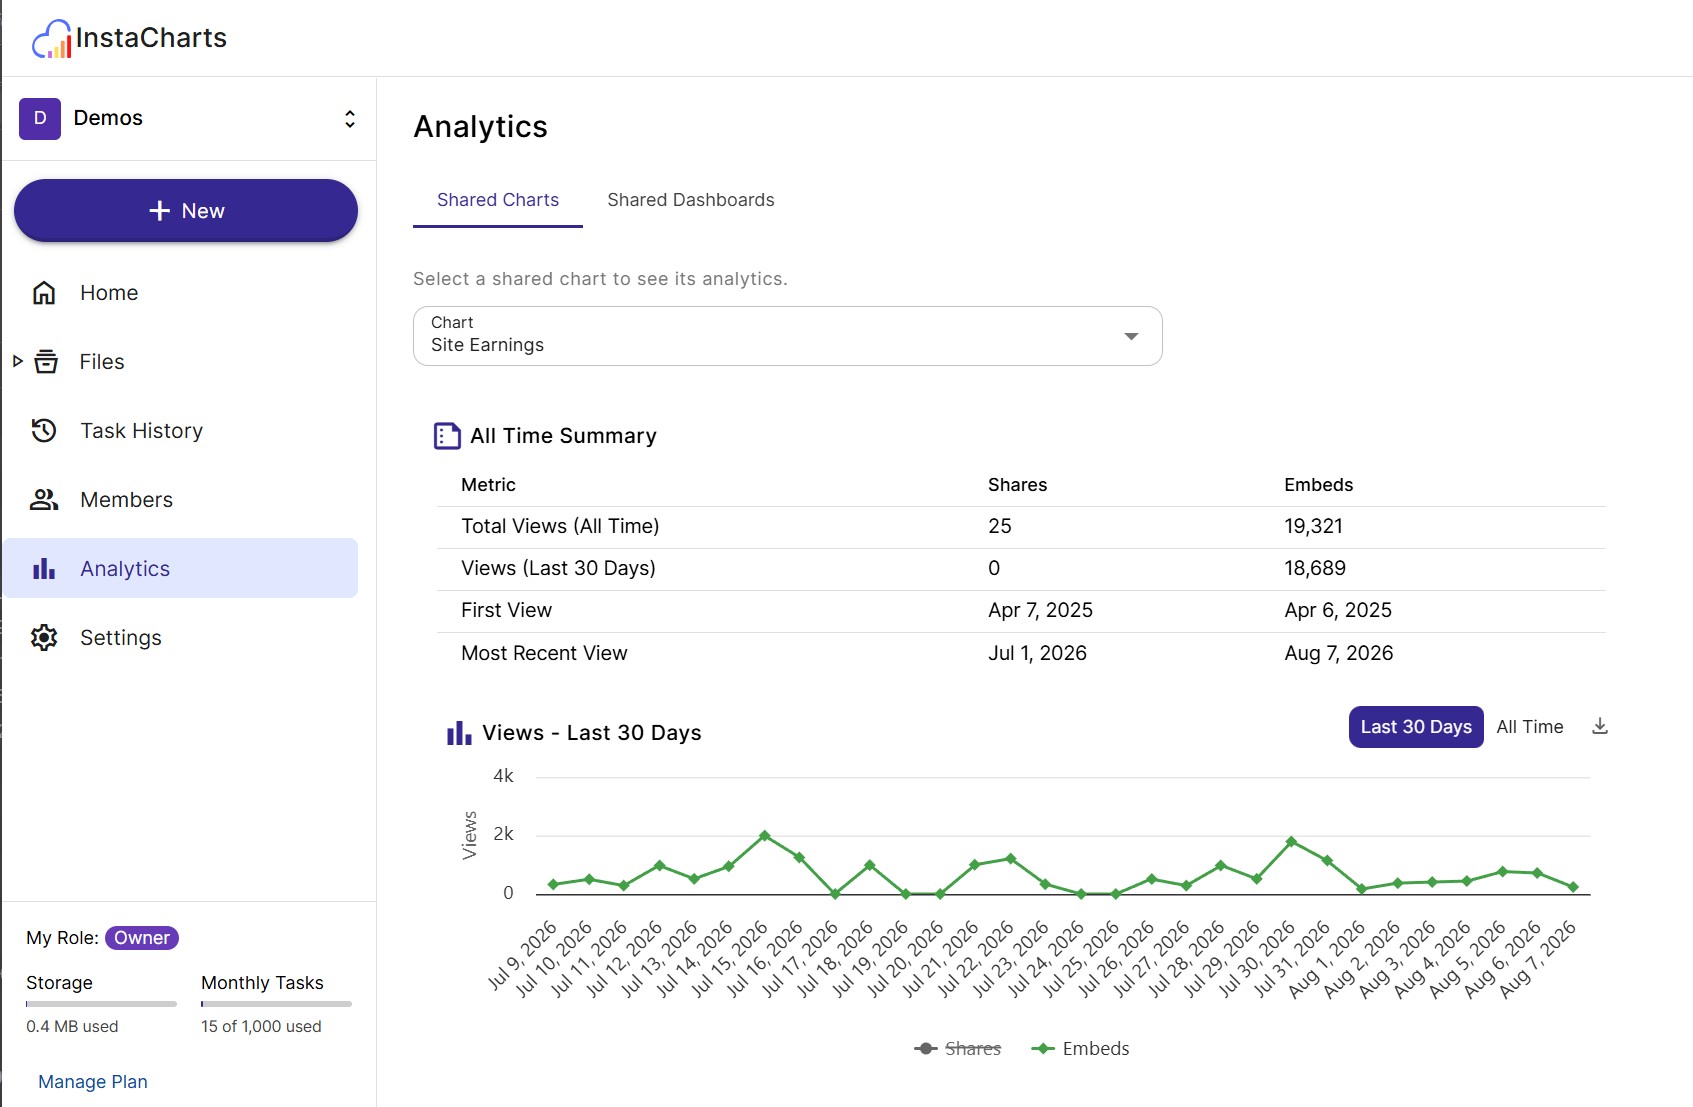
The Workspace Analytics Page
The page has two tabs:
- Shared Charts - every chart in the workspace with an active share, including charts that are only embedded
- Shared Dashboards - every dashboard in the workspace with an active share
Each tab has a dropdown at the top for picking the item you want to inspect. The dropdown shows the sheet the chart belongs to, its all-time view count, and when the chart was last updated, so you can find the right one without opening it. The first item is selected automatically, and the analytics below the dropdown reload when you pick a different one.
Charts and dashboards that are not currently shared do not appear in the list. Share or embed an item first, and it shows up along with any views it collects.
What Counts as a View
A view is recorded each time a shared chart, an embedded chart, or a shared dashboard finishes loading for a visitor. Views are separated into two kinds for charts:
| Type | What it means |
|---|---|
| Shares | Someone opened the full page interactive chart at its share link |
| Embeds | Someone loaded a page on another website that has your chart embedded in an iframe |
A few things worth knowing about the count:
- Every load counts, so a refresh or a repeat visit from the same person adds another view
- Days and months are grouped in UTC, not your local time zone
- InstaCharts stores the date, the share, whether the view came from an embed, the embedding page, and a count. It does not identify individual visitors, and there is no way to see who viewed a chart
Chart and Embed Analytics
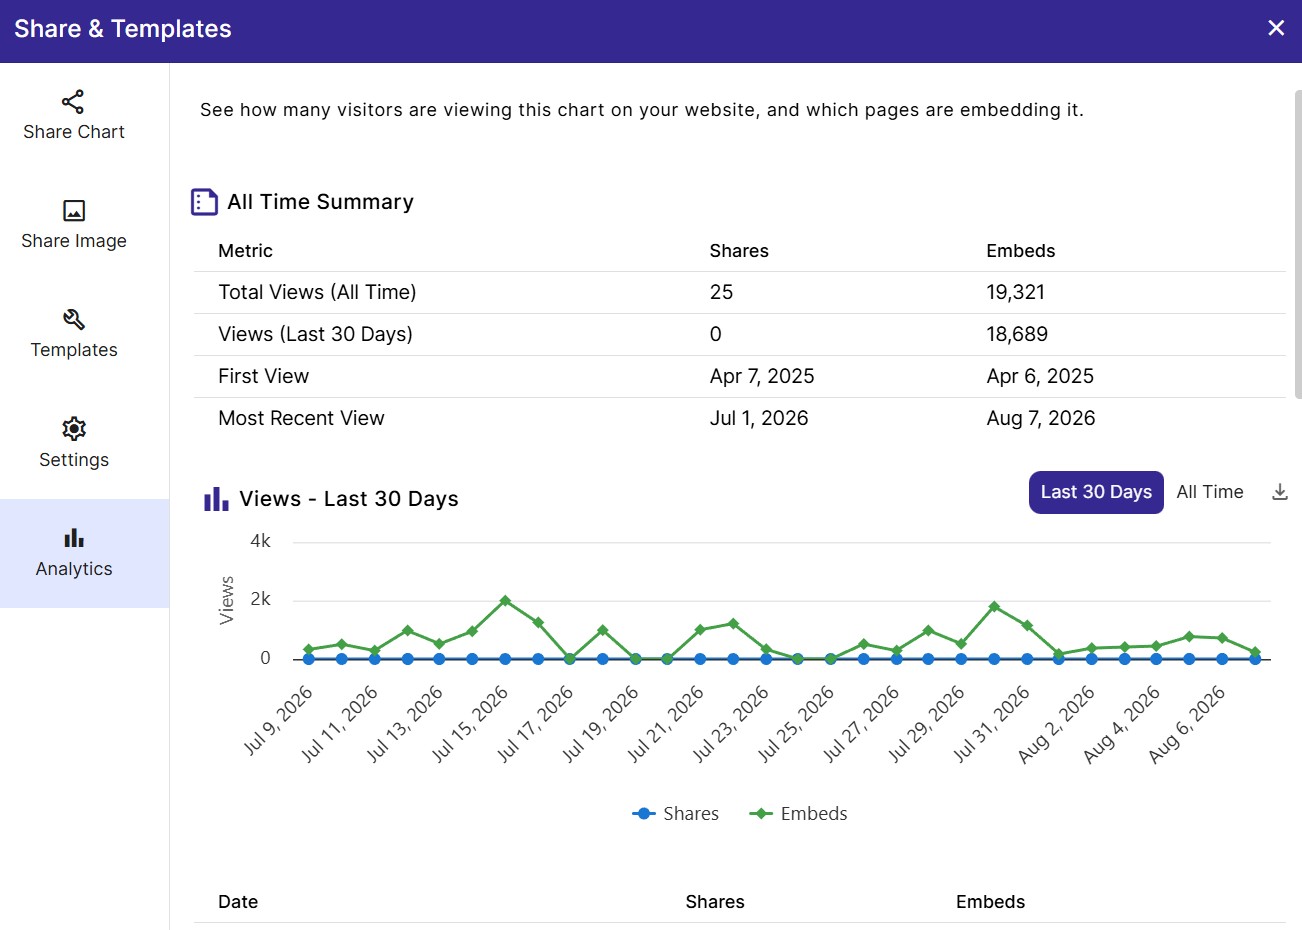
Select a chart from the workspace Analytics page, or open the Analytics tab in the Share & Templates dialog for a chart you have open. Both show the same three sections.
All Time Summary
The summary table breaks every metric into a Shares column and an Embeds column, so you can tell link traffic apart from website traffic at a glance.
| Metric | Description |
|---|---|
| Total Views (All Time) | Every view since the chart was first shared |
| Views (Last 30 Days) | Views in the rolling 30 day window |
| First View | The date the chart was first viewed |
| Most Recent View | The date of the latest view |
If a chart has never been viewed, the summary is replaced with a “No views yet” message. If the chart has never been shared, the Analytics tab tells you to share the chart first.
Views Over Time
Below the summary is a line chart with one line for share views and one line for embed views, followed by the same numbers as a table. Use the toggle above the chart to switch the range:
- Last 30 Days - one row per day, including days with zero views so gaps in traffic are visible
- All Time - one row per month, starting with the first month the chart was viewed
Days and months with no traffic are filled in with a zero rather than being skipped, which keeps the trend line honest instead of compressing quiet periods.
Top Referring Pages
This section lists the top 10 pages that are showing your chart, ranked by view count, in two tables: one for the last 30 days and one for all time. It is the fastest way to find out which blog post or client site is driving traffic to a chart, and to catch sites embedding a chart you did not expect.
Dashboard Analytics
Dashboard analytics work the same way, with one difference: a dashboard has a single view count rather than a shares and embeds split.
Open it from the Shared Dashboards tab on the workspace Analytics page, or from the Analytics tab in the dashboard Share dialog.
| Metric | Description |
|---|---|
| Total Views (All Time) | Every view since the dashboard was first shared |
| Views (Last 30 Days) | Views in the rolling 30 day window |
| First View | The date the dashboard was first viewed |
| Most Recent View | The date of the latest view |
The same Last 30 Days and All Time toggle applies, with a daily line chart and table for the last 30 days and a monthly breakdown for all time.
Export Analytics to CSV
Every analytics table has a download icon next to its heading. Click it to export that table as a CSV file you can open in Excel, Google Sheets, or a BI tool.
The export follows what you are looking at, so switching the range toggle to All Time exports monthly rows instead of daily rows. View counts export as plain numbers so a spreadsheet can total them without any cleanup.
Tables you can export:
- Views for the last 30 days, by day
- Views for all time, by month
- Top referring pages for the last 30 days
- Top referring pages for all time
Analytics and Your Share Quota
The views reported in analytics are the same views that count against your monthly share view quota, so analytics doubles as a way to see how quickly you are using it up. Share views are counted per share and reset on a rolling 30 day basis.
| Plan | Share views per month |
|---|---|
| Free | 200 |
| Starter | 1,000 |
| Pro | 100,000 |
If a popular embed is burning through the quota, the top referring pages table shows you which site is responsible. See Workspace for the full list of plan limits.
Frequently Asked Questions
Do I need a paid plan to see analytics? Yes. Analytics is available on paid plans, on the same tier as private shares and domain whitelisting. Views are recorded for free accounts too, so the history is there once you upgrade.
Can I see who viewed my chart? No. Analytics counts views, it does not identify visitors. There are no names, emails, or IP addresses in any analytics table.
Why do my referring pages only show up for embeds? Full page share links do not record a referring URL, only embeds do. A chart that is shared by link and never embedded still reports view counts, but the referring pages tables stay empty.
Why does a chart I just viewed show no views? View counts are written in batches roughly once a minute. Wait a minute and reopen the Analytics tab.
Do repeat views from the same person count more than once? Yes. Each page load counts as a view, including refreshes and return visits.
What time zone are the daily numbers in? Days and months are grouped in UTC. A view late in your local evening may land on the next day in the report.
Why is my chart missing from the Analytics dropdown? The dropdown only lists charts with an active share. Open the Share dialog and set the chart to Public or share it with specific users, then it appears in the list.
Do shared chart images count as views? The view counts here cover interactive chart shares, embedded charts, and shared dashboards. Static shared chart images are generated as tasks and are tracked against your task quota instead.